LLM Observability with OpenObserve
Monitor, trace, and debug your LLM-powered applications in production using OpenObserve and OpenTelemetry.
What is LLM Observability?
LLM Observability gives you visibility into the behaviour of large language model calls inside your application , similar to traditional APM, but purpose-built for AI workloads.
With it you can track:
- Token usage: prompt, completion, and total tokens per request
- Latency : end-to-end duration of every LLM call
- Model metadata : model name, temperature, max tokens, and other parameters
- Errors : rate limit events, API failures, and timeouts with full context
Under the hood: LLM Observability is OpenTelemetry. There is nothing special about LLM traces compared to regular distributed traces, the work happens on the server side. Any OpenTelemetry-compatible SDK or exporter can ship traces to OpenObserve.
Prerequisites
- Python 3.8+
uvpackage manager (orpip)- An OpenObserve account (cloud or self-hosted)
- Your OpenObserve organisation ID and Base64-encoded auth token
Configuration
Create a .env file in your project root:
# OpenObserve instance URL
# Default for self-hosted: http://localhost:5080
OPENOBSERVE_URL=https://api.openobserve.ai/

# Your OpenObserve organisation slug or ID
OPENOBSERVE_ORG=your_org_id

# Basic auth token — Base64-encoded "email:password"
OPENOBSERVE_AUTH_TOKEN="Basic <your_base64_token>"

# Enable or disable tracing (default: true)
OPENOBSERVE_ENABLED=true

# API keys for services you're using (optional, based on instrumentation)
OPENAI_API_KEY="your-openai-key"
ANTHROPIC_API_KEY="your-anthropic-key"| Variable | Description | Required |
|---|---|---|
OPENOBSERVE_URL | Base URL of your OpenObserve instance | Yes |
OPENOBSERVE_ORG | Organisation slug or ID | Yes |
OPENOBSERVE_AUTH_TOKEN | Basic <base64(email:password)> | Yes |
OPENOBSERVE_ENABLED | Toggle tracing on/off | No (default: true) |
OPENAI_API_KEY | Only needed by the bundled OpenAI example | No |
Option A : Quickstart with the bundled example
Clone the SDK repository and run the included OpenAI example to see traces flowing into OpenObserve with minimal setup.
1. Clone the repository
git clone https://github.com/openobserve/openobserve-python-sdk/
cd openobserve-python-sdk
2. Install dependencies
uv pip install openobserve-telemetry-sdk openai opentelemetry-instrumentation-openai python-dotenv
uv pip install -r requirements.txt
3. Add your .env file to the project root (see Configuration above), including OPENAI_API_KEY.
4. Run the example
uv run examples/openai_example.pyOpen your OpenObserve dashboard → Traces to see the spans appear.
Option B: Integrate into your own project using the OpenObserve SDK
Use this if you want the simplest possible integration without cloning the repository.
1. Install dependencies
uv pip install openobserve-telemetry-sdk opentelemetry-instrumentation-openai dotenv2. Initialise the SDK at your application entry point and Use your LLM client as normal
Sample OpenAI Instrumentation:
from opentelemetry.instrumentation.openai import OpenAIInstrumentor
from openobserve import openobserve_init

# Initialize OpenObserve and instrument OpenAI
OpenAIInstrumentor().instrument()
openobserve_init()

from openai import OpenAI

# Use OpenAI as normal - traces are automatically captured
client = OpenAI()
response = client.chat.completions.create(
    model="gpt-3.5-turbo",
    messages=[{"role": "user", "content": "Hello!"}]
)
print(response.choices[0].message.content)
Sample Anthropic Instrumentation:
from opentelemetry.instrumentation.anthropic import AnthropicInstrumentor
from openobserve import openobserve_init

# Initialize OpenObserve and instrument Anthropic
AnthropicInstrumentor().instrument()
openobserve_init()

from anthropic import Anthropic

# Use Claude as normal - traces are automatically captured
client = Anthropic()
response = client.messages.create(
    model="claude-3-5-sonnet-20241022",
    max_tokens=1024,
    messages=[{"role": "user", "content": "Hello!"}]
)
print(response.content[0].text)
Every call is now captured as a trace span and exported to OpenObserve.
Note: The openobserve-telemetry-sdk is an optional thin wrapper around the standard OpenTelemetry Python SDK that simplifies setup and exporter configuration. If you already use OpenTelemetry, you can send telemetry directly to the OpenObserve OTLP endpoint without it.
What gets captured
The opentelemetry-instrumentation-openai library attaches the following attributes to each span automatically:
| Attribute | Description |
|---|---|
llm.request.model | Model name (e.g. gpt-4o) |
llm.usage.prompt_tokens | Tokens in the prompt |
llm.usage.completion_tokens | Tokens in the response |
llm.usage.total_tokens | Total tokens consumed |
llm.request.temperature | Temperature parameter |
llm.request.max_tokens | Max tokens parameter |
duration | End-to-end request latency |
error | Exception details if the request failed |
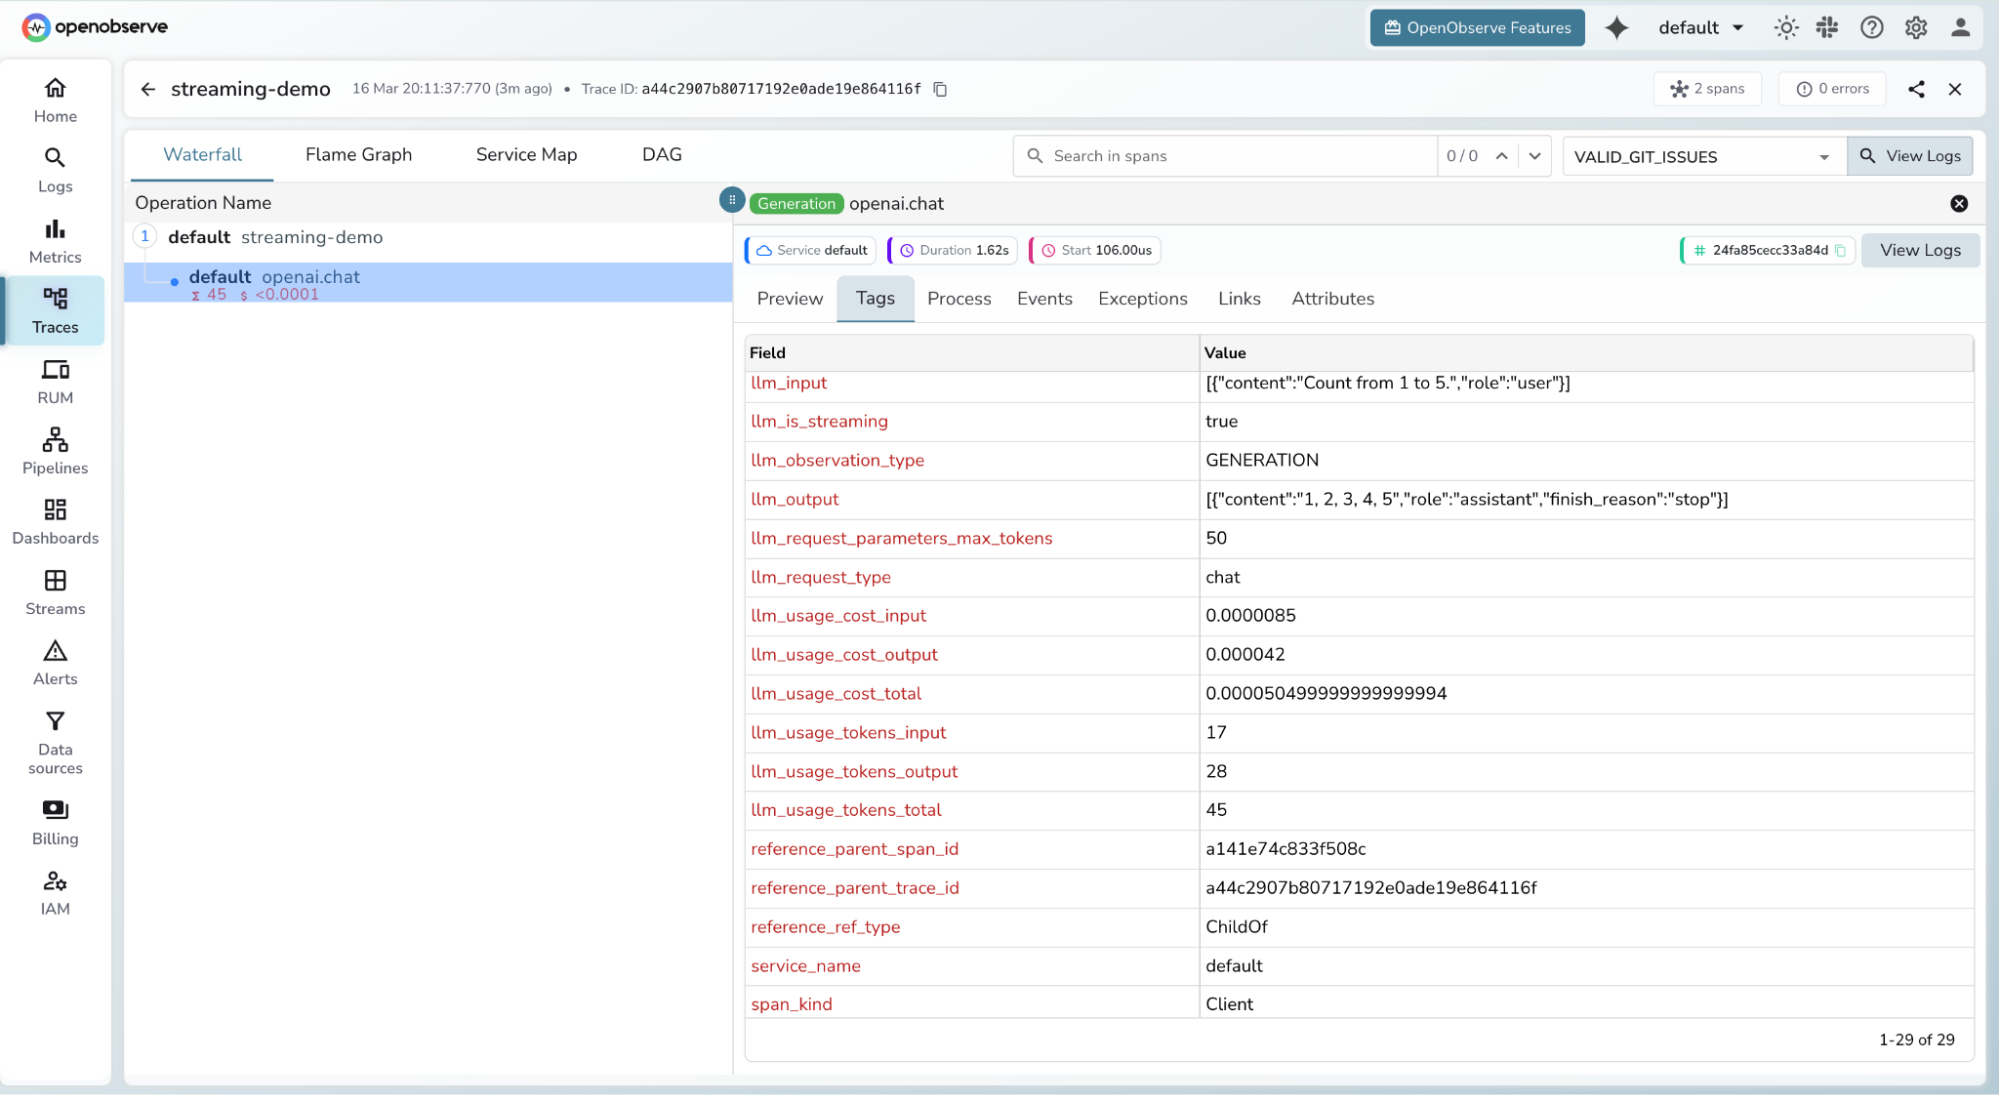
In addition, OpenObserve computes and stores the following token and cost fields on each LLM span:
| Field | Type | Description |
|---|---|---|
llm_usage_tokens_input | Int64 | Input (prompt) tokens |
llm_usage_tokens_output | Int64 | Output (completion) tokens |
llm_usage_tokens_total | Int64 | Total tokens consumed |
llm_usage_cost_input | Float64 | Cost of input tokens |
llm_usage_cost_output | Float64 | Cost of output tokens |
llm_usage_cost_total | Float64 | Total cost of the LLM call |
The cost fields (llm_usage_cost_input, llm_usage_cost_output, llm_usage_cost_total) are populated only when the Model Pricing feature is enabled (ZO_MODEL_PRICING_ENABLED).
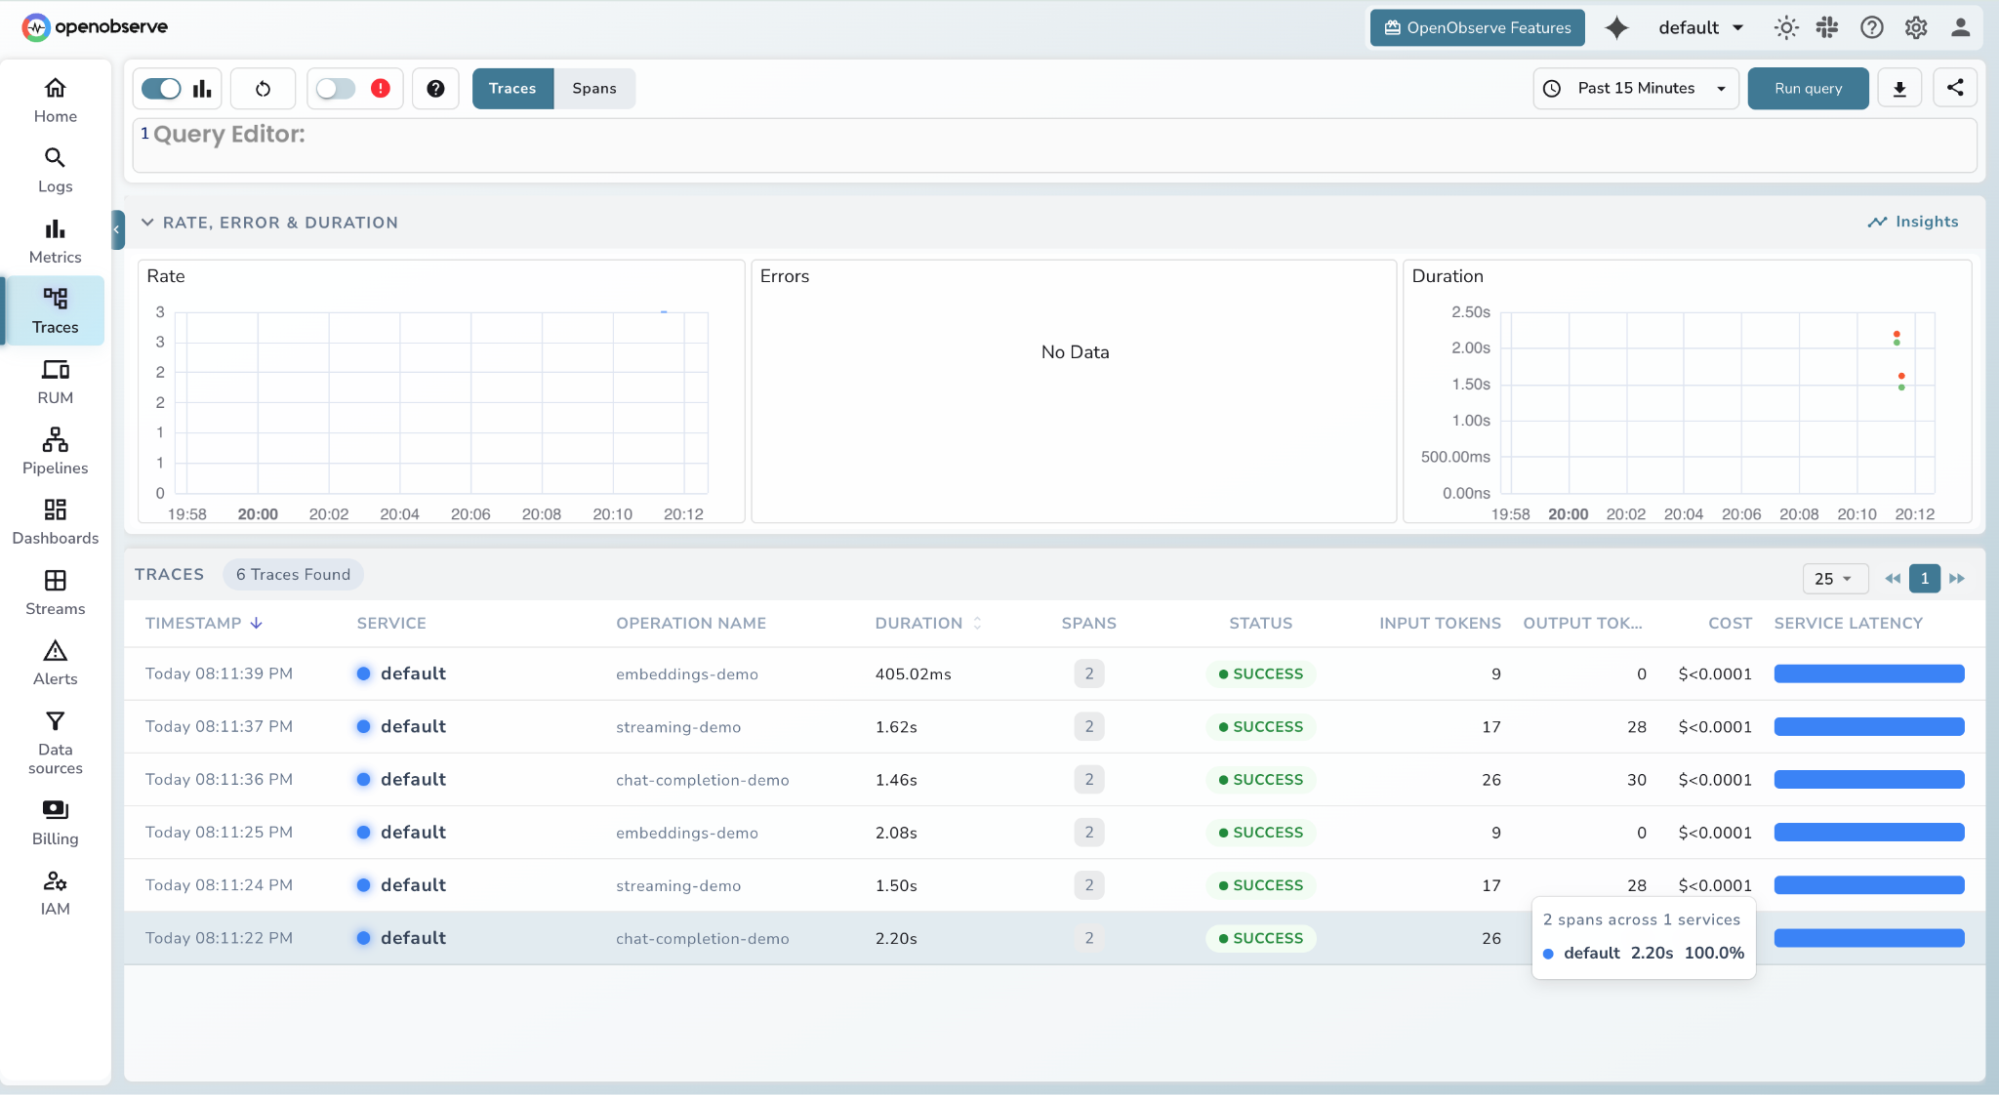
Viewing traces in OpenObserve
-
Log in to your OpenObserve instance
-
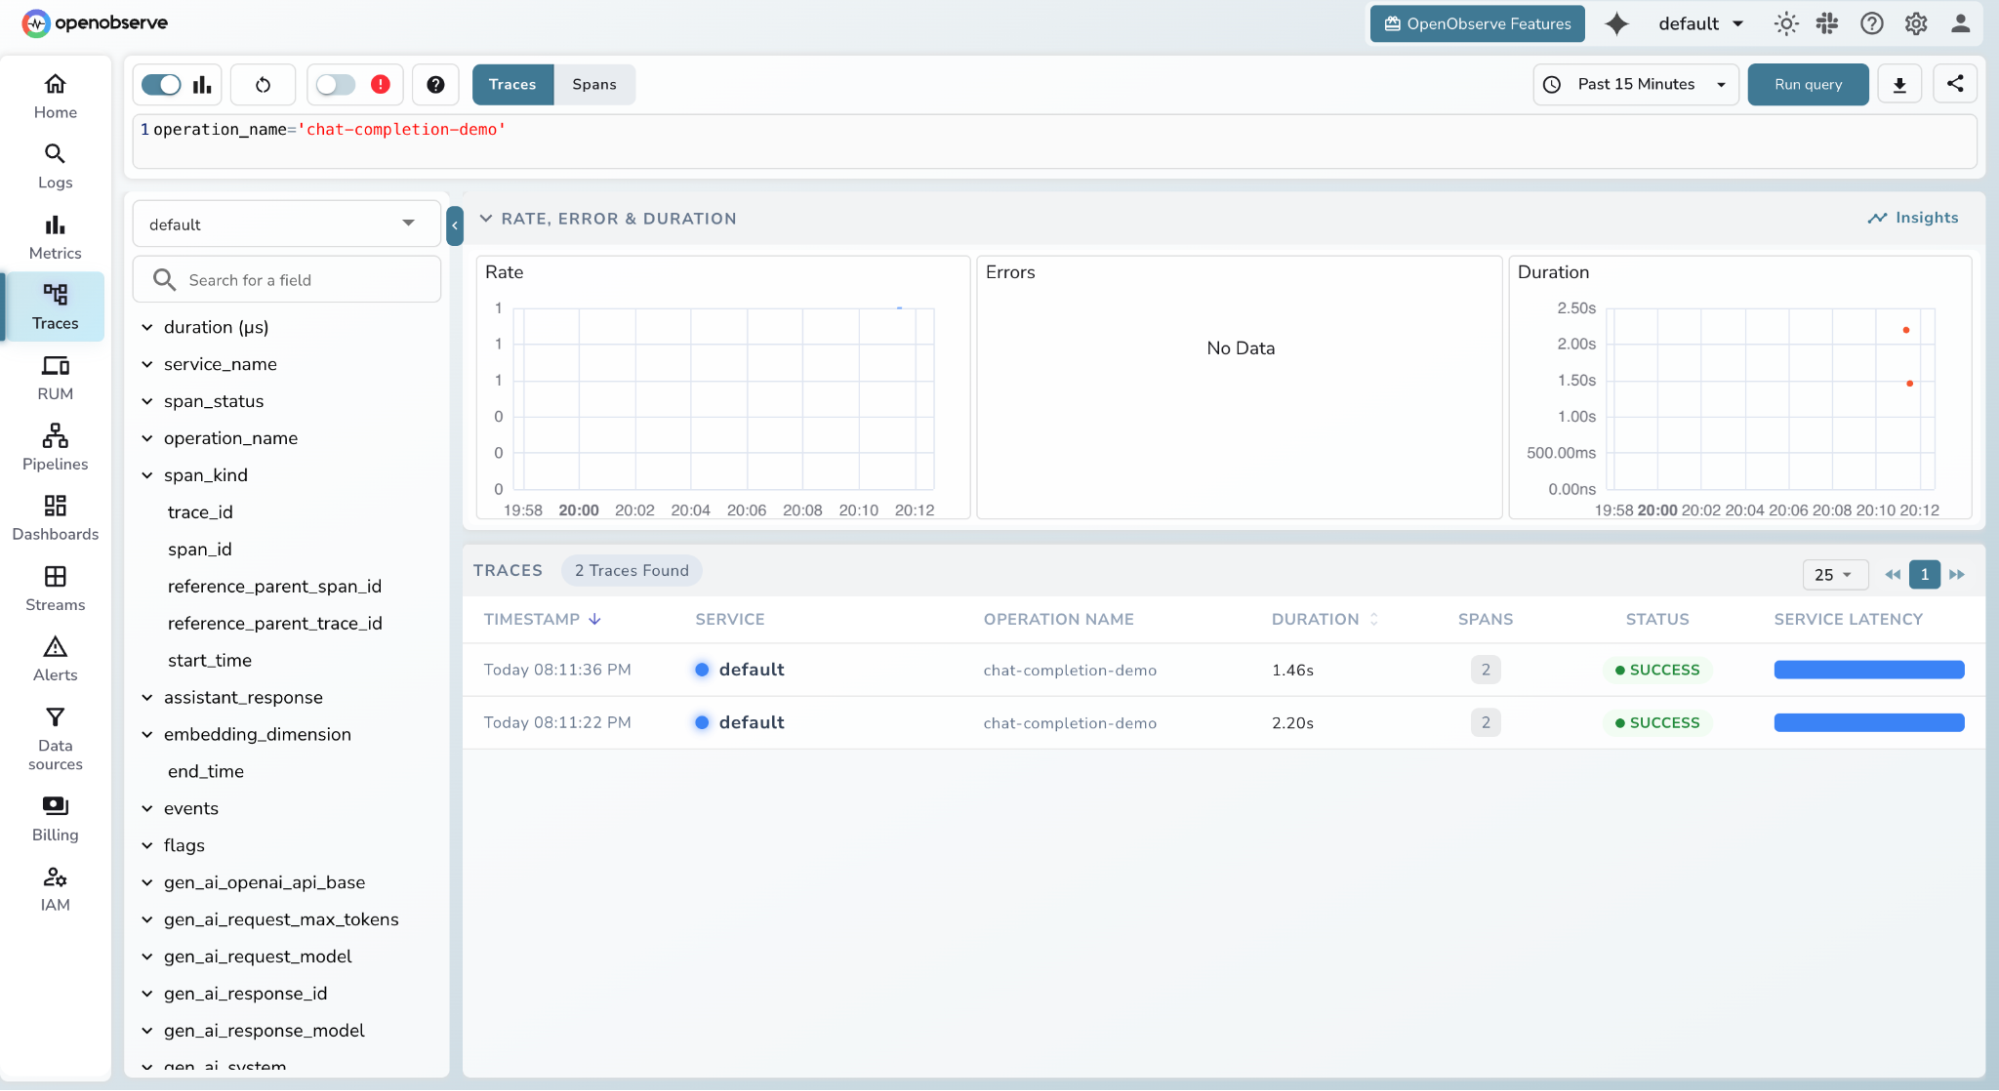
Navigate to Traces in the left sidebar
-
Filter by service name, model, or time range
-
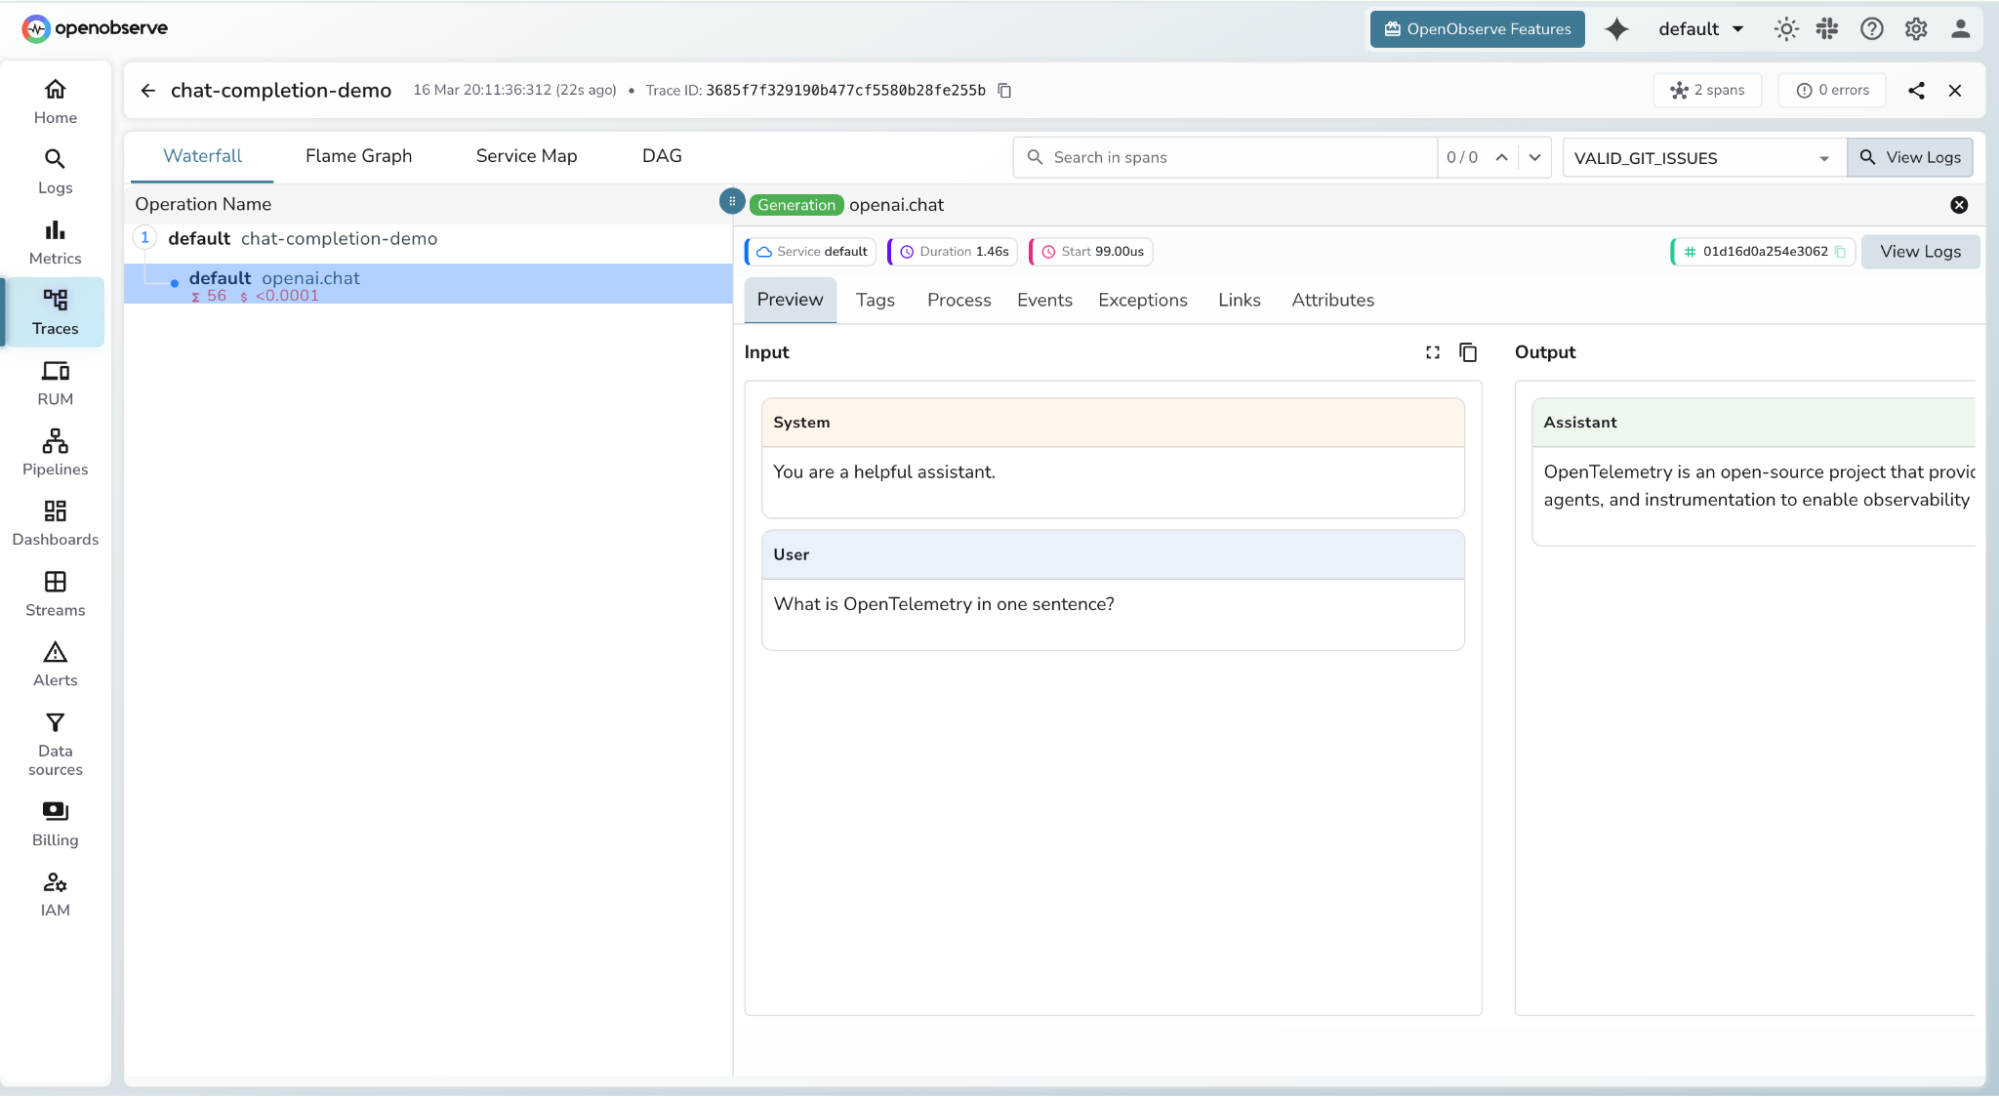
Click any span to inspect token counts, latency, and full request metadata
LLM Evaluations
Enterprise feature.
OpenObserve can automatically evaluate your LLM traces using an LLM-evaluation pipeline. This lets you score model responses against criteria such as correctness, relevance, or safety without leaving OpenObserve.
How it works
- Set up an LLM-evaluation pipeline on a traces stream.
- As LLM traces arrive, the pipeline runs the configured evaluation and writes the results to a separate output stream named
<stream>_evaluations(for example, adefaultstream producesdefault_evaluations). - Per-trace evaluation results appear in an Evaluations tab in the trace detail view. This tab is shown only for LLM traces that have associated evaluation data.
Eval Templates
Evaluation logic is defined by Eval Templates, managed from the enterprise Eval Templates tab. Each template specifies:
- response_type: the expected shape of the evaluation response
- dimensions: the criteria the trace is evaluated against
- content: the prompt/instructions used to perform the evaluation
- versioning: templates are versioned so you can iterate without losing earlier definitions
Troubleshooting
Traces are not appearing in OpenObserve
- Confirm
OPENOBSERVE_ENABLED=truein your.env - Check that
OPENOBSERVE_URLends with a trailing/ - Verify
OPENOBSERVE_AUTH_TOKENis correctly Base64-encoded (Basic <token>) - Ensure the SDK or tracer provider is initialised before any LLM calls
ModuleNotFoundError: No module named 'dotenv'
- Install the correct package:
uv pip install python-dotenv(notdotenv)
ModuleNotFoundError: No module named 'openobserve_telemetry'
- Run:
uv pip install openobserve-telemetry-sdk
Read More
Last updated on
AI
AI and LLM observability with OpenObserve: trace AI frameworks, LLM providers, AI gateways, no-code tools, and AI developer tools via OpenTelemetry.
LLM Evaluations
Continuously score LLM traces and spans in OpenObserve with online evaluations using LLM-as-a-judge or remote scorers, score configs, and managed eval jobs.