
GitHub Copilot → OpenObserve
Monitor GitHub Copilot agent sessions in OpenObserve using OpenTelemetry.
Both the Copilot Chat extension in VS Code and the Copilot CLI ship with a native OpenTelemetry exporter. Point it at OpenObserve's OTLP endpoint and every agent interaction — model calls, tool executions, token usage — streams in directly. No collector, no SDK, no custom code.
What you get
| Signal | Examples | Stored in OpenObserve as |
|---|---|---|
| Traces | span tree per agent turn: invoke_agent → chat, execute_tool, execute_hook, following the OTel GenAI semantic conventions | A traces stream |
| Metrics | token-usage histograms, operation durations, tool call counts, edit acceptance | Metric streams |
| Events | inference details, session starts, tool invocations, agent turns | A log stream |
Prerequisites
- GitHub Copilot with an active subscription — the Copilot CLI (
npm install -g @github/copilot) and/or VS Code with the Copilot Chat extension - An OpenObserve account (cloud or self-hosted)
- Your OpenObserve organisation ID and Base64-encoded auth token
Setup
1. Get your OpenObserve endpoint and auth token
OpenObserve accepts OTLP over HTTP at https://<your-openobserve-host>/api/<your-org>. The exporter appends /v1/traces, /v1/metrics, and /v1/logs itself, so configure the base endpoint with no trailing slash.
Generate the Authorization value (Basic <base64(email:password)>):
echo -n 'your-email:your-password' | base642. Configure GitHub Copilot
Export the OTLP environment variables before starting copilot (add to your shell profile to persist):
export COPILOT_OTEL_ENABLED=true
export COPILOT_OTEL_EXPORTER_TYPE=otlp-http
export OTEL_EXPORTER_OTLP_PROTOCOL=http/protobuf
export OTEL_EXPORTER_OTLP_ENDPOINT="https://<your-openobserve-host>/api/<your-org>"
export OTEL_EXPORTER_OTLP_HEADERS="Authorization=Basic <base64-token>"
export OTEL_SERVICE_NAME=github-copilot
All three of the first variables matter: without COPILOT_OTEL_EXPORTER_TYPE=otlp-http the CLI writes telemetry to a local file exporter instead of sending OTLP, and without OTEL_EXPORTER_OTLP_PROTOCOL=http/protobuf it sends OTLP JSON, which OpenObserve rejects with a 400.
Add to VS Code settings.json:
{
  "github.copilot.chat.otel.enabled": true,
  "github.copilot.chat.otel.exporterType": "otlp-http",
  "github.copilot.chat.otel.otlpEndpoint": "https://<your-openobserve-host>/api/<your-org>"
}
The auth header cannot be set in settings.json — it comes from the environment, so launch VS Code with the variable set:
export OTEL_EXPORTER_OTLP_HEADERS="Authorization=Basic <base64-token>"
code .
Environment variables
| Variable | Description | Default |
|---|---|---|
COPILOT_OTEL_ENABLED | Enable OTel export | false |
COPILOT_OTEL_EXPORTER_TYPE | Exporter backend — set to otlp-http (CLI defaults to a local file exporter) | file |
OTEL_EXPORTER_OTLP_ENDPOINT | OpenObserve base endpoint, no trailing slash | — |
OTEL_EXPORTER_OTLP_HEADERS | Auth headers (Authorization=Basic <base64-token>) | — |
OTEL_EXPORTER_OTLP_PROTOCOL | Set to http/protobuf — required for OpenObserve | http/json |
OTEL_SERVICE_NAME | Service name on all telemetry | copilot-chat |
OTEL_RESOURCE_ATTRIBUTES | Extra resource attributes (key1=val1,key2=val2) | — |
COPILOT_OTEL_CAPTURE_CONTENT | Capture full prompt/response text | false |
COPILOT_OTEL_LOG_LEVEL | Minimum event level (trace…error) | info |
OTLP over HTTP only for the CLI
The Copilot CLI exports over OTLP HTTP only — if grpc is configured it silently falls back to HTTP. Use the HTTP endpoint form shown above.
Prompt capture is off by default
COPILOT_OTEL_CAPTURE_CONTENT=true includes full prompt and response text in the telemetry. Leave it off unless you have a deliberate reason, and make sure OpenObserve retention and access controls match your data-handling policy.
3. Verify
- Run a Copilot session — e.g.
copilotin a terminal, ask it something — or use Copilot Chat in VS Code. - In OpenObserve, open Traces and filter by
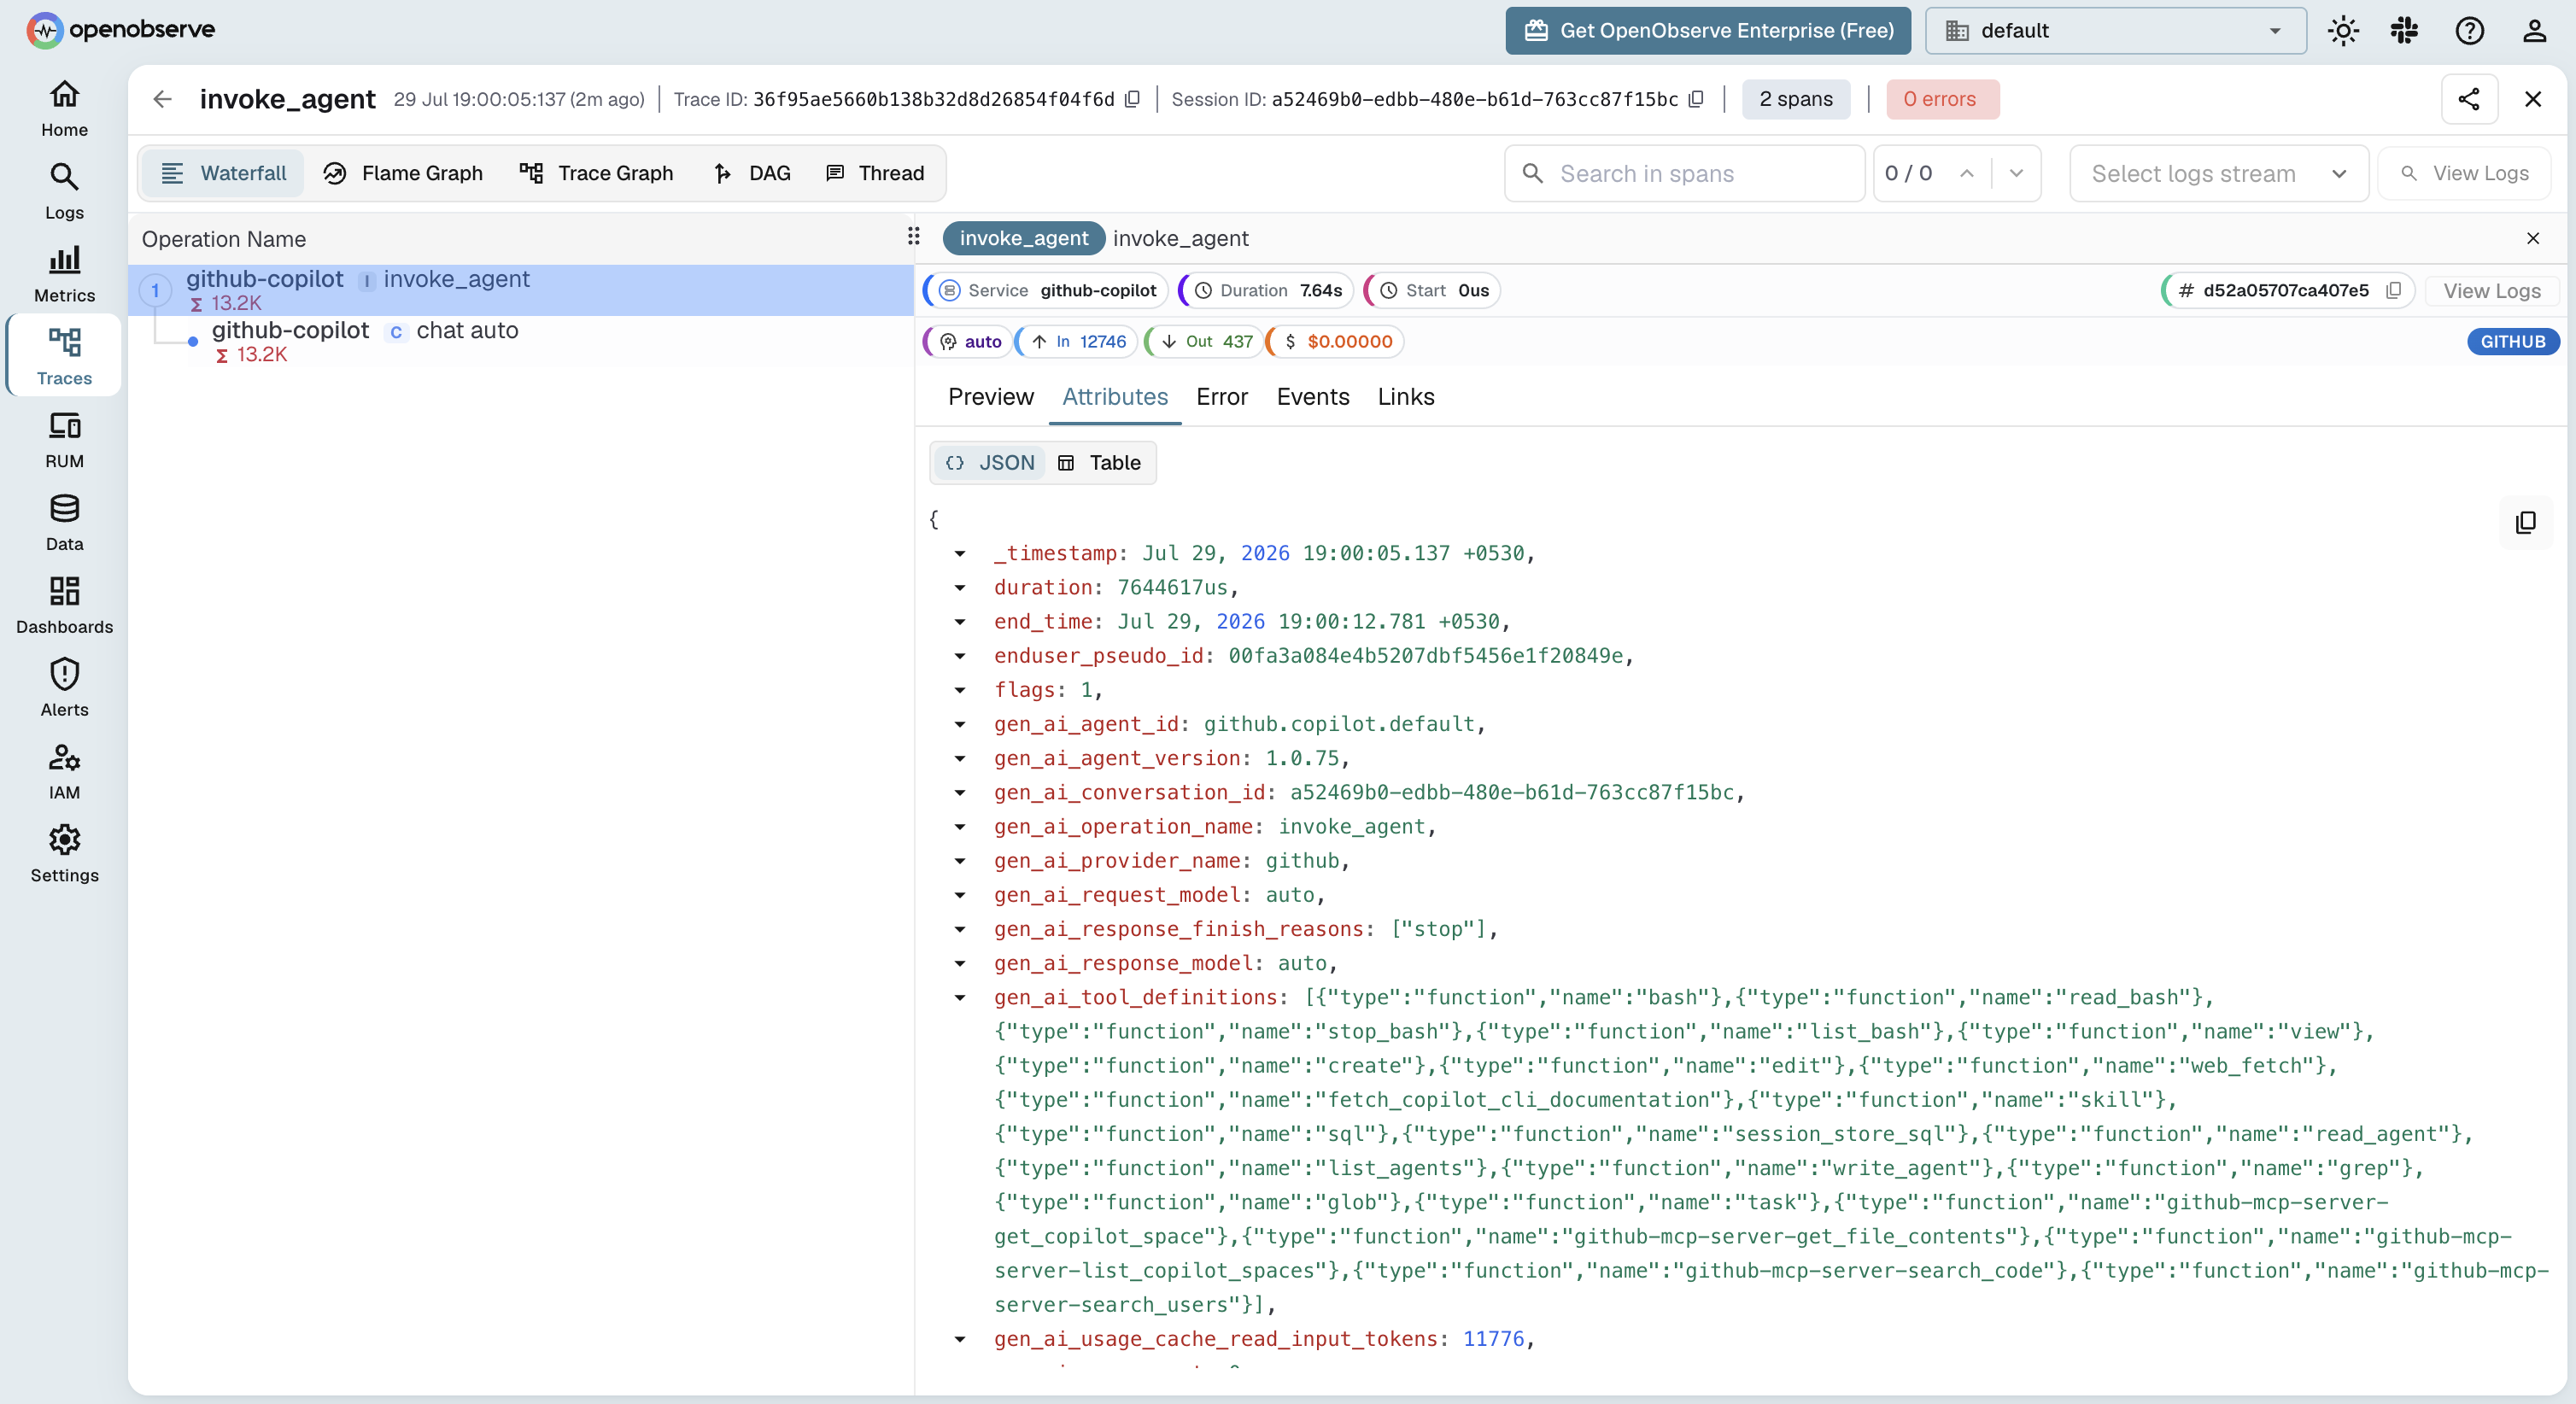
service_name = 'github-copilot'(orcopilot-chatif you didn't set a service name). Each turn appears as aninvoke_agentroot span with achat <model>child carryinggen_ai_provider_name, the model, and token usage. - Open Metrics and look for the Copilot token-usage and duration streams.
What Gets Captured
| Attribute | Description |
|---|---|
gen_ai_operation_name | Operation per span (invoke_agent, chat, execute_tool) |
gen_ai_provider_name | Model provider behind the request |
gen_ai_request_model / gen_ai_response_model | Model used for the turn |
gen_ai_usage_input_tokens / gen_ai_usage_output_tokens | Token usage per model call |
gen_ai_tool_name | Tool invoked in execute_tool spans |
github_copilot_agent_type | Copilot agent surface (CLI, chat) |
github_copilot_git_repository | Repository the session ran in |
span_status | OK on success, ERROR on failure |
duration | Latency of each agent step |
With COPILOT_OTEL_CAPTURE_CONTENT=true, prompt and response text are added to the inference spans.
Org-wide rollout
GitHub Enterprise administrators can mandate the OTel destination centrally via the telemetry block in enterprise-managed settings, so telemetry from every developer's VS Code and Copilot CLI flows to OpenObserve without per-user environment variables.
Troubleshooting
The CLI logs its OTel state to ~/.copilot/logs/ — set COPILOT_OTEL_LOG_LEVEL=debug for detail. On startup you should see OpenTelemetry enabled: exporter=otlp-http.
| Symptom | Cause | Fix |
|---|---|---|
| No data at all | Exporter not enabled | Set COPILOT_OTEL_ENABLED=true and restart the session |
Log shows exporter=file | Default exporter is a local file | Set COPILOT_OTEL_EXPORTER_TYPE=otlp-http |
Log shows HTTP export failed: network error | OTLP JSON payload rejected by OpenObserve (400) | Set OTEL_EXPORTER_OTLP_PROTOCOL=http/protobuf |
404 on export | Trailing slash on the endpoint | Use .../api/<org> with no trailing / |
401/403 errors | Wrong auth header | Re-encode email:password; header is Authorization=Basic <base64> |
| Traces but no content | Content capture disabled (default) | Set COPILOT_OTEL_CAPTURE_CONTENT=true if you need it |
| VS Code sends nothing | Env var not visible to the app | Launch VS Code from a shell that has OTEL_EXPORTER_OTLP_HEADERS exported |
Read More
Last updated on
Claude Code
Send Claude Code usage, cost, and activity to OpenObserve with native OpenTelemetry metrics and events, plus optional full per-turn tracing.
Frameworks
Instrument AI orchestration and agent frameworks with OpenObserve. Trace LangChain, CrewAI, LlamaIndex, AutoGen, and 30+ more via OpenTelemetry.