OpenObserve Docs
IntegrationCloudAws

Integration with AWS CloudWatch Metrics via Metric Stream

Updated View MarkdownOpen in ChatGPTOpen in Claude

This guide explains how to stream AWS CloudWatch metrics (e.g., EC2, RDS, Lambda) into OpenObserve using CloudWatch Metric Streams and Kinesis Data Streams.

Overview

CloudWatch Metric Streams allow efficient, near real-time delivery of metrics to a Kinesis Data Stream. OpenObserve pulls these metrics via an HTTP endpoint, enabling unified, real-time observability across your AWS infrastructure and applications.

Steps to Integrate

Prerequisites
  • OpenObserve account (Cloud orSelf-Hosted)
  • AWS IAM permissions for:
    • CloudWatch: ListMetrics, GetMetricData, GetMetricStatistics
    • Kinesis Data Streams: CreateStream, PutRecord
  • OpenObserve ingestion URL and Access Key
Step 1: Get OpenObserve Ingestion URL and Access Key
  1. In OpenObserve: go to Data > Data sources > Recommended > Amazon Web Services(AWS). The Manual Configuration block shows the HTTP endpoint and Access Key
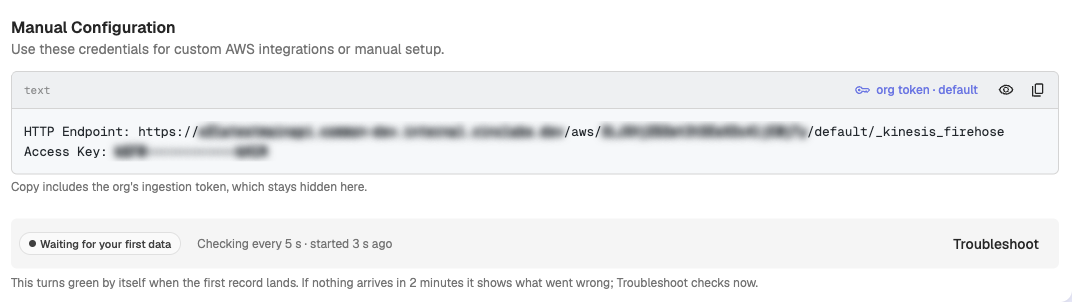
  2. Copy the ingestion HTTP URL and Access Key

    Manual Configuration block with the HTTP endpoint and access key

Example format:

https://<your-openobserve-domain>/aws/<org_id>/cloudwatch_logs/_kinesis_firehose
Step 2: Create a Kinesis Firehose Delivery Stream
  1. In AWS Kinesis Firehose, Create delivery stream.
  2. Set Source: Direct PUT and Destination: HTTP Endpoint.
  3. Provide OpenObserve's HTTP Endpoint URL and Access Key, and set an S3 backup bucket.
  4. Give the stream a meaningful name and Create it.
Kinesis Firehose Delivery Stream
Step 3: Create CloudWatch Metric Stream
  1. Navigate to CloudWatch → Metric Streams → Create
  2. Choose Custom setup Create Metric Stream
  3. For Destination, select Kinesis Data Stream → Select your newly created stream
  4. Choose AWS namespaces to monitor (e.g., AWS/EC2, AWS/RDS, AWS/Lambda)
  5. Optional: Filter specific metrics
  6. Name your stream and click Create Stream
Create Metric Stream
Step 4: Verify Metrics in OpenObserve
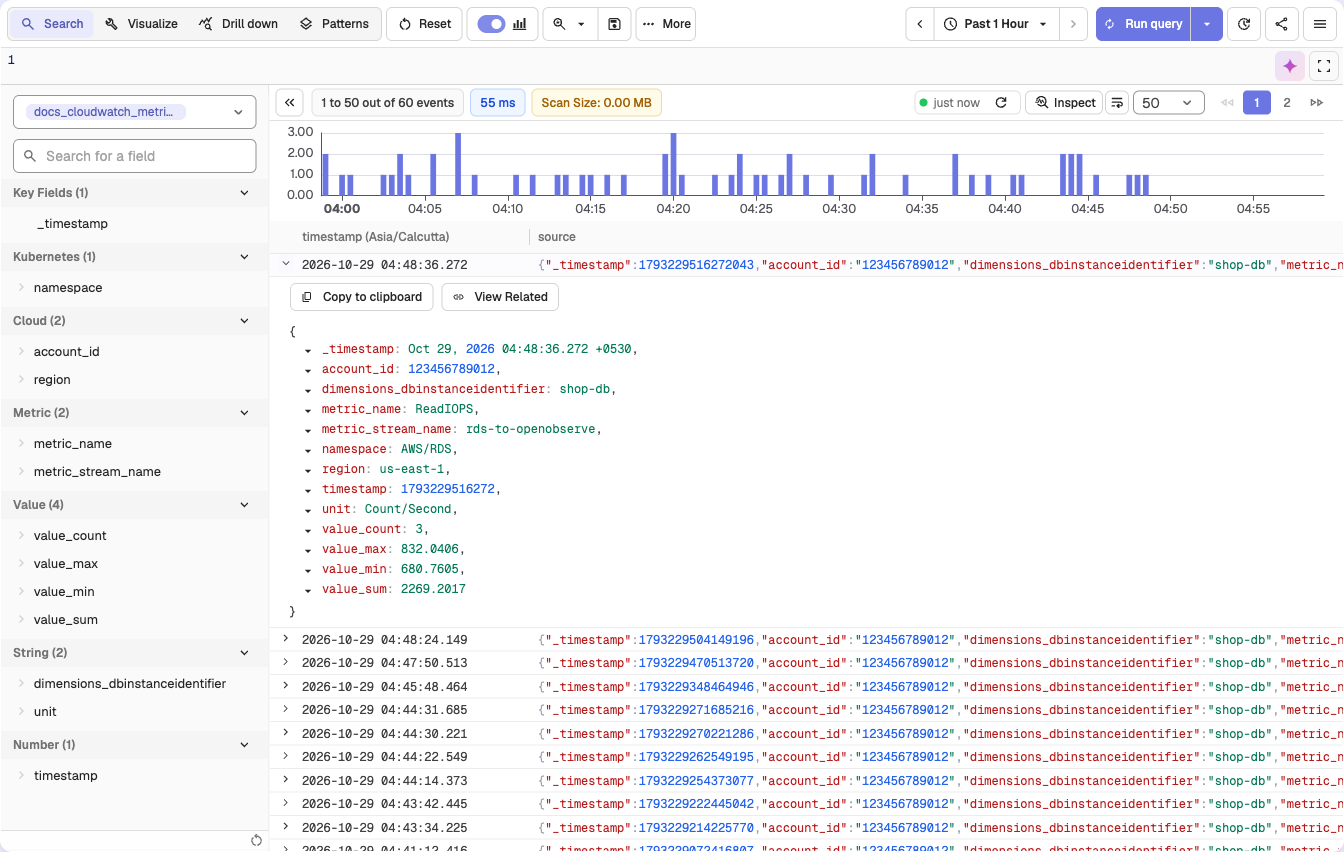
  1. Go to Logs → select your stream → Set time range → Click Run Query

CloudWatch metric stream records in the Logs page

Troubleshooting

No metrics appearing?

  • Confirm Kinesis Data Stream exists and is active
  • Verify Metric Stream configuration in CloudWatch
  • Check IAM permissions for CloudWatch and Kinesis
  • Validate ingestion URL and Access Key in OpenObserve
Was this page helpful?

On this page