Comparison Against in Dashboards
The Comparison Against feature in OpenObserve Dashboards allows you to visually compare your current data with data from a selected point in time in the past. It is useful for trend analysis and identifying patterns over time.
Where to Find This Feature
The Comparison Against feature is available for the following chart types in Dashboards:
- Area
- Area Stacked
- Bar
- Horizontal Bar
- Line
- Scatter
- Stacked
- Horizontal Stacked
It is also available for PromQL panels of these types that run a range query. It is not shown for PromQL instant queries, which have no time range to shift.
How it Works
| Step | Without Comparison Against | With Comparison Against |
|---|---|---|
| SQL Query | You write SQL query for the current time frame (default). | Same SQL query is used for both current and past time frames. |
| Period (Time Range) | You select a time range (e.g., last 30 mins). | Same time range is applied to both current and past queries. |
| Query Execution | Query runs at the current time for the selected time range. | If you select one time frame in the past, the same query runs twice: • Query 1: Runs at the current time for the selected time range. • Query 2: Runs at the past time for the selected time range. |
| Query Results | Single result: current data only. | Two result sets: • Query 1: Current data • Query 2: Past data |
| Visualization | Chart shows current data only. | Chart shows both current and past data side by side for comparison. |
How to Use the Compare Against Feature
For example, you want to compare the error trends for the last 15 mins today with the error trends for the same 15 minutes, 1 hour earlier.
Let's say,
- You want to view the error trend for the past 15 mins today (for example, from 3 PM - 4 PM, today).
- Now, you want to compare it with the error trend for the same 15 minutes one hour earlier (from 2 PM - 3 PM).
The following steps explain how to use the Comparison Against feature for this scenario:
- Go to Dashboards > New dashboard.

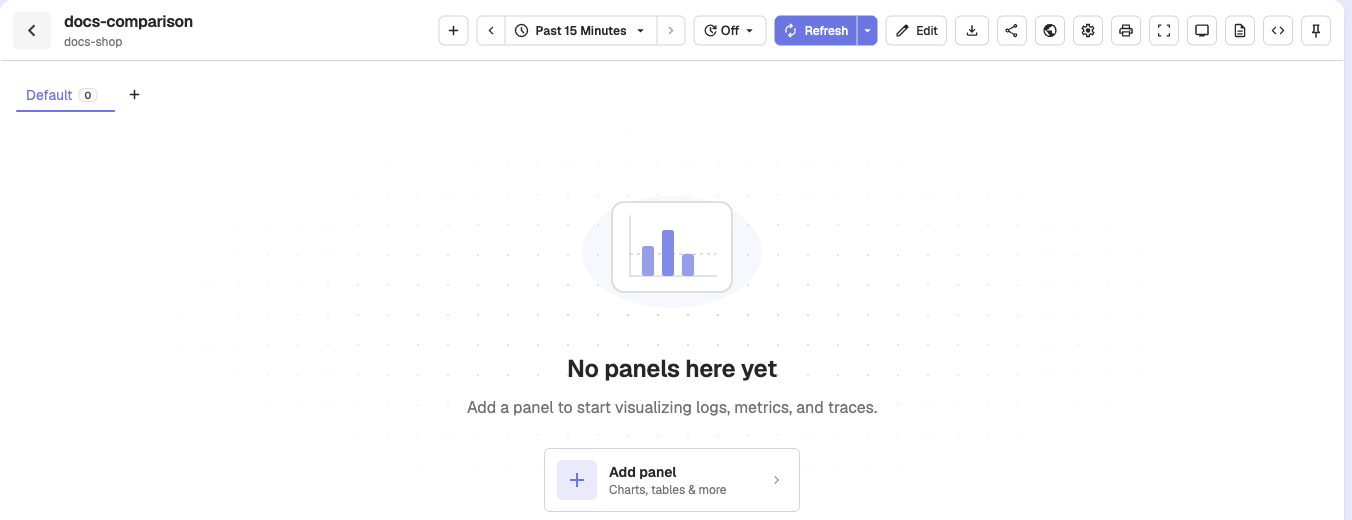
- Click Add Panel.
- Select a chart where the Comparison Against feature is available.
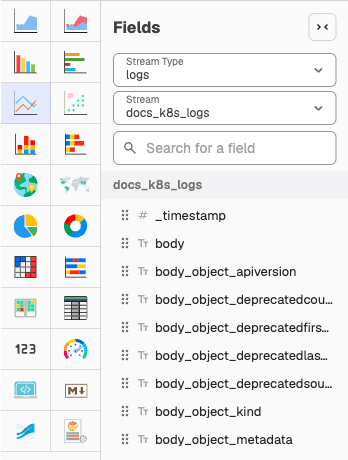
- Under Fields, add Stream Type and Stream. These define the data source for your SQL query. Select fields that you want to set as x-axis (for example, timestamp) and y-axis (for example, error) of the chart.

Note: You may use the Query editor to further customize your query.
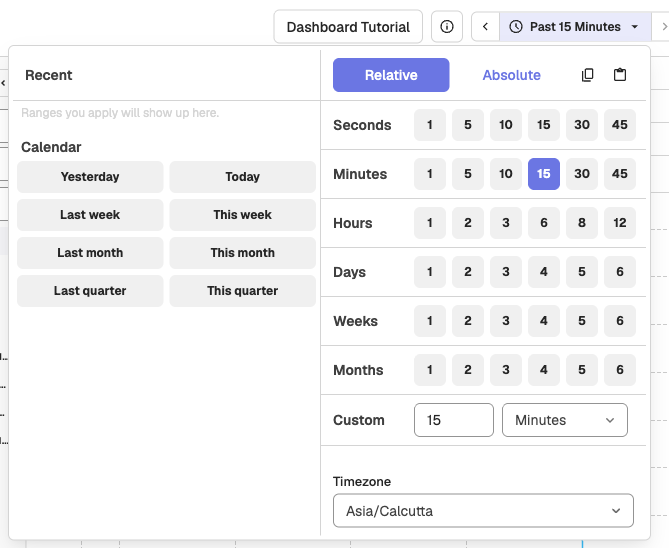
- Choose a time range. For instance, Past 15 Minutes. This becomes the period, the time range the system will use for both your current data and comparison data.
- Open the Config sidebar and expand the Comparison Against section.
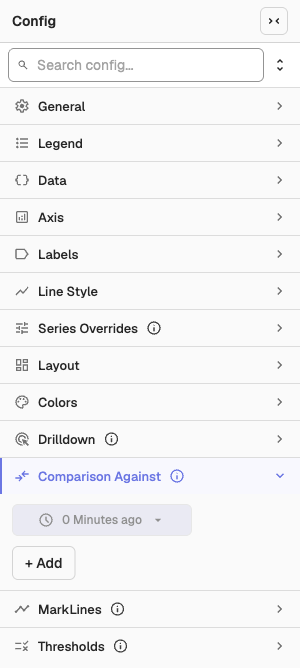
- By default, 0 Minutes ago is selected. This represents your current time.
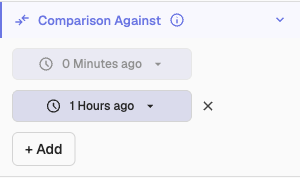
- Click + Add to choose one or more past times to compare against the current time. For example, 1 Hour ago. Use the dropdown menu to select the desired time. The system runs your SQL query for the same time range (period) at this past point.
- (Optional) Select a Color Palette to differentiate charts.
- Click Apply to run the query and update the chart.
Note: Time shift changes do not trigger the live preview. Click Apply after adding or changing any comparison values.
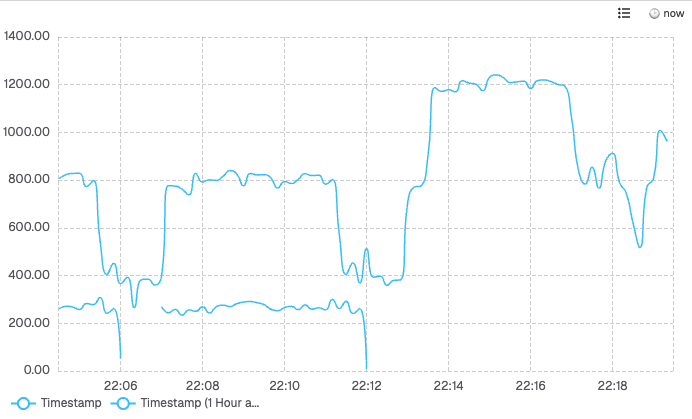
Result:
The results of both queries are shown side by side on your chart, making it easy to visually compare your current data with historical data.
Filters
Filters narrow dashboard panel data using static list values, dynamic variables, and operators, combining conditions with AND or OR logic in nested groups.
Custom Charts Overview
Create advanced visualizations in OpenObserve using custom charts powered by SQL queries and JavaScript for flexible, tailored data display.