Insights: Interactive Dimension Analysis
Overview
Insights is an interactive dimension analysis feature that automates root cause identification by comparing anomaly periods against baseline data across multiple dimensions simultaneously.
What It Does
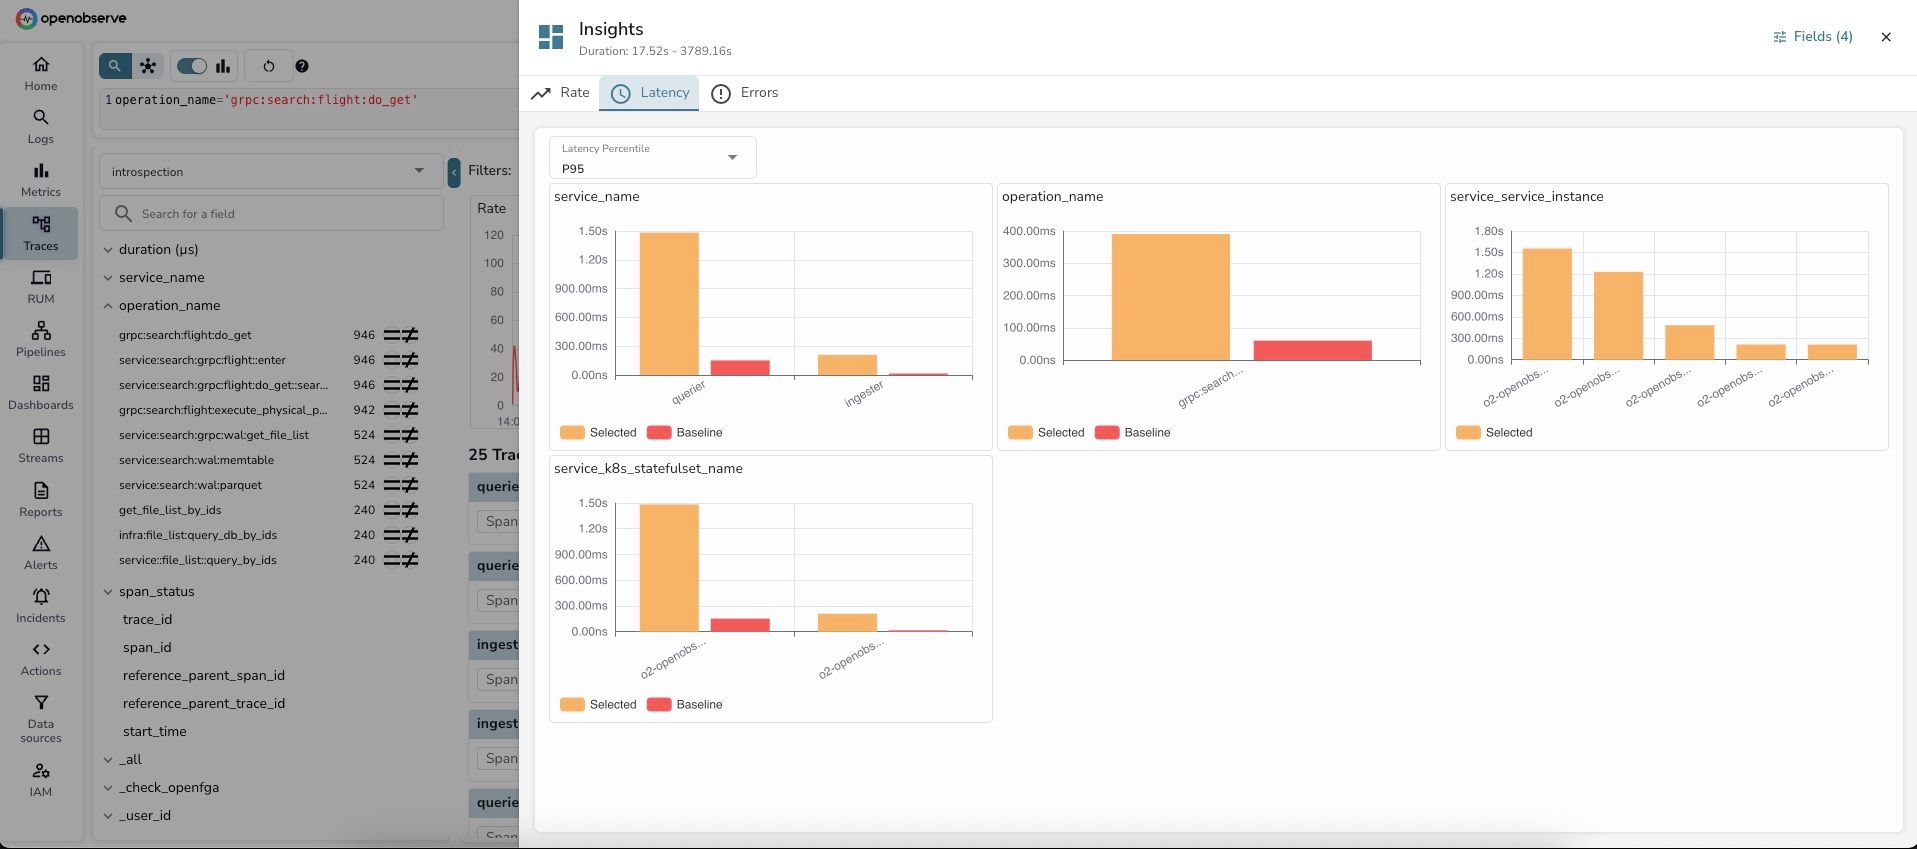
- Auto-selects relevant dimensions based on your data schema and telemetry standards
- Compares baseline vs selected periods with normalized metrics
- Ranks dimensions by impact to show which factors most explain changes
- Visualizes differences with interactive bar charts
When to Use
Use Insights for:
- Visual exploration of dimension patterns
- Hypothesis testing during incidents
- Quick spot checks without waiting for AI analysis
- Learning system behavior patterns
Supported Telemetry
- Logs: Volume distribution analysis across dimensions
- Traces: Rate, latency (P50/P75/P95/P99), and error analysis
Key Terms
- Stream: Your data collection/index (e.g.,
default,prod-logs) - Baseline: Full search time range (e.g., "last 24 hours")
- Selected: Specific window you're investigating (e.g., "high-latency period")
- Dimension: Field used for grouping (e.g.,
service_name,pod_name) - Brush selection: Click-and-drag to select chart regions
- RED metrics: Rate, Errors, Duration - key observability metrics for traces
How to Use
For Log Analysis
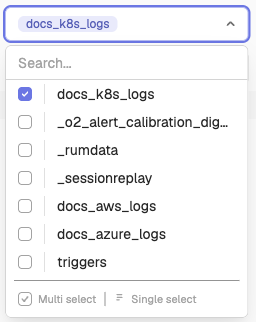
- Run a log query (select stream, time range, optional filter)
- Select the Drill down view in the toolbar. It is not available in SQL mode.

- Review dimension analysis dashboard
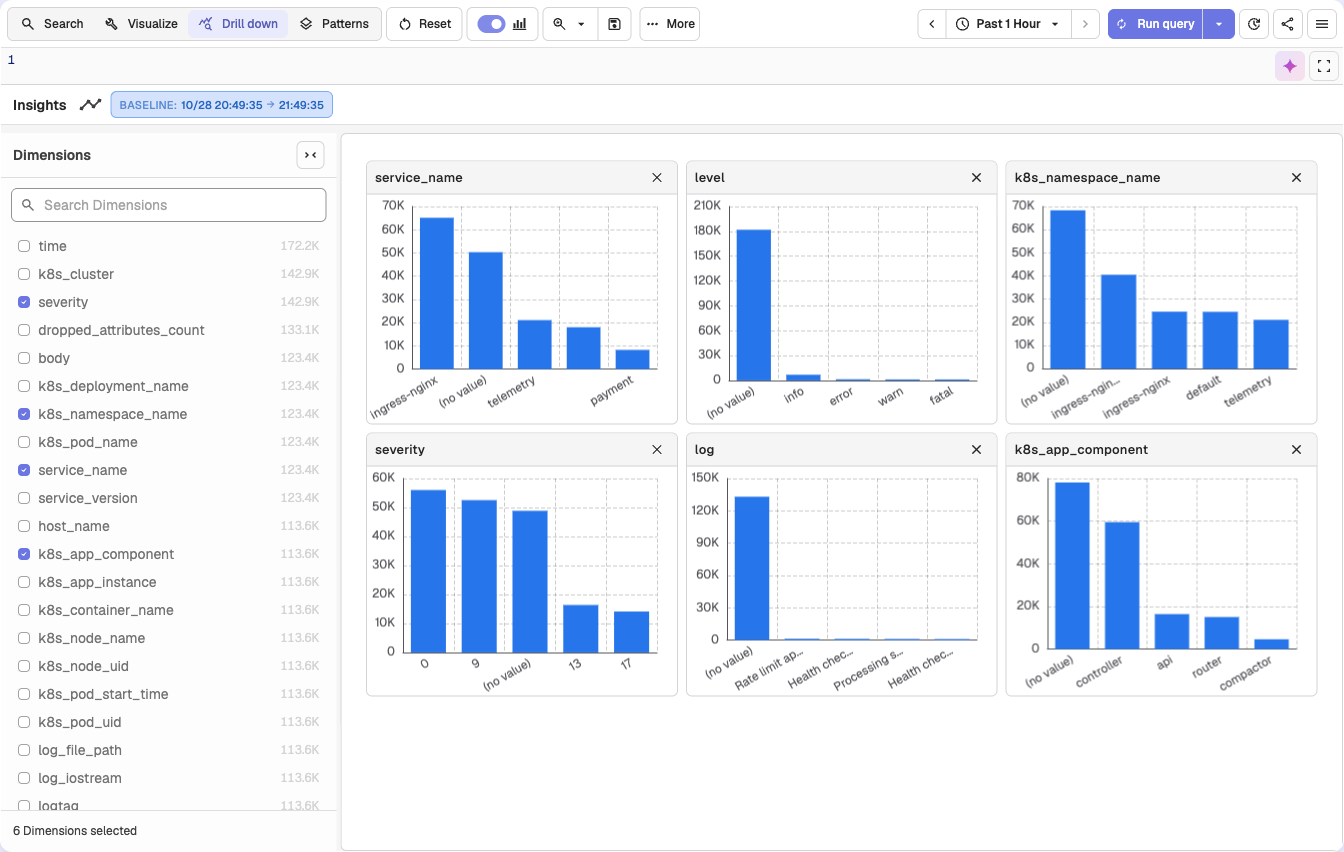
- (Optional) Customize dimensions in the Dimensions sidebar
Example: Query k8s_cluster = 'production' shows which pods, services, and namespaces generate most logs.
For Trace Analysis
- Run a trace query (select stream, time range, optional filter)
- Observe RED metrics (Rate, Errors, Duration panels)
- (Optional) Make a brush selection:
- Drag vertically = Select latency range
- Drag horizontally = Select time range
- Drag diagonally = Select both
- Click the Drill down button
- Review analysis tabs: Rate, Latency, Errors
- (Optional) Adjust percentile in Latency tab
- (Optional) Customize dimensions in the Dimensions sidebar
Example: Query operation_name='api/checkout' shows which services have highest latency during incidents.
Advanced Features
Percentile Adjustment (Traces)
- P50: Median user experience
- P75: Upper-middle tier
- P95: Worst 5% (common SLA target)
- P99: Tail latency (worst 1%)
Click refresh button after changing percentile.
Error-Only Mode (Traces)
Enable "Error Only" toggle to restrict analysis to error traces only.
Dimension Customization
Use the Dimensions sidebar to:
- Add/remove dimensions
- Search for specific fields with Search Dimensions
- Optimal cardinality: 2-50 unique values
Filter Management
- Each brush selection creates a removable filter chip
- Click X on chips to clear individual filters
Troubleshooting
No analysis shown
- Ensure search results are loaded (> 0 results)
- Click Run query first
- For logs, turn off SQL mode: the Drill down view does not work with SQL queries
Note: If
logs_insightsRBAC is enabled (Enterprise/Cloud), your role needs Get permission on the relevant logs stream'slogs_insightsresource to use Insights.
No dimensions shown
- Select dimensions manually in the Dimensions sidebar
Brush selection not working
- Click and hold, drag across chart, then release
Wrong latency values
- Verify percentile dropdown setting (P50/P75/P95/P99)
Additional Resources
- Detailed guide with examples: From Symptoms to Quick Insights blog post
- Logs guide: Logs documentation
- Traces guide: Traces documentation
- Alerts setup: Alerts documentation
Getting Help
- Community: Slack
- GitHub Issues: Report bugs