

Logs
This page explains how to run your first log search in OpenObserve, set a time range, execute a query, apply VRL transformations, adjust display settings, and save or export the results.
Before you begin
Make sure you have the required access to use the Logs page. Ensure that at least one stream with data is available in your organization. Learn more about streams.
Get Started with Logs
To start using the Logs page:
- Select the organization from the dropdown at the top.
- In the Logs page, choose a log stream using the stream selector.
- Set the time range using the time range selector.
- Click Run query to view the logs for the selected time range.
This is the minimum setup required to explore log data for the selected time range.
Auto Run
When Auto Run is enabled (an administrator sets ZO_AUTO_QUERY_ENABLED), the query re-runs automatically when you change a filter, time range, query, or function, so you do not need to click Run query manually.
Use the Query Editor
The Query Editor allows you to define filters, expressions, and transformations on your log data.
Use the SQL mode toggle to switch between two editor modes, non-SQL mode and SQL mode.
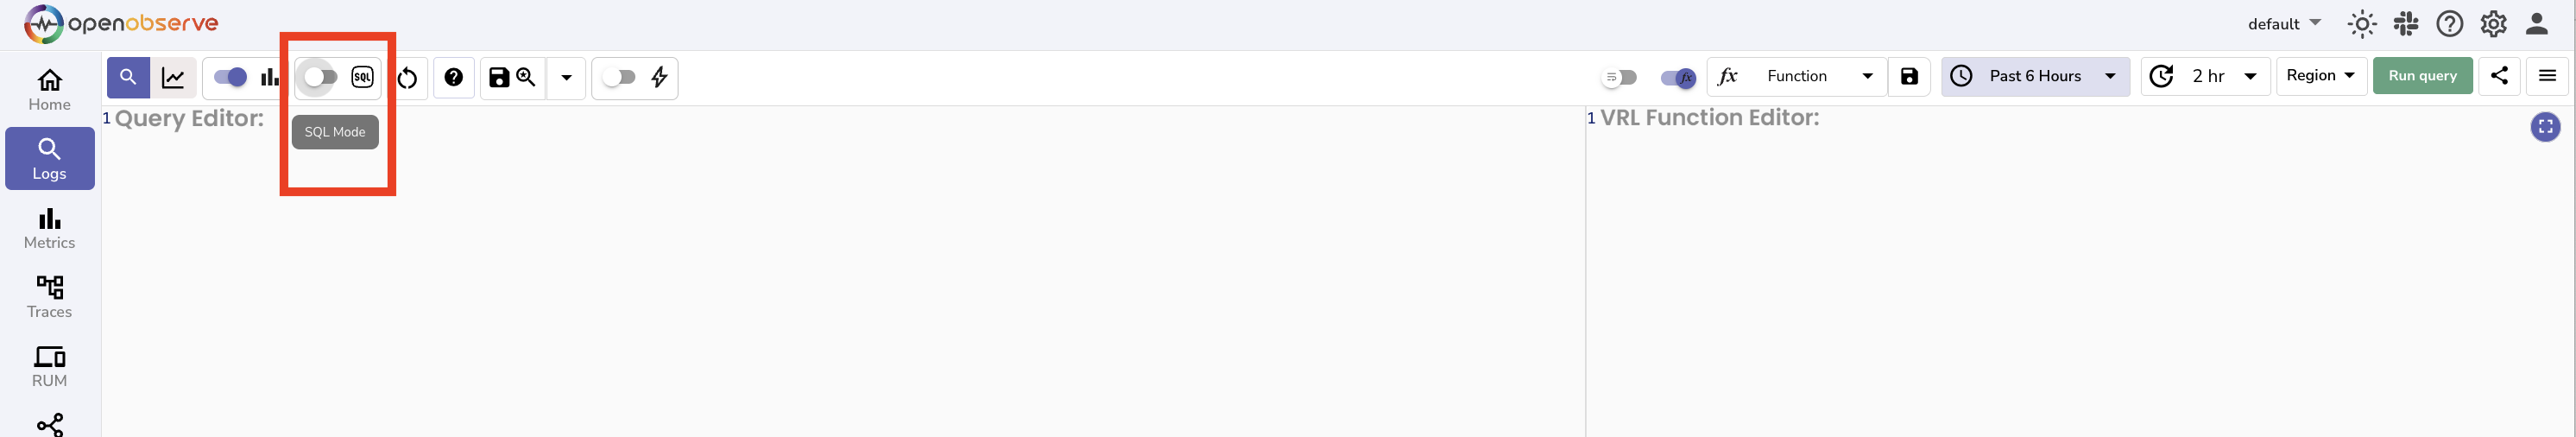
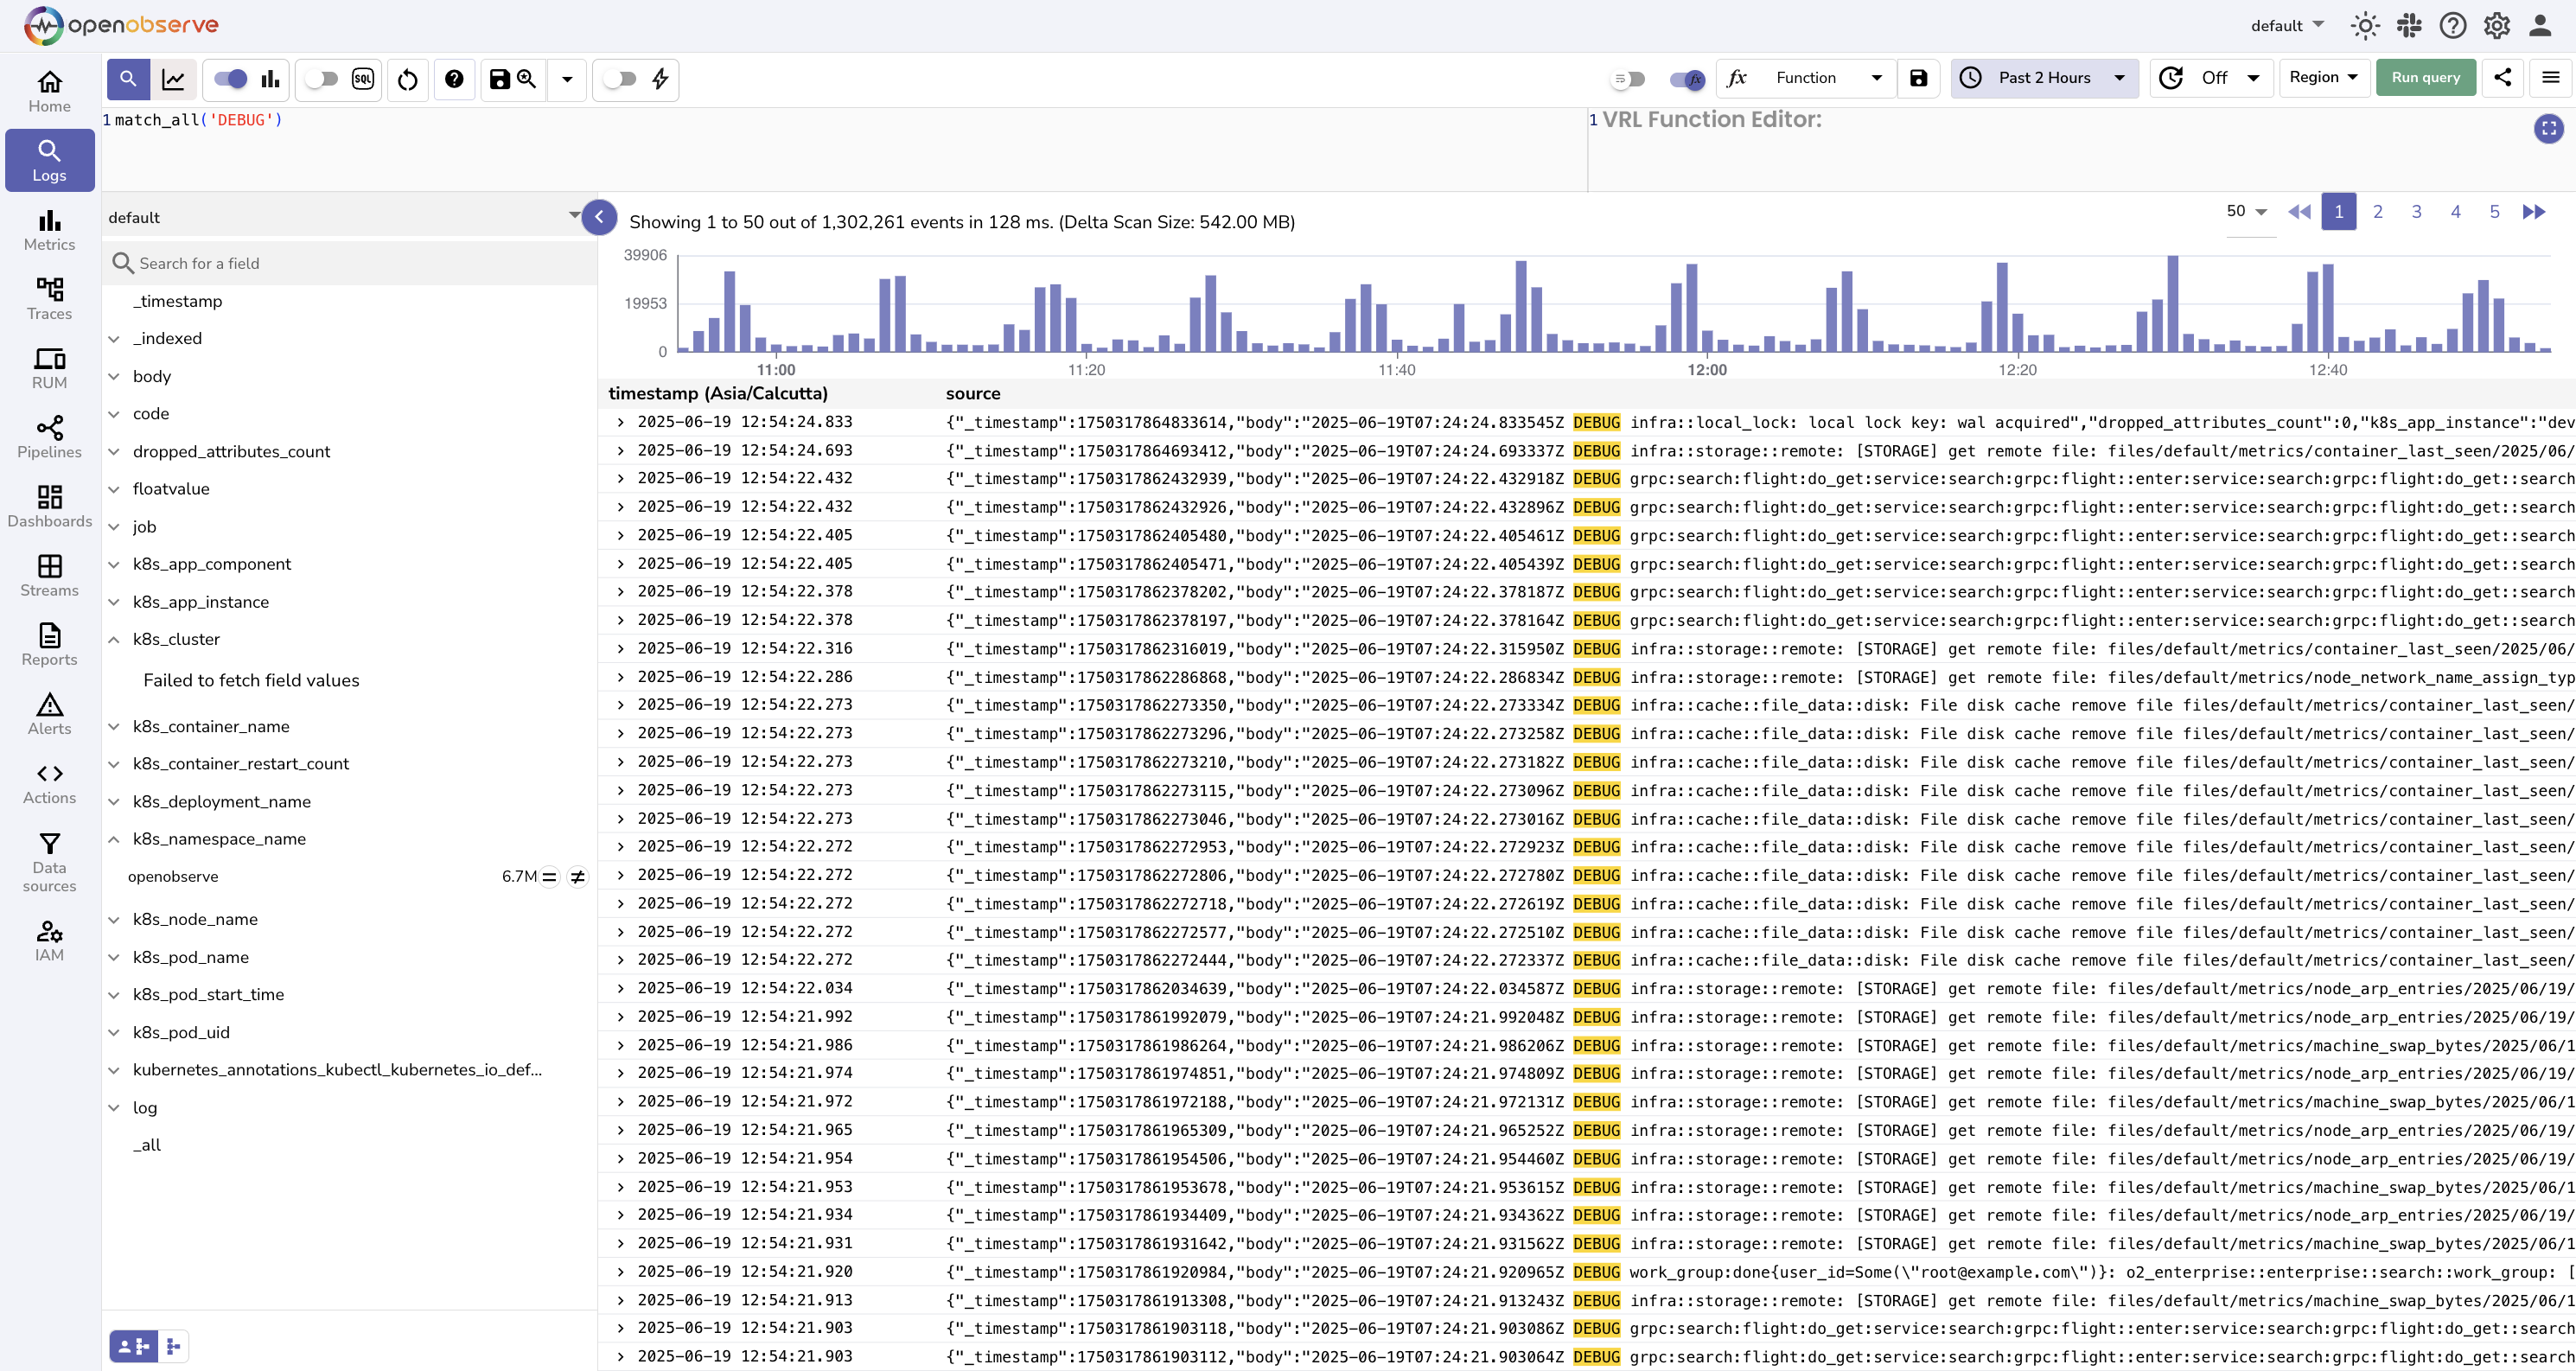
Non-SQL mode: When the toggle is off. Use this mode to apply filters, functions such as match_all, or other field-based conditions without writing full SQL. Learn more about SQL functions.
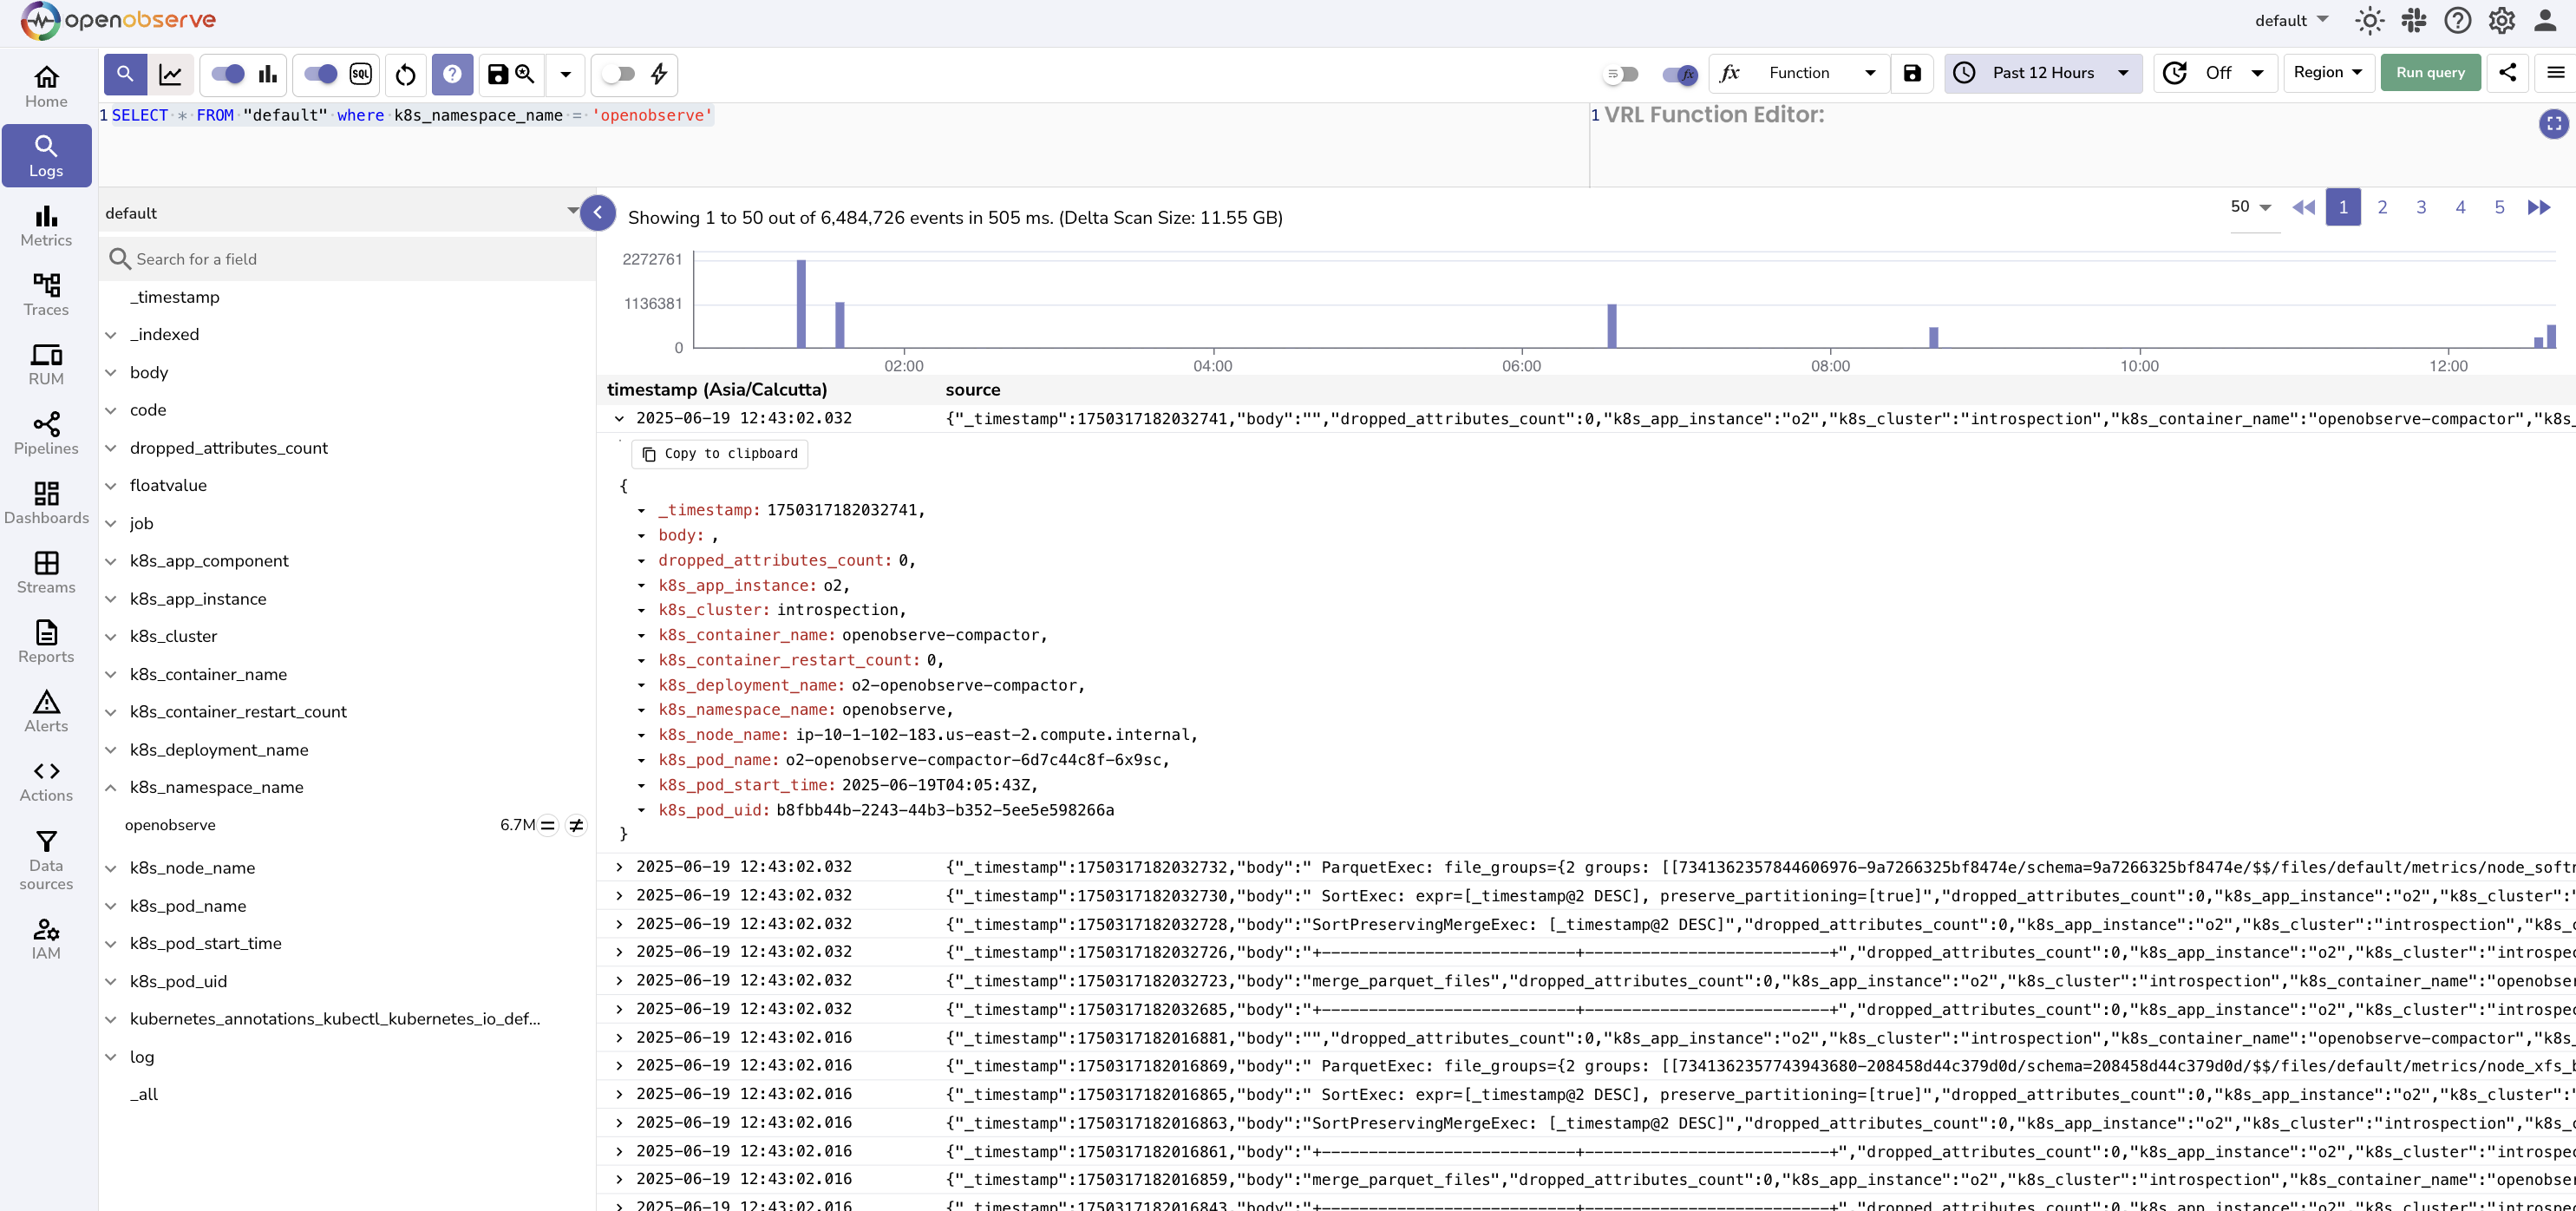
SQL mode: When the toggle is on. It enables full SQL syntax. You can write complete SQL queries to control the selection, filtering, and ordering of log records.
For example,
Toggling between these modes updates the behavior and syntax of the query editor.
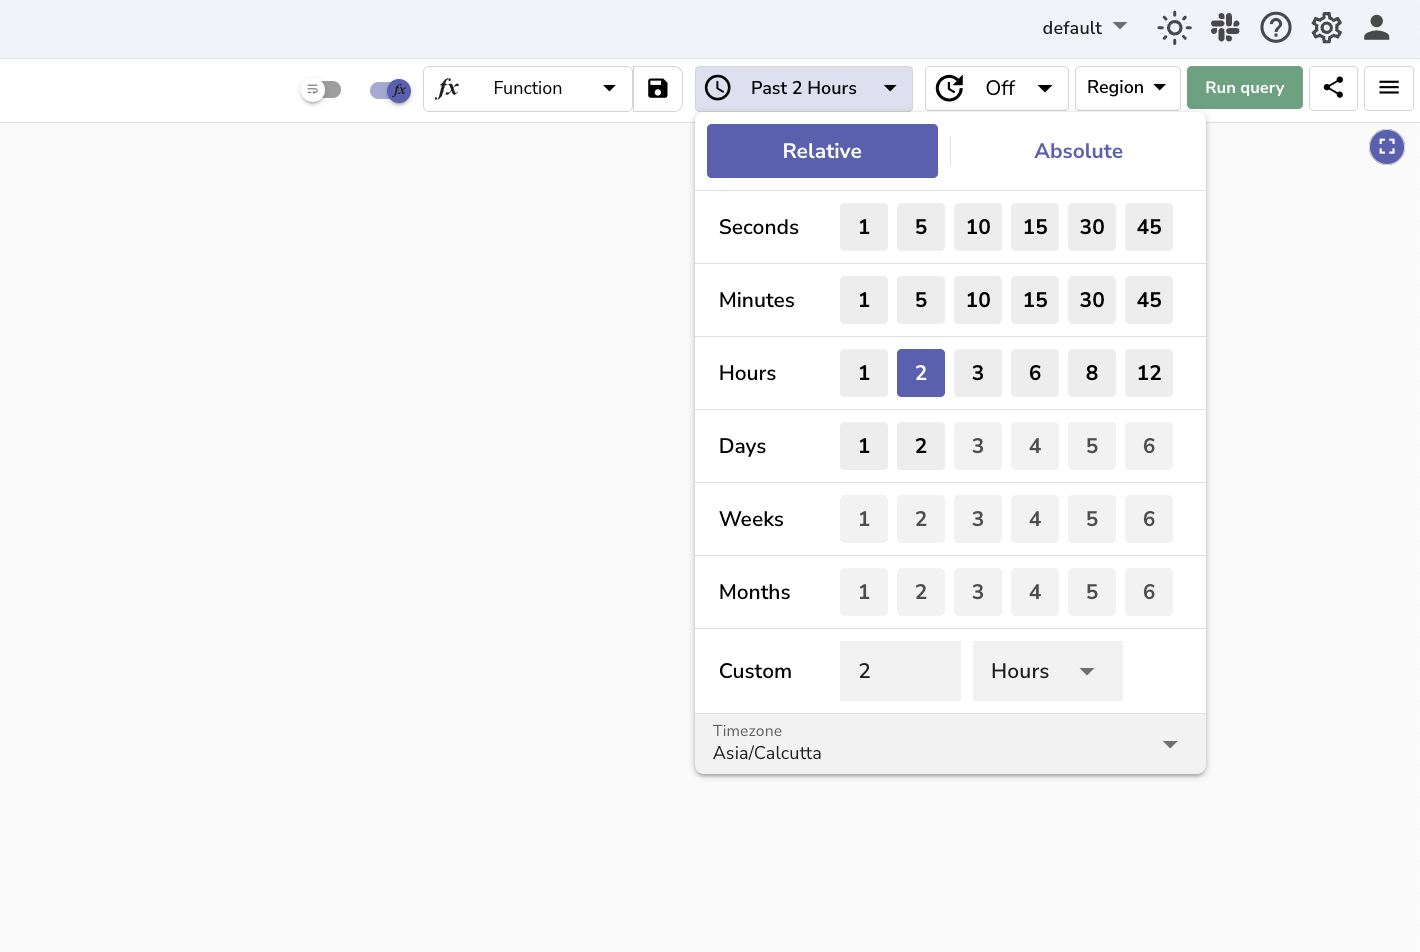
Set Time Range
Click the time range selector to define a time window for your query:
- Choose a relative range such as Past 1 hour or Past 7 days. Or select an absolute range using the calendar.
- Click Apply.
Relative:
Absolute:
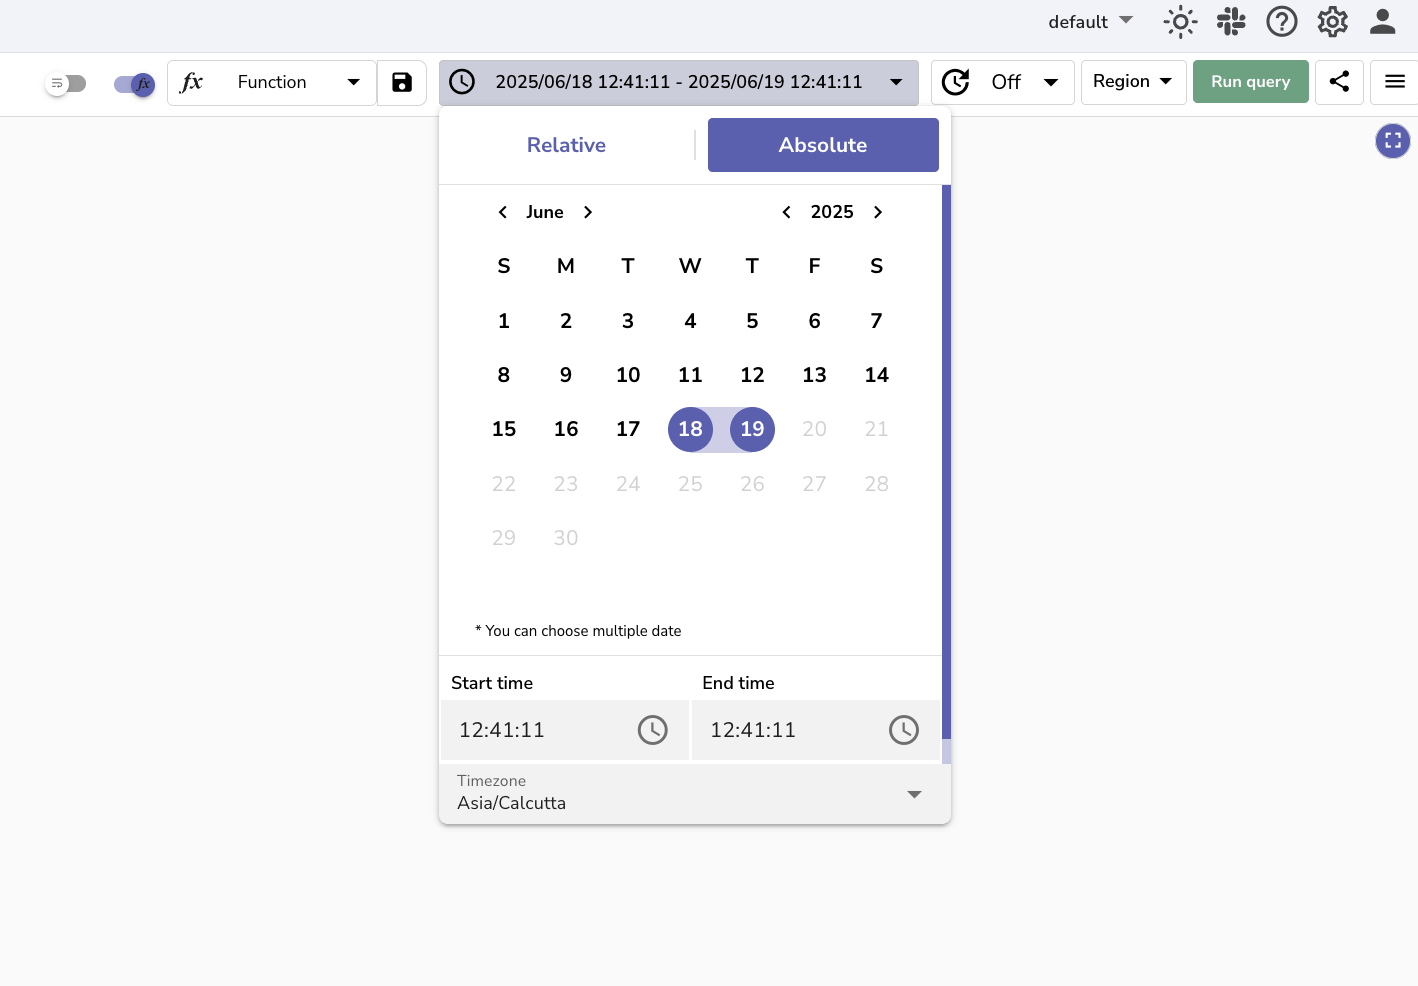
This setting limits the query to logs that fall within the selected time range, which helps reduce the amount of data scanned and improves query speed.
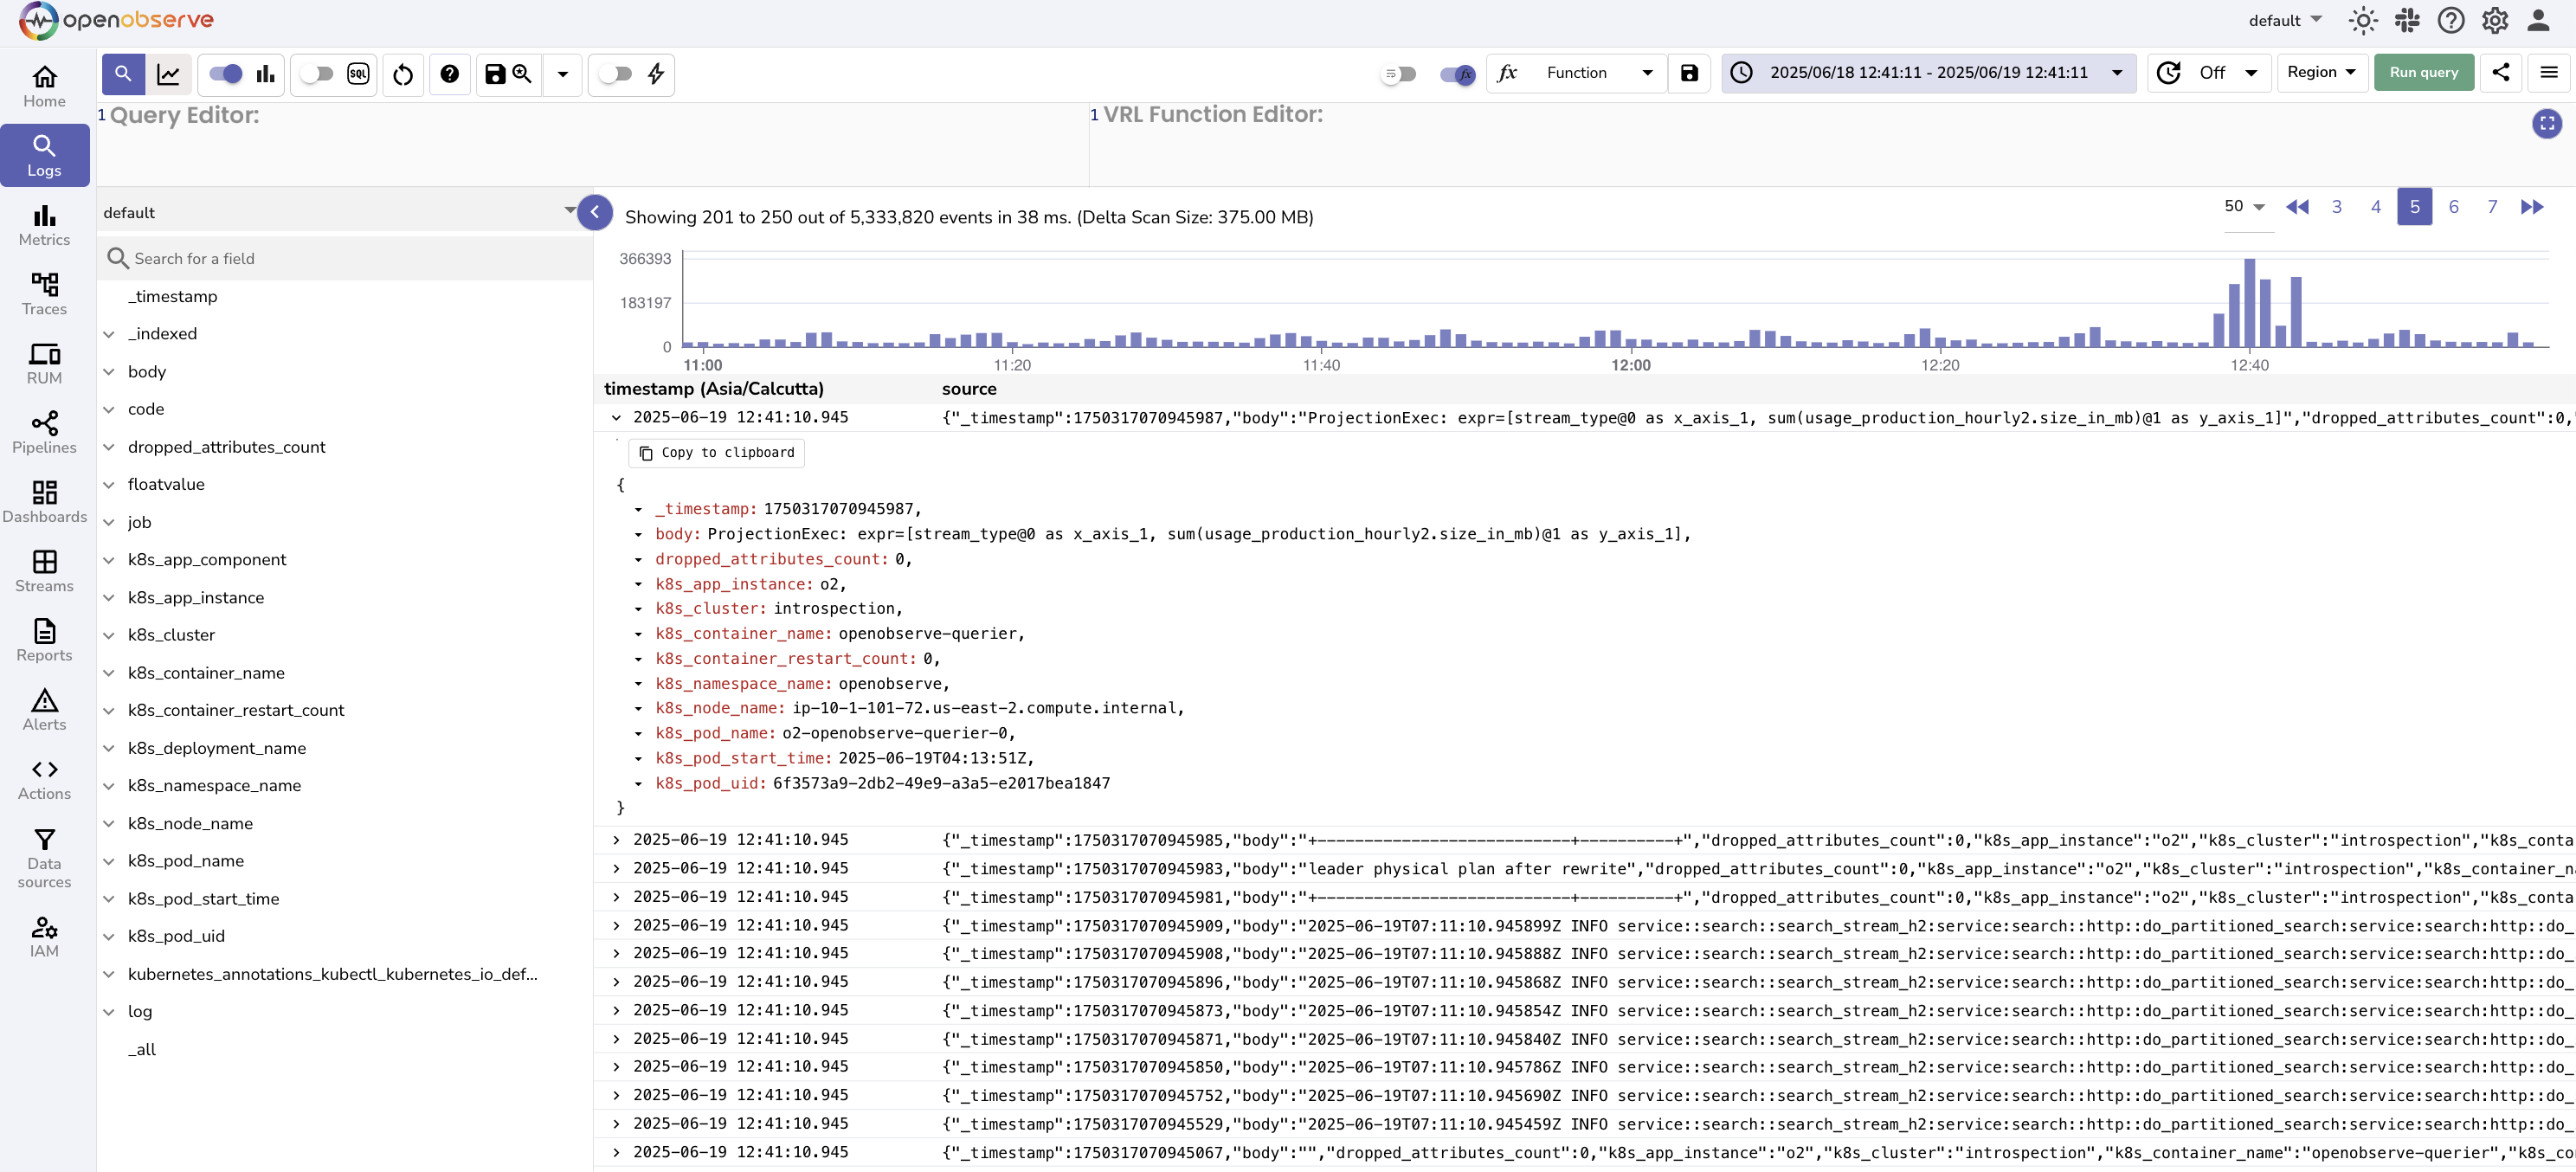
View and Explore Logs
After the query runs successfully, the results table shows all log entries that match the selected stream, time range, and query conditions. Click a row to expand the full log record.
Filter by field values
In the left field list, fields are organized into collapsible groups. Key Fields (the high-value fields configured for the stream) appear first, followed by data-type groups (String, Number, Boolean) and semantic or prefix-based groups (for example, Kubernetes and HTTP), with Other listed last. When viewing a single stream, the groups are expanded by default.
Expand a field in the left field list to see its values. Use the value search box to find a specific value, then click a value to add it as a filter condition:
- Adding it as an include condition applies
field = 'value'. - Adding it as an exclude condition applies
field != 'value'.
Your selections persist when you toggle between include and exclude. The _timestamp field also supports include and exclude conditions. Previously used filters are restored from your last session.
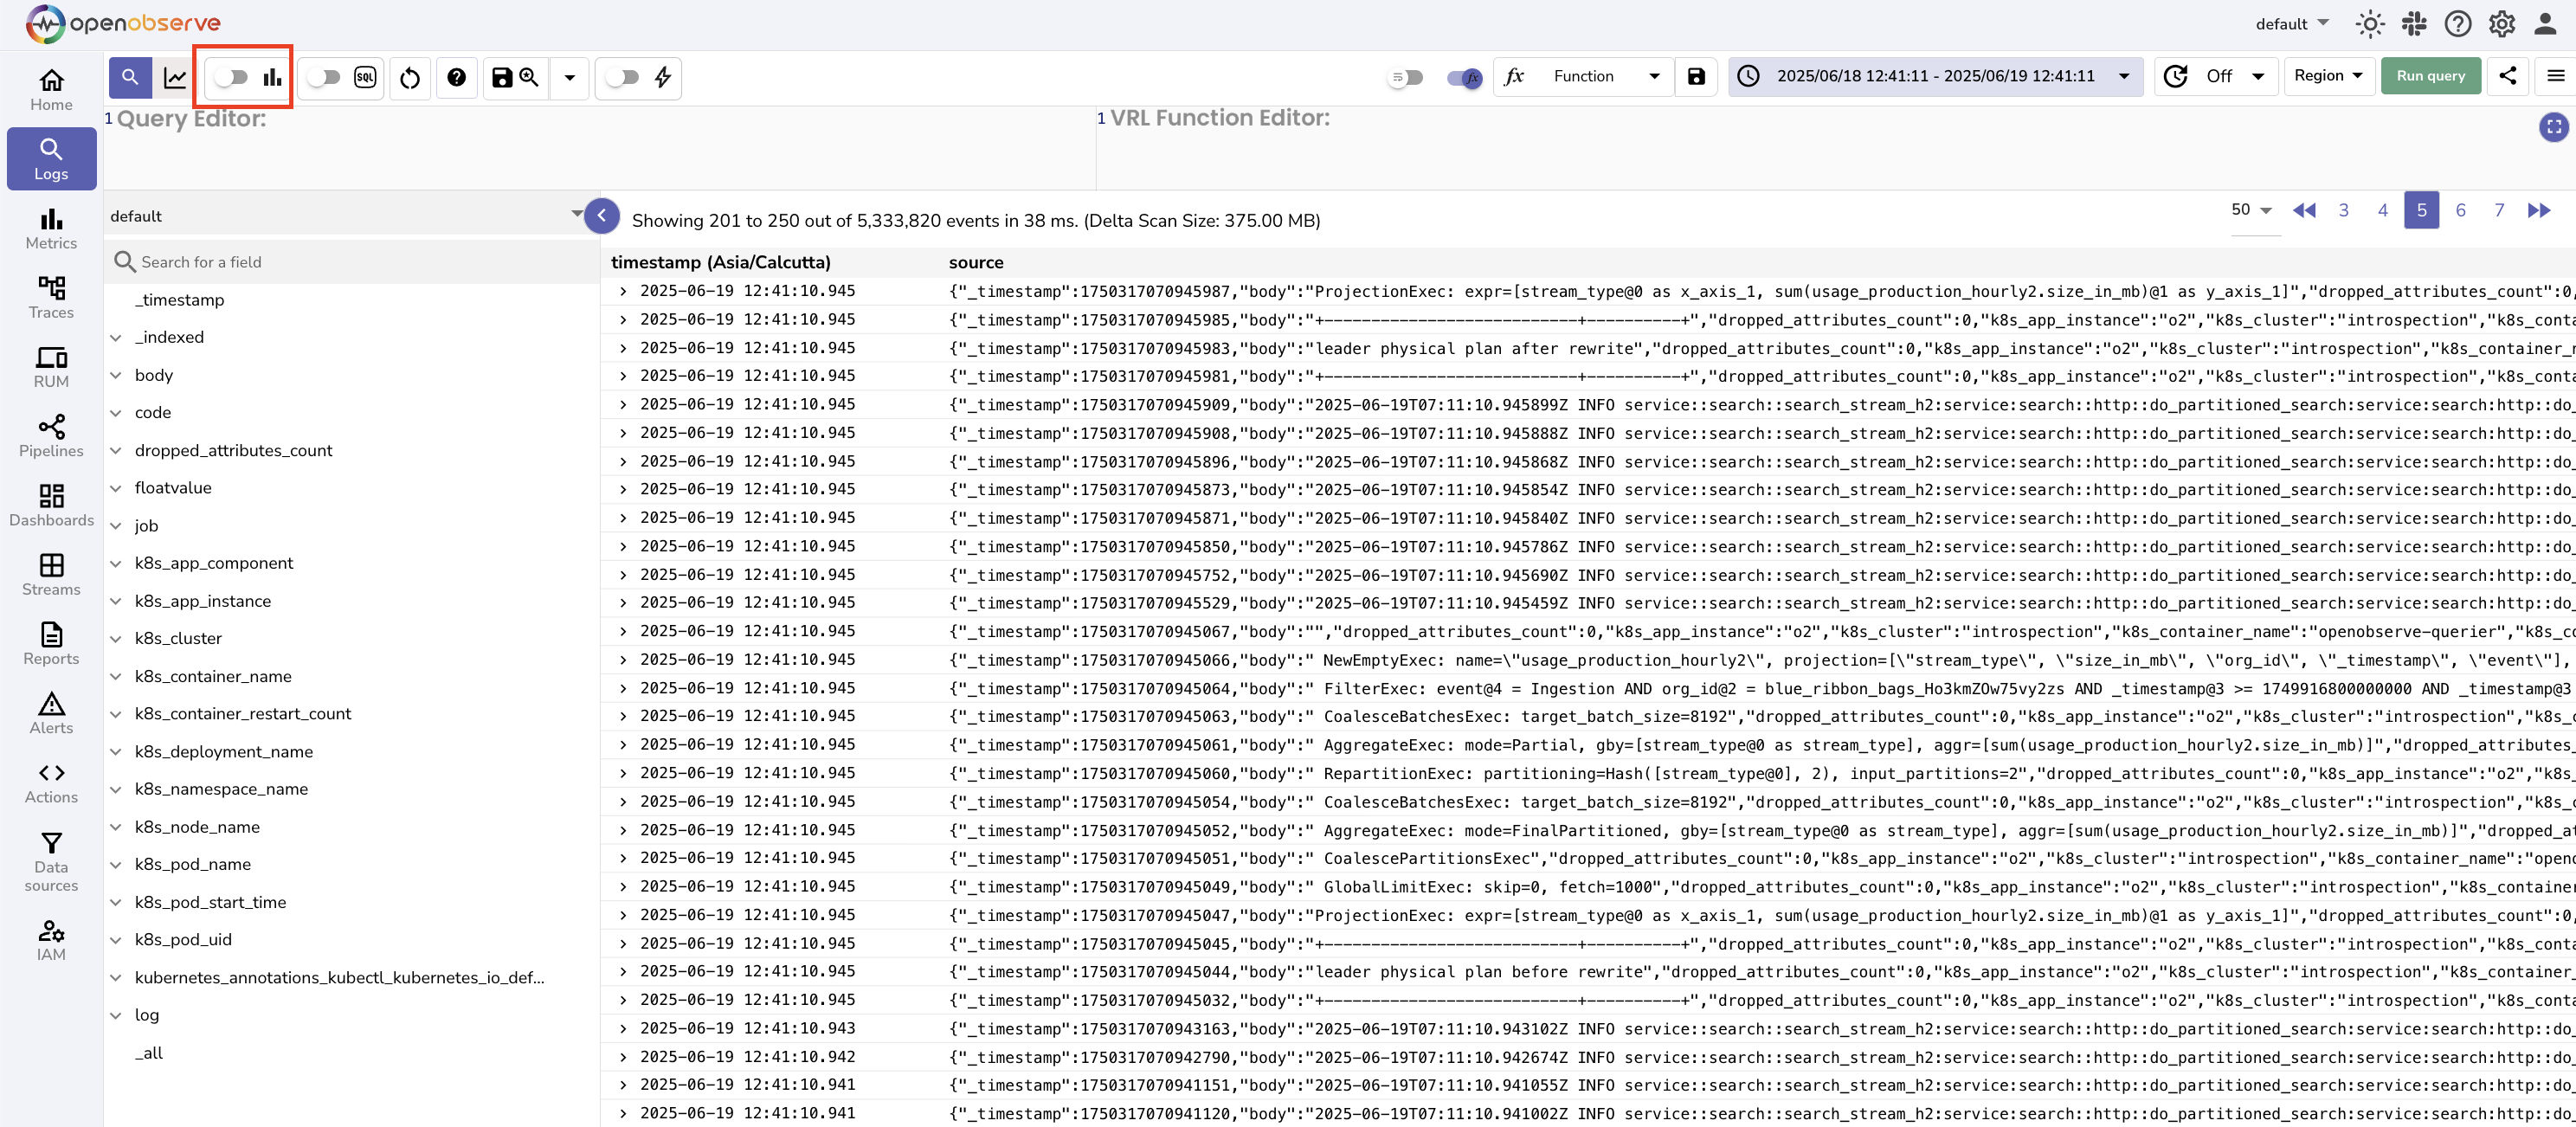
Use the Histogram and Chart
-
The histogram displays log event distribution over time. Use the Histogram toggle to hide it when not needed.
When the stream contains a recognized category field, such as
severity,log_level,level, orstatus, the histogram is automatically rendered as a stacked bar chart, with each category colored separately and a scrollable legend. The set of recognized fields is configurable by an administrator using theZO_HISTOGRAM_BREAKDOWN_FIELDSenvironment variable.In SQL mode, the histogram is not shown for queries that use
LIMIT,DISTINCT,JOIN, or CTEs (WITH). In these cases, the UI displays the message: Histogram unavailable for CTEs, DISTINCT, JOIN and LIMIT queries. -
The Visualize toggle enables or disables the chart panel, which allows you to plot logs using the available chart options for visual analysis.
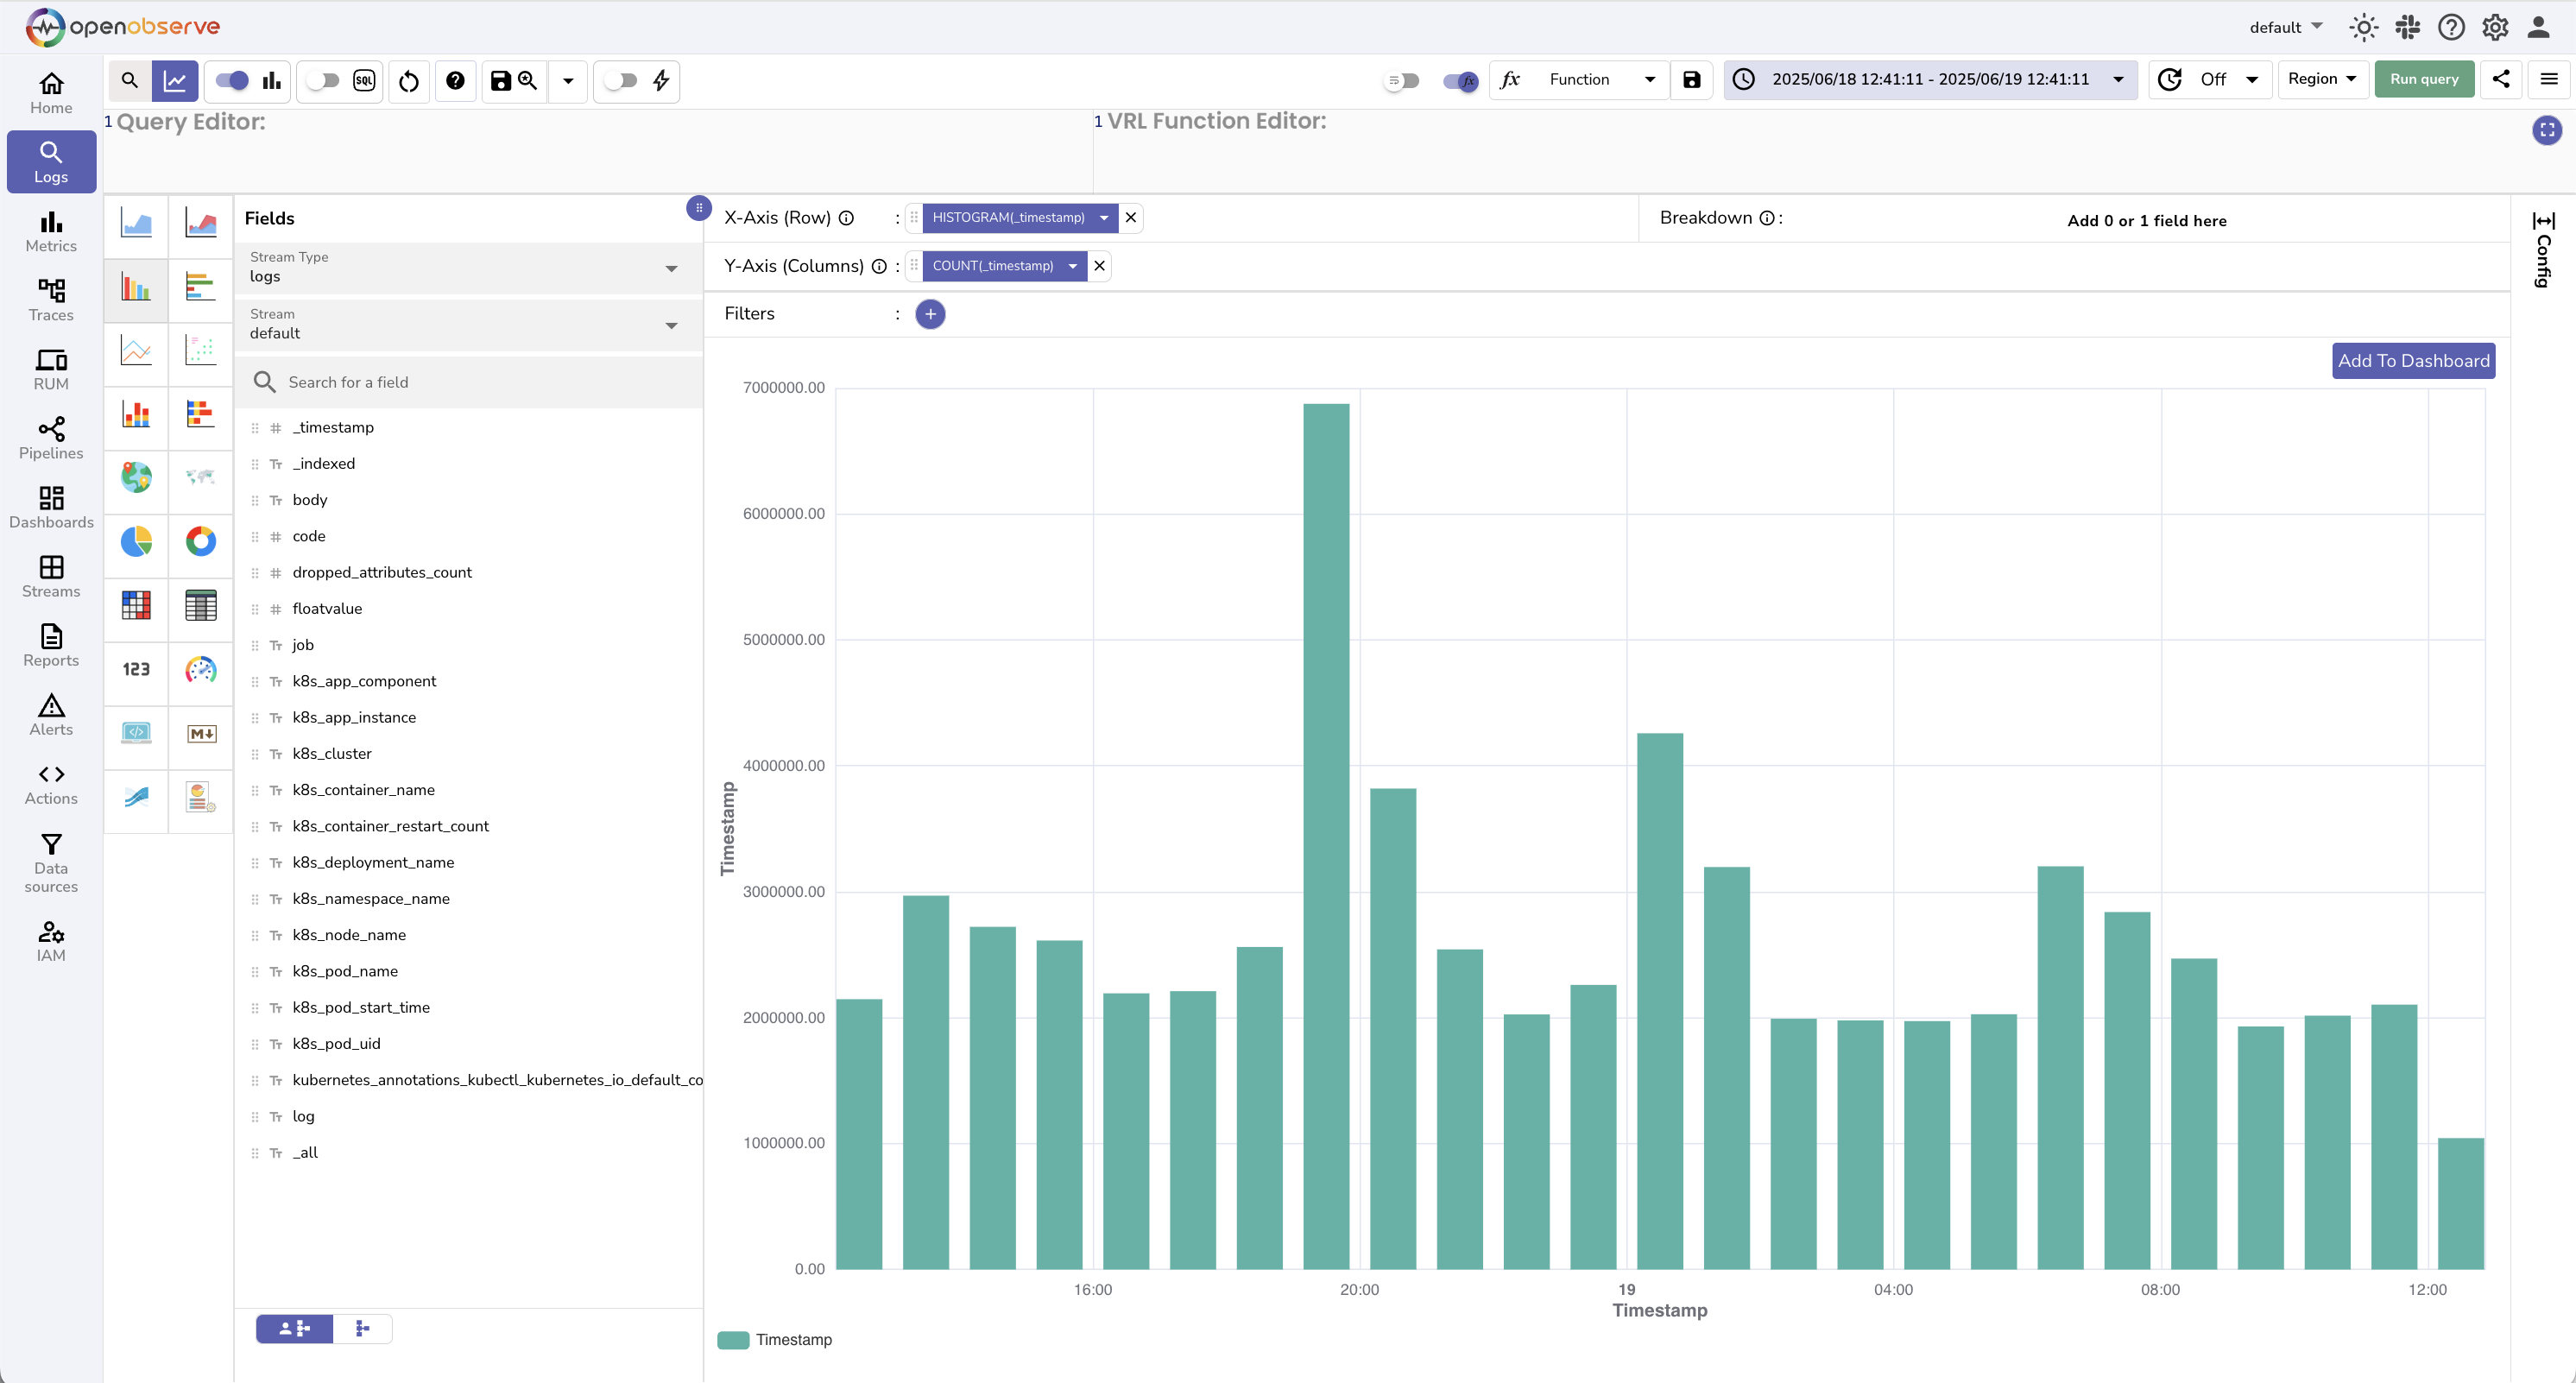
These tools help you quickly identify trends or activity spikes within the selected time range.
Transform Logs with VRL
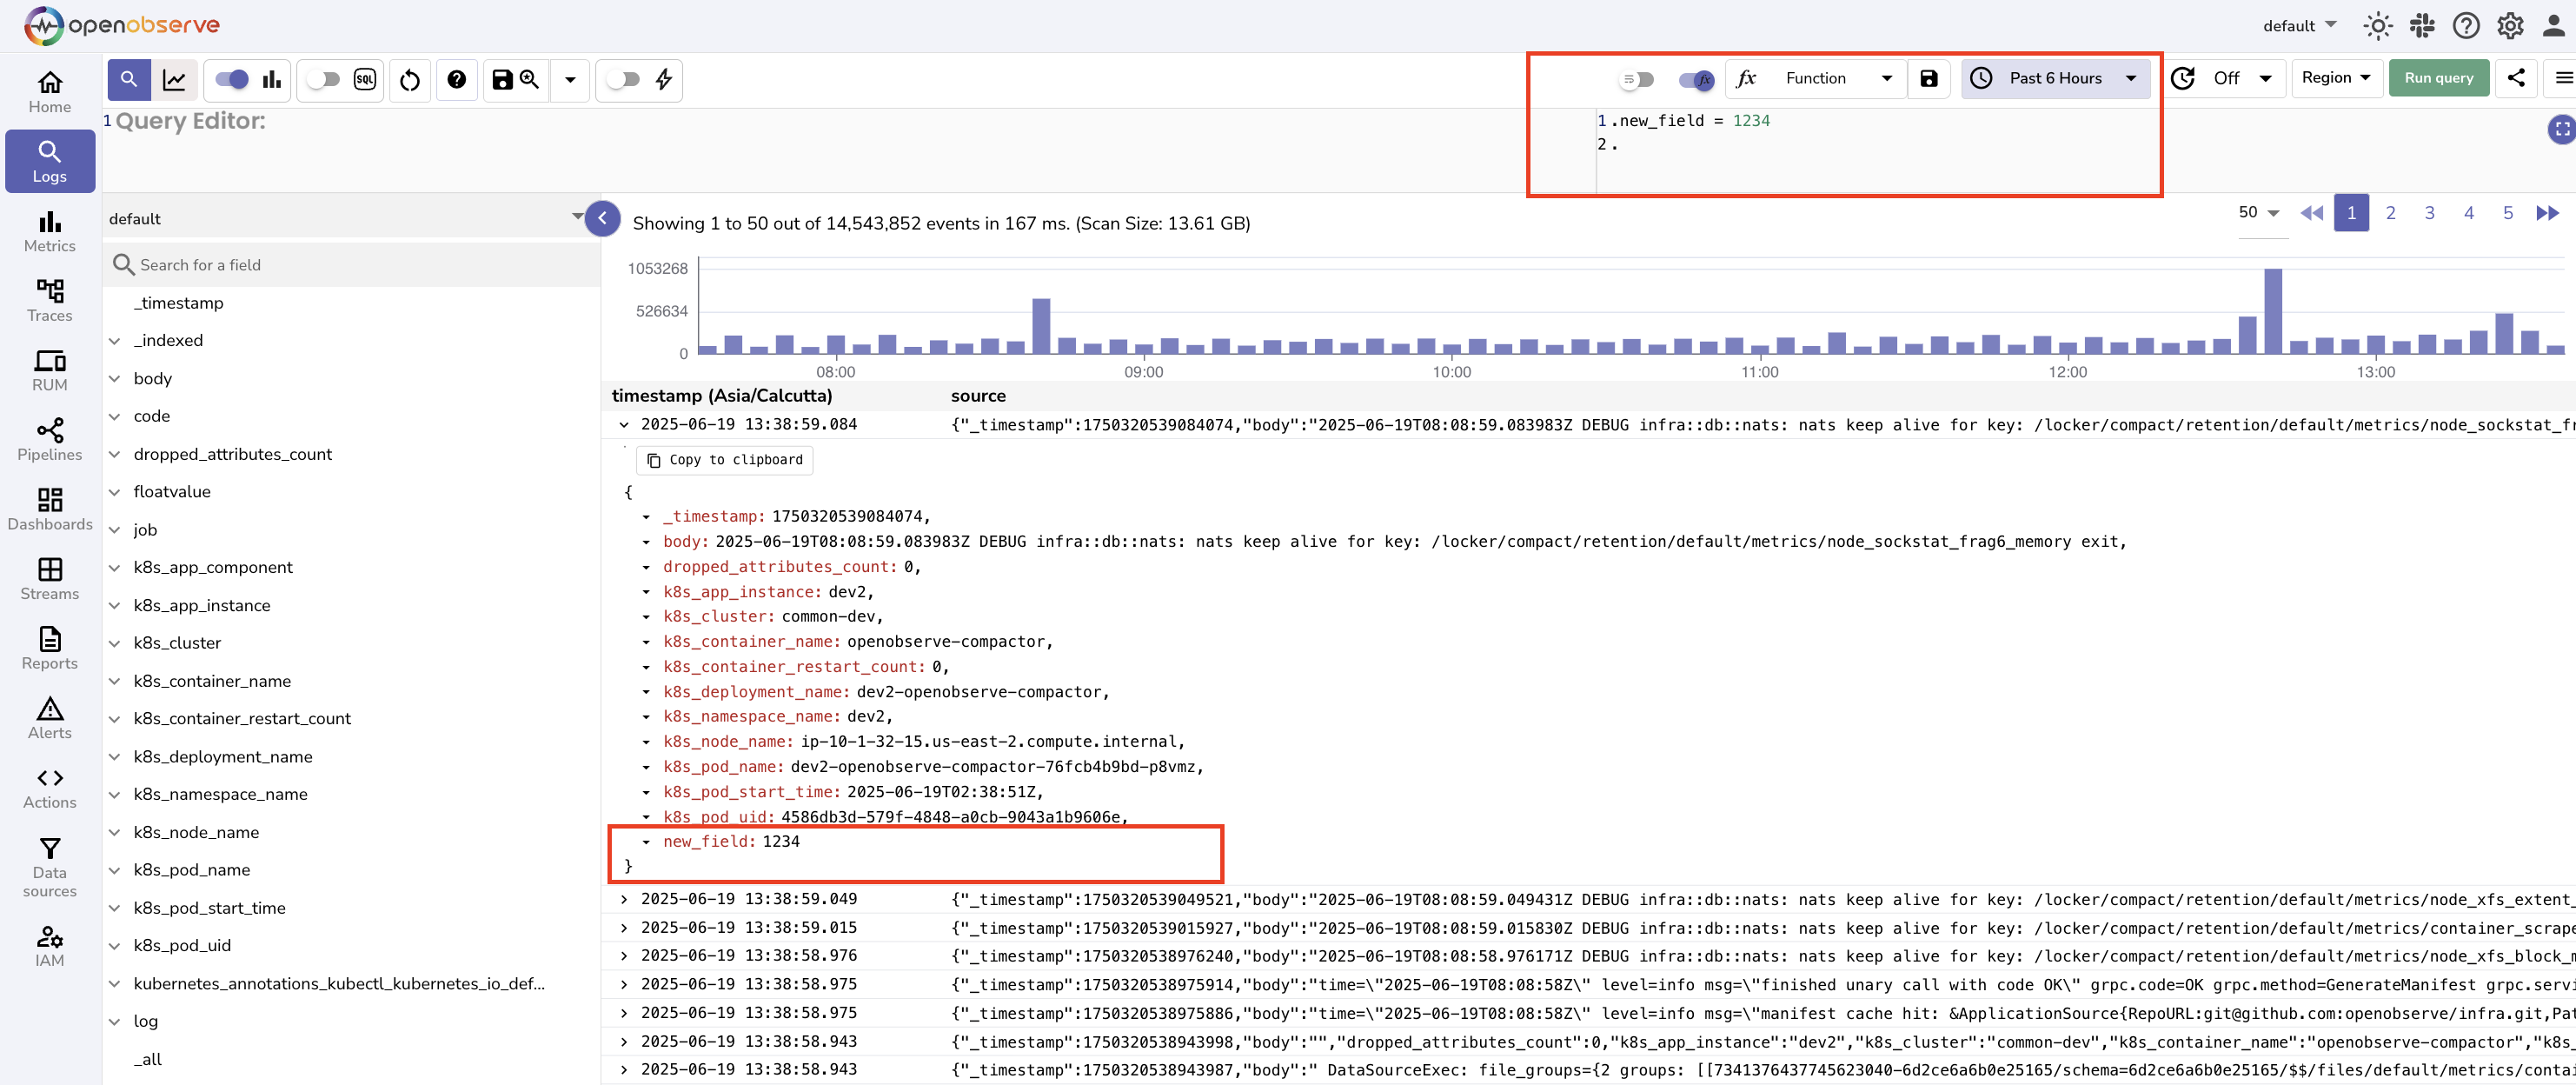
Click the VRL Function Editor toggle to write and apply a VRL function to the query output.
- Go to the VRL Function Editor.
- Select a saved function or write one manually. Learn more about VRL functions.
- Run the query to apply the transformation.
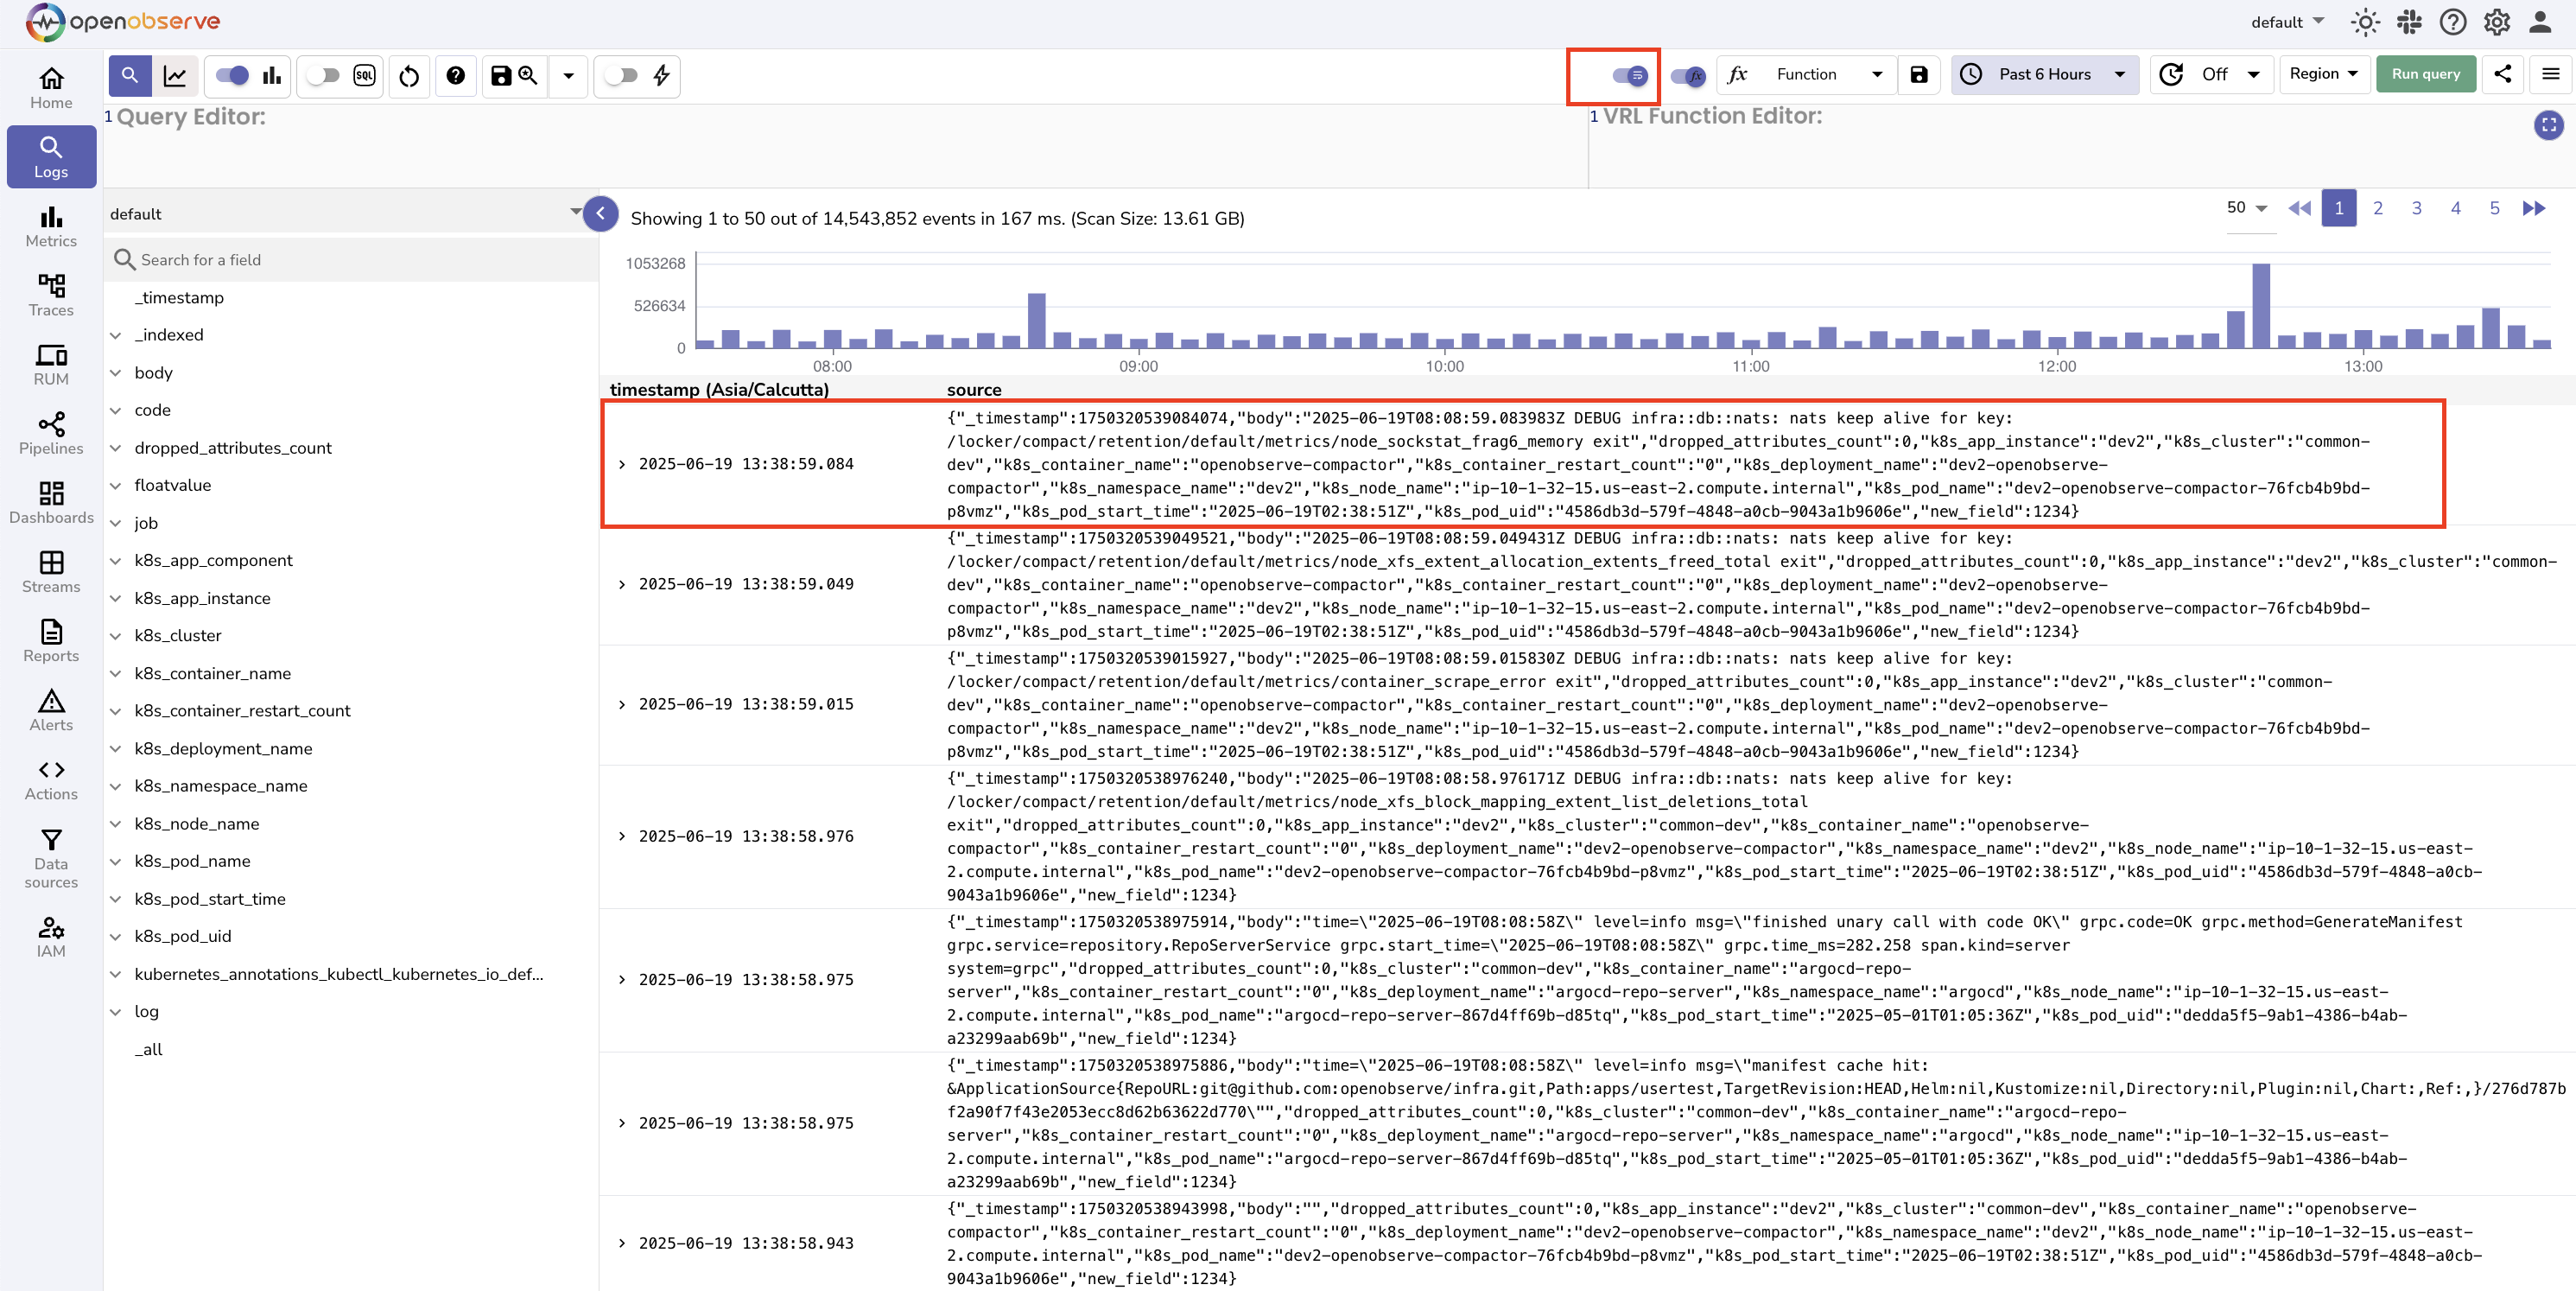
Adjust Display Options
-
Wrap Table Content: Toggle to enable word wrapping in the results table.
-
Auto Refresh: Set a refresh interval to update query results continuously.
These options help customize the view for your analysis needs.
Save and Reuse Views
To save a query and its configuration:
- Click the Save View icon.
- Enter a name in the dialog box.
- Click Save.
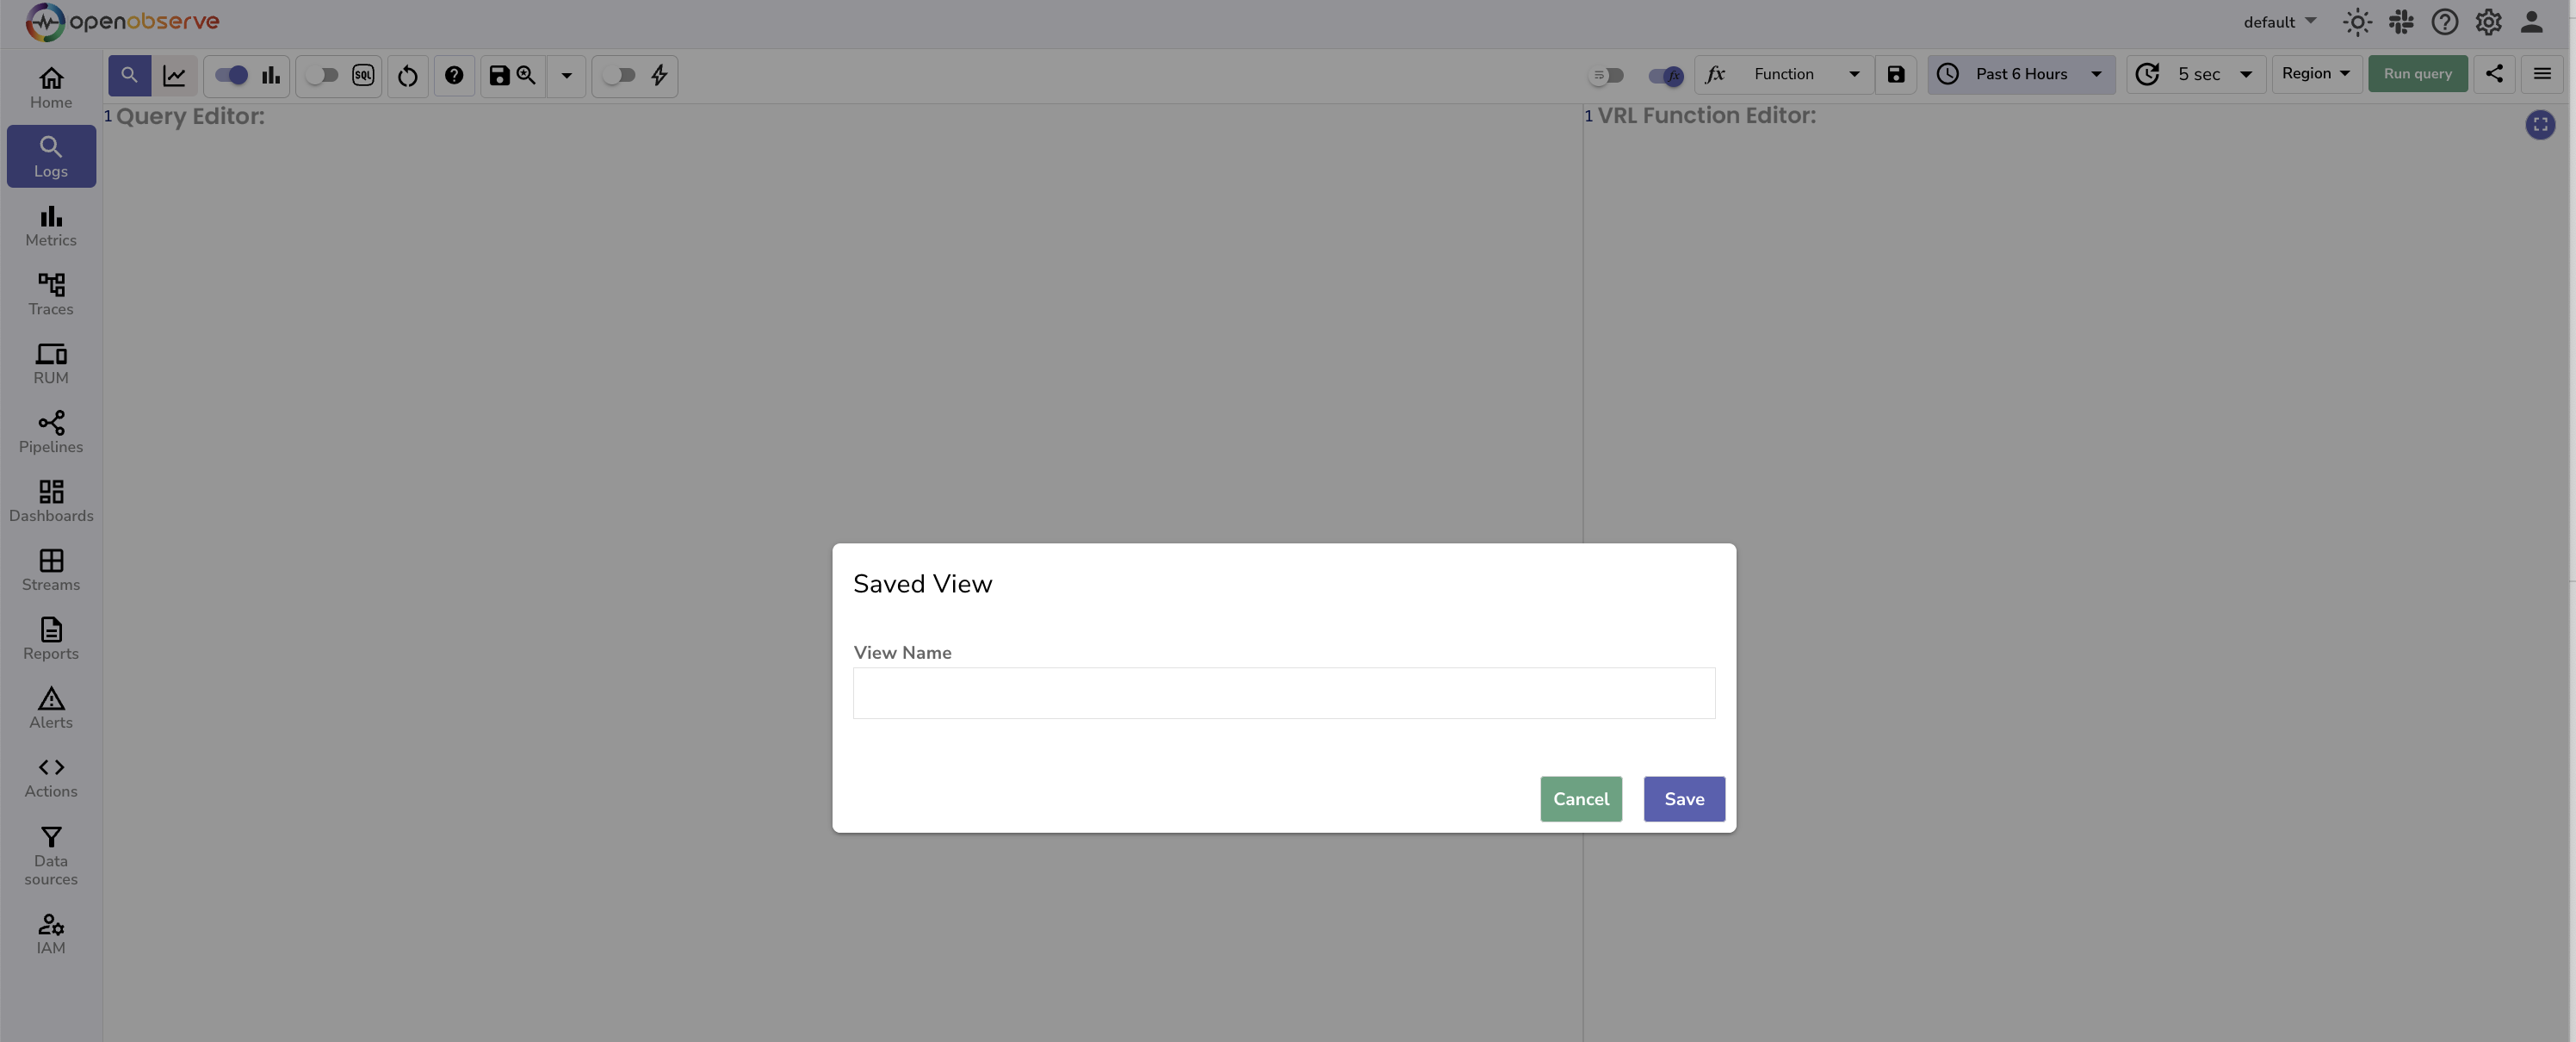
View names must be unique within the organization (case-insensitive); saving with a name that already exists returns an error.
Use the dropdown next to the Save icon to reopen saved views at any time.
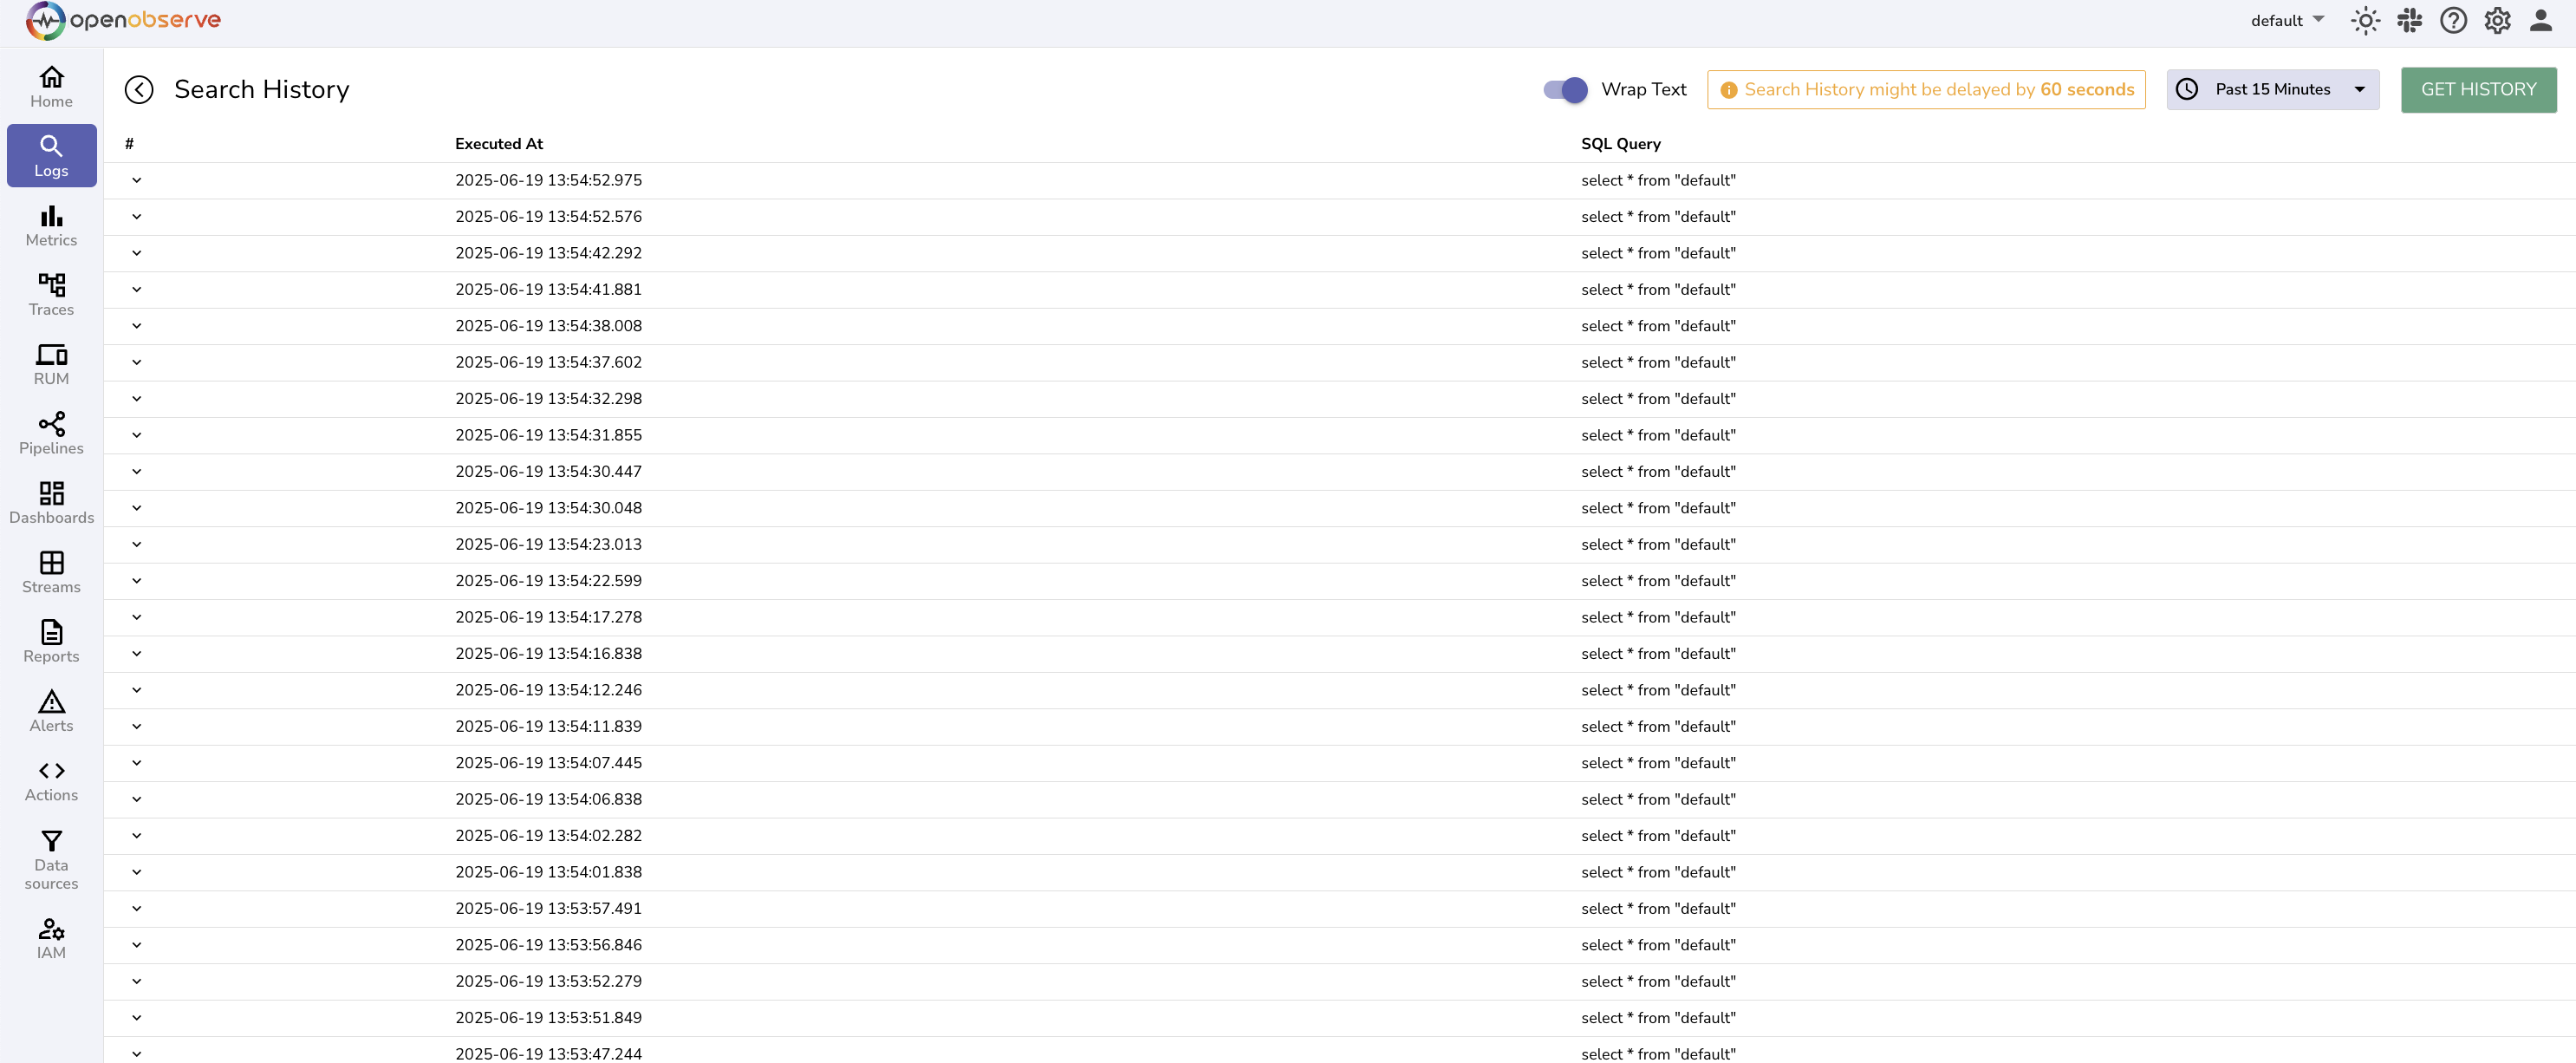
Export and Schedule Searches
Click the more options menu or the three-bar icon to access:
-
Search History: View your recently executed queries.
-
Download results: Export the results of the current query in CSV format.
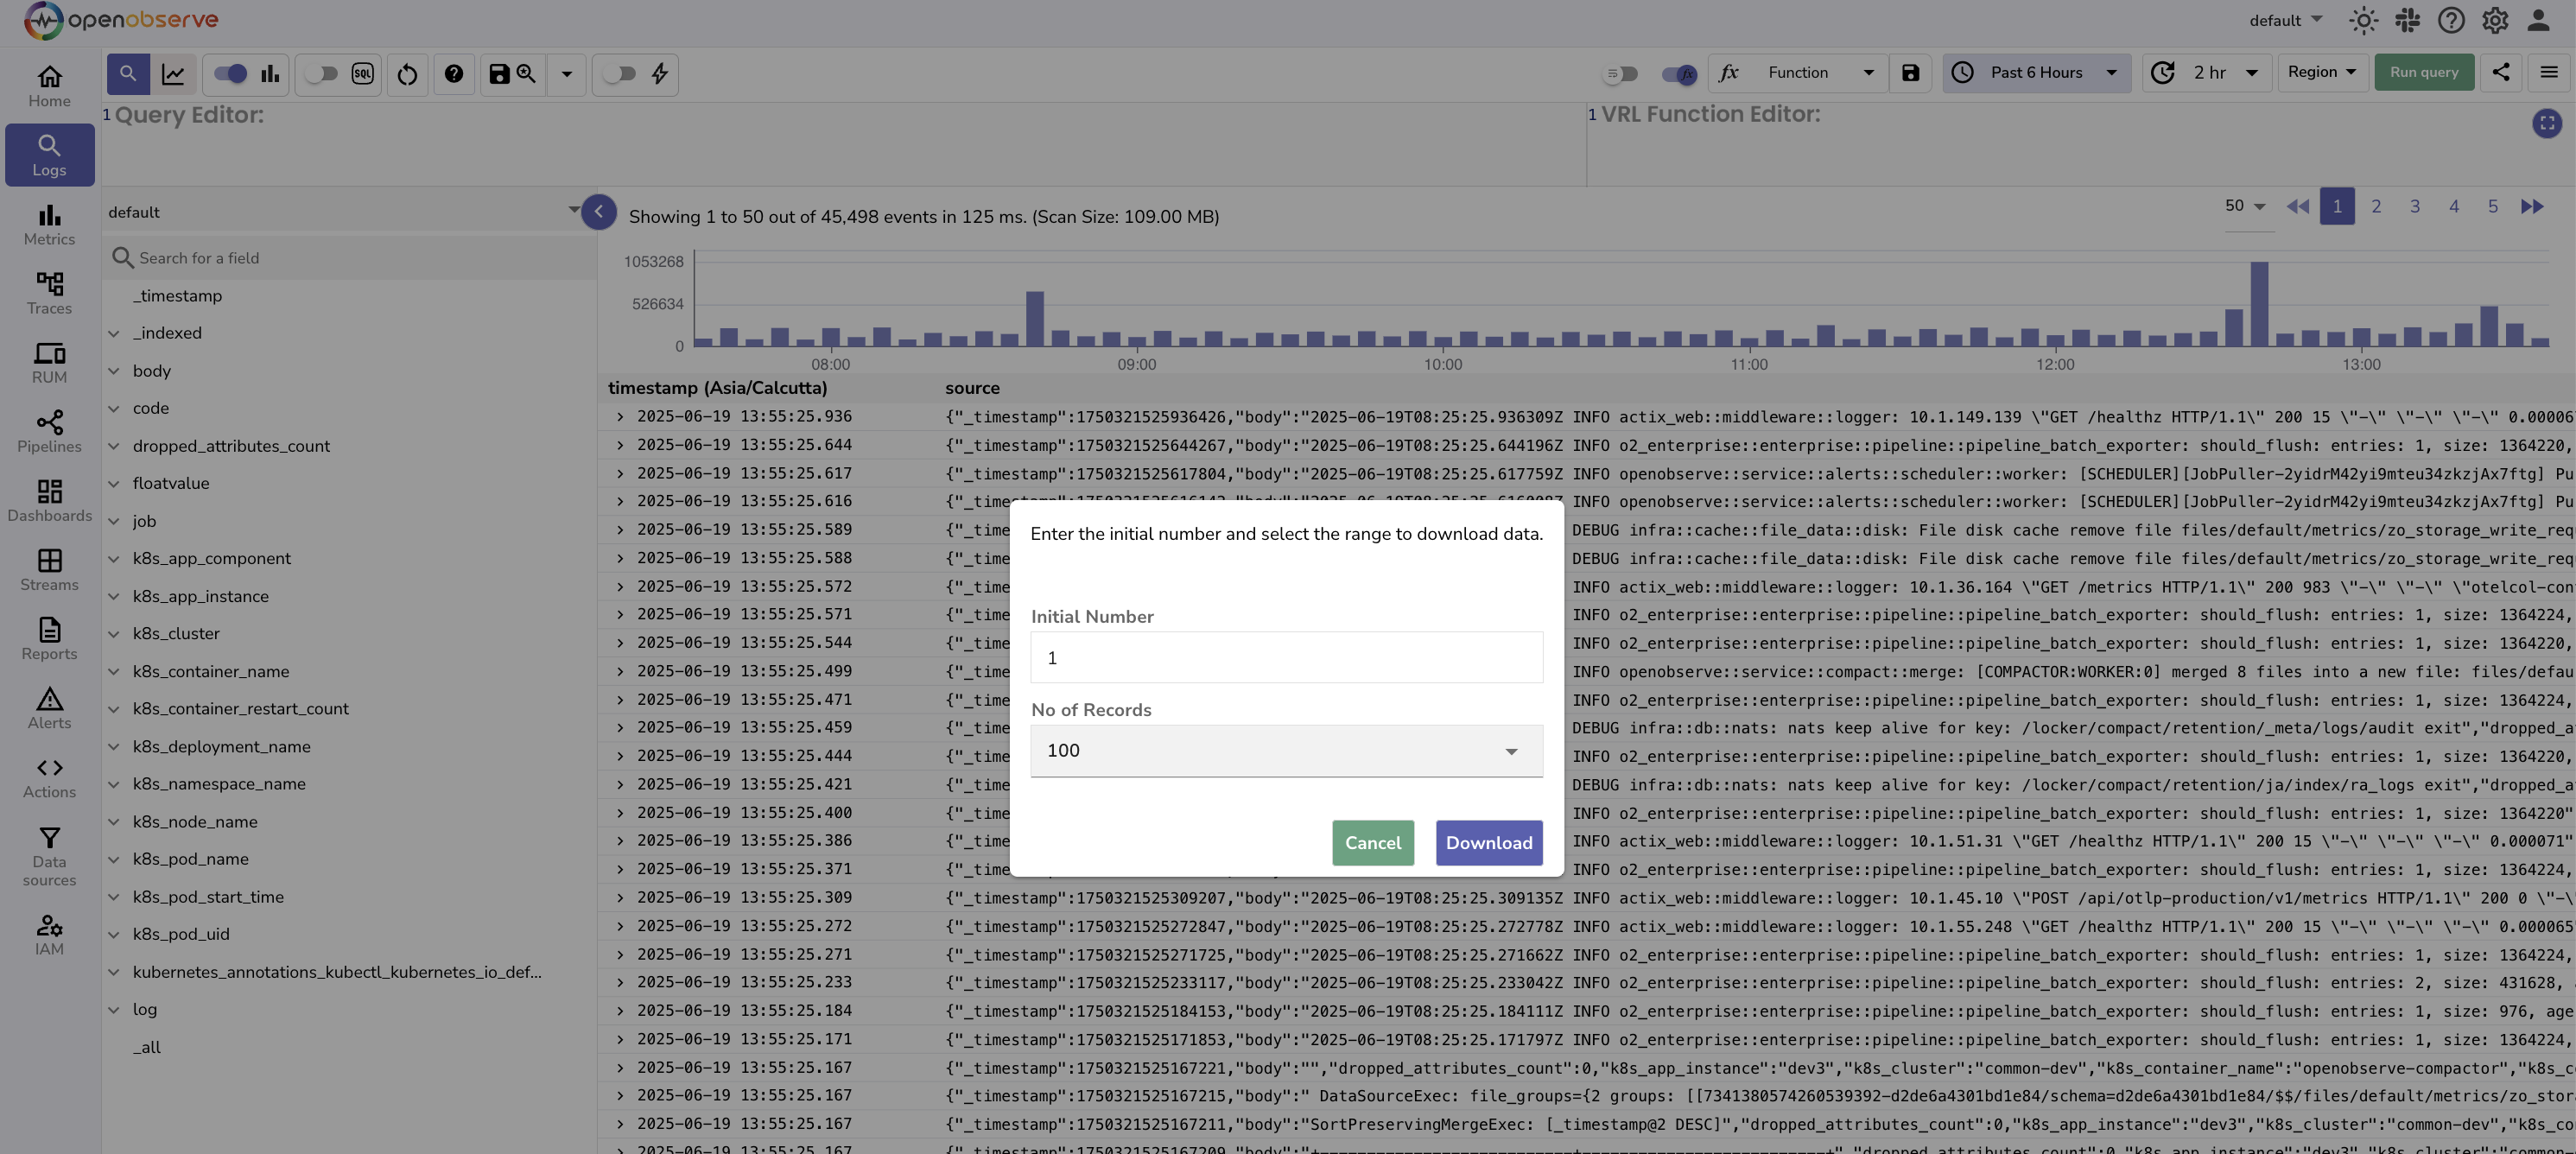
-
Download results for custom range: Export logs for a different time range in CSV format, without modifying the active query.
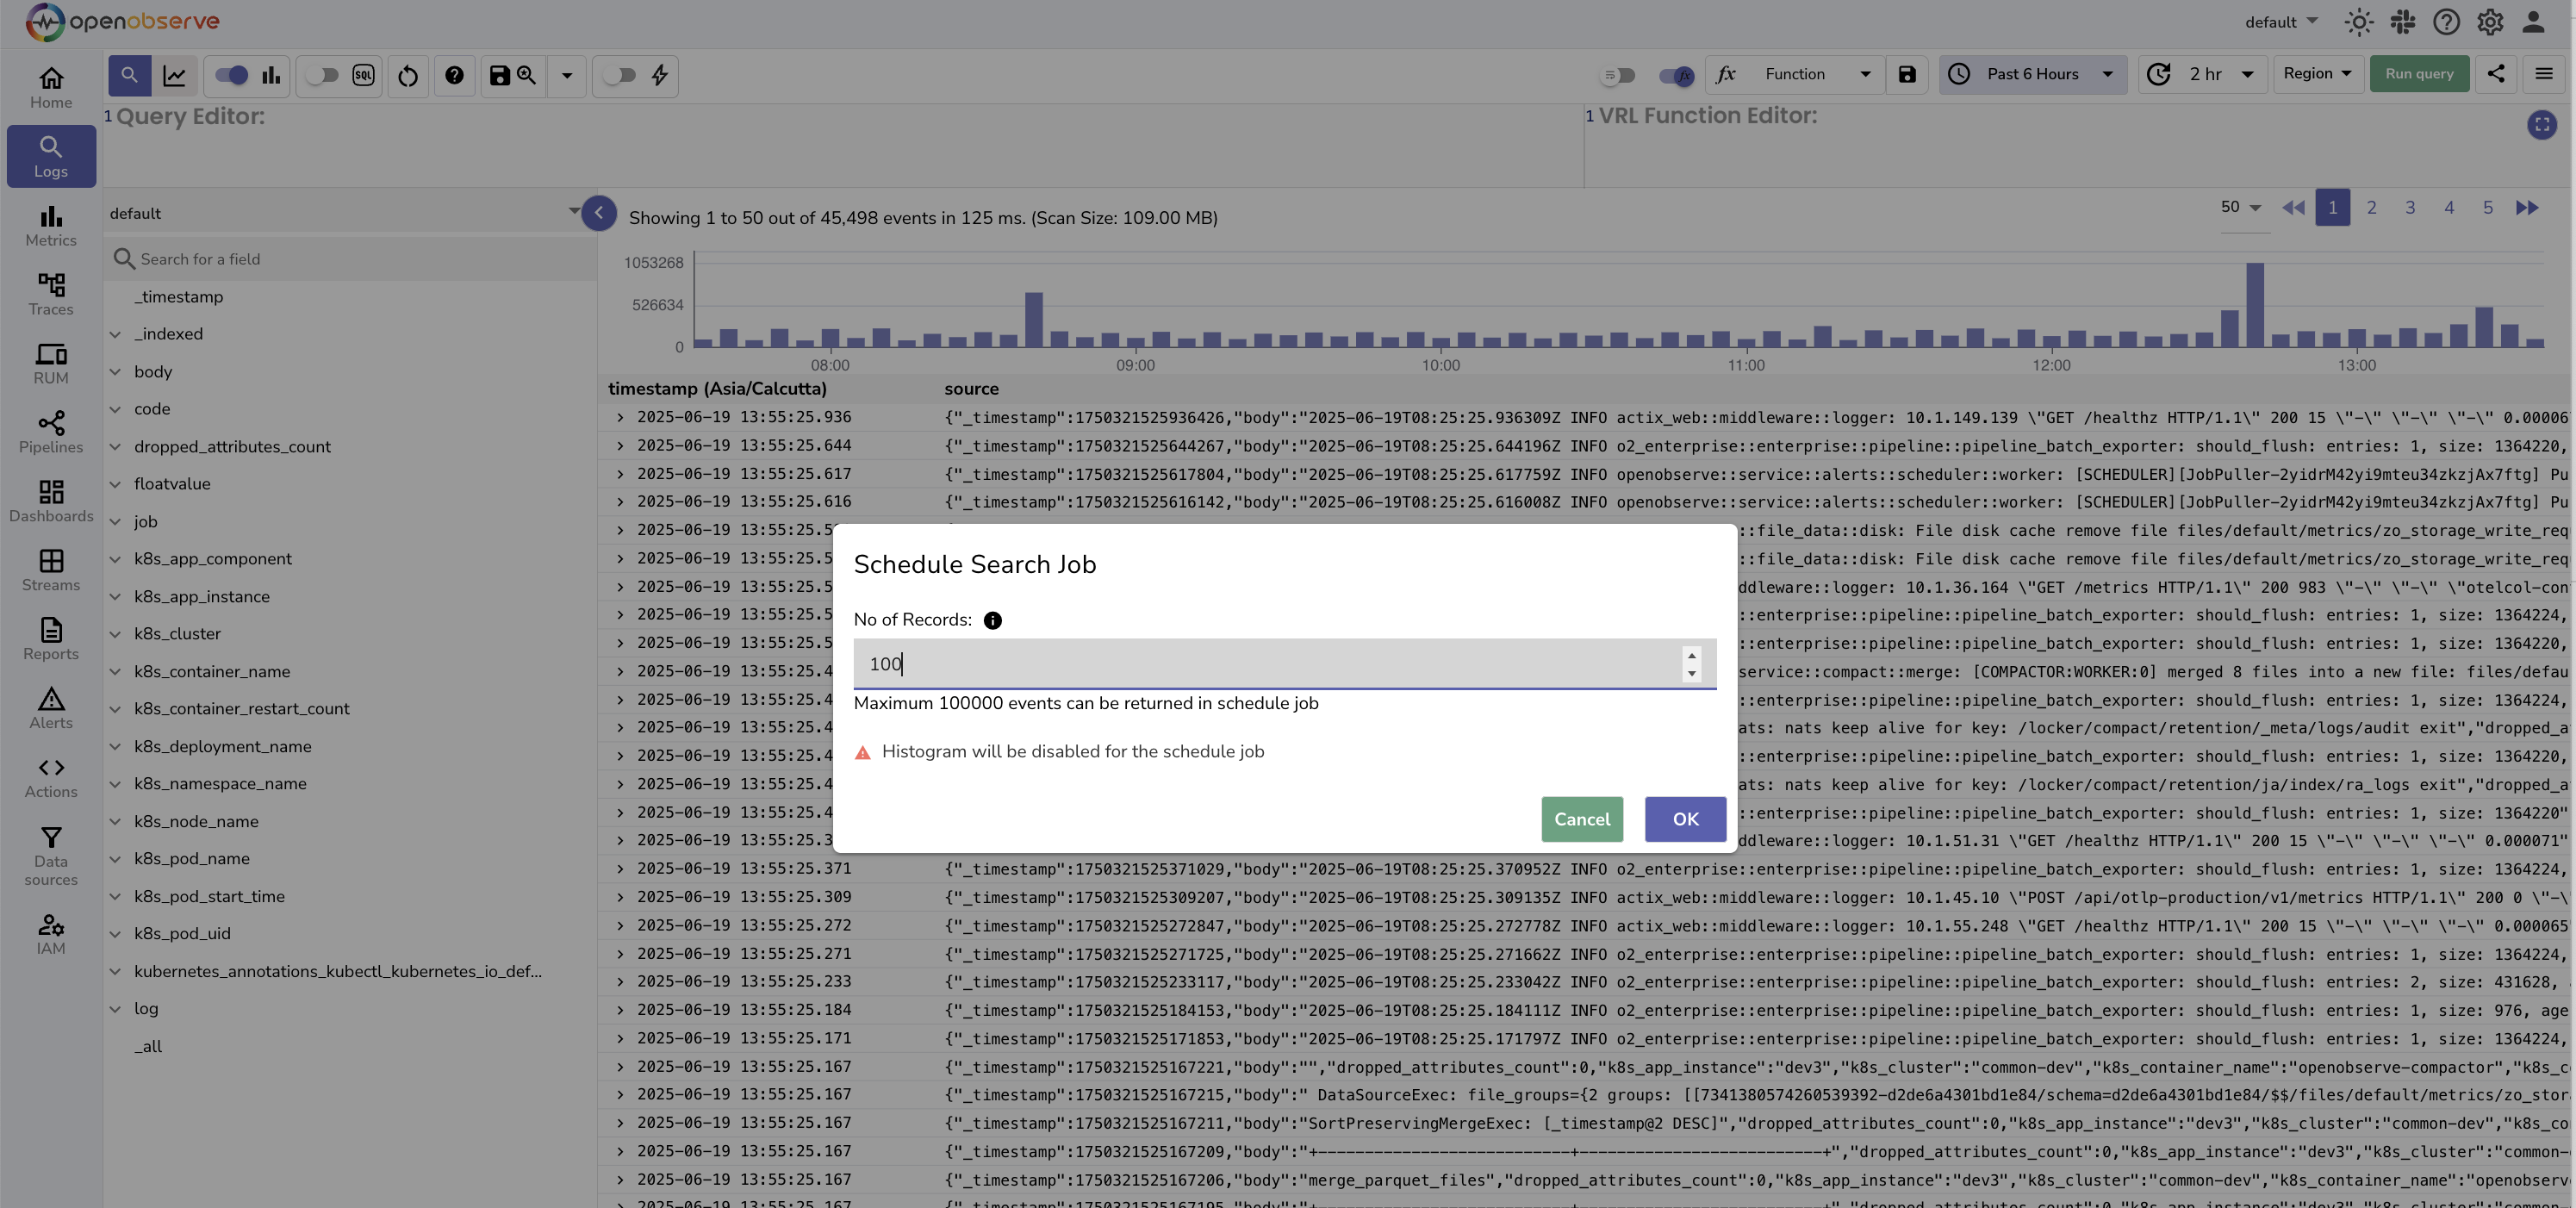
-
Create Scheduled Search: Set up recurring queries that run on a schedule.
-
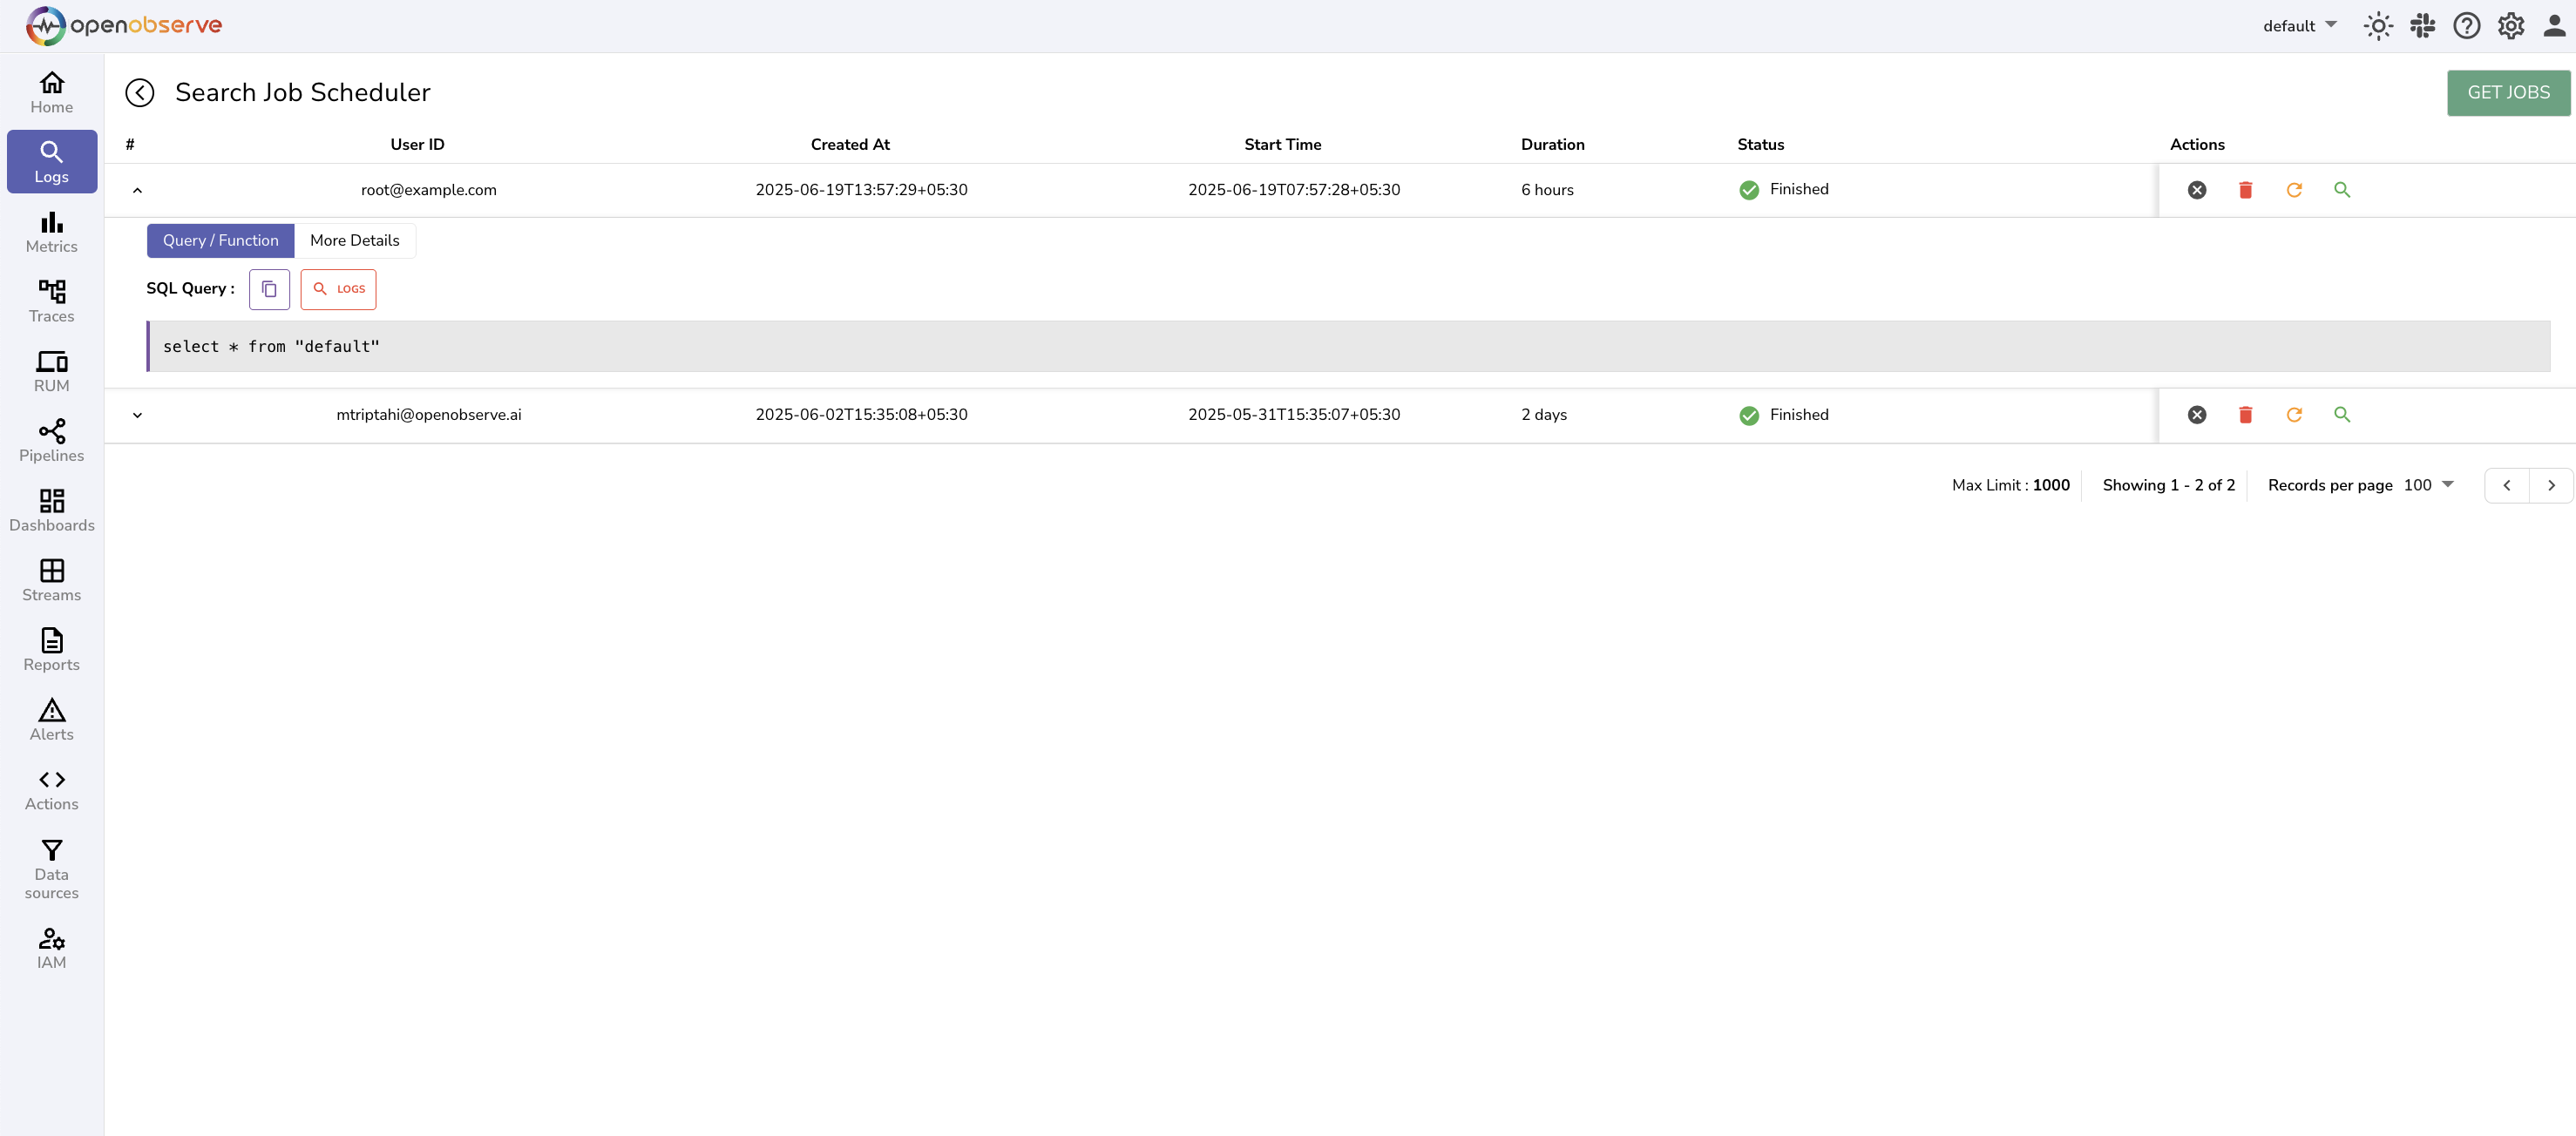
List Scheduled Search: View and manage scheduled searches.
Next Steps
- To learn how to visualize logs, refer to the Dashboards documentation.
- To learn how to monitor logs continuously, refer to the Alerts documentation.
Need some help?
- Join our Community Slack
- Or Contact support