Getting Started with Node.js in OpenTelemetry
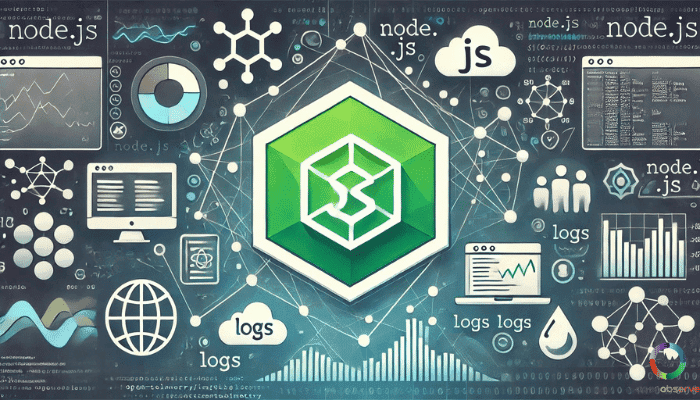
Introduction to OpenTelemetry in Node.js
Imagine peering into the inner workings of your Node.js application, seeing exactly how it handles every request, and uncovering hidden performance bottlenecks. With OpenTelemetry, that kind of deep visibility is within reach.
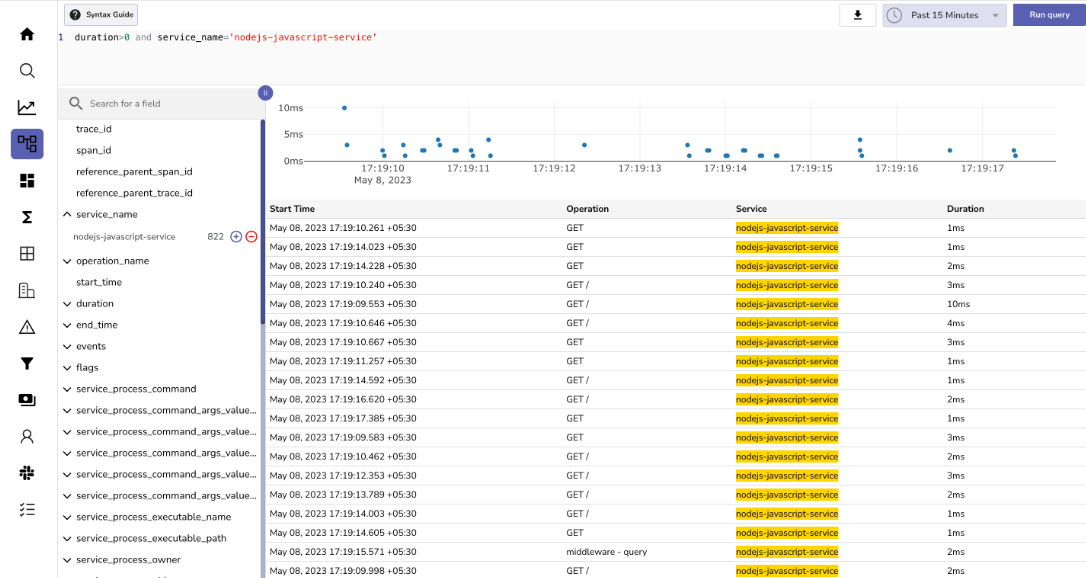
What is OpenTelemetry?
OpenTelemetry is an observability framework that helps developers collect and analyze data about their applications. It is particularly useful for Node.js applications, as it provides a set of APIs, SDKs, and tools to gather telemetry data, such as tracing, metrics, and logs.
Capabilities of OpenTelemetry
OpenTelemetry has several key capabilities that make it useful for Node.js developers:
- Tracing: OpenTelemetry can trace the flow of requests through your application, providing detailed information about the performance of individual components and the overall application.
- Metrics: OpenTelemetry can collect and export metrics about your application, such as CPU usage, memory usage, and request rates.
- Logs: OpenTelemetry can integrate with your application's logging system to collect and export log data, making it easier to diagnose and troubleshoot issues.
Telemetry data is essential for understanding the performance and behavior of your Node.js application.
This can save you time and effort, as you don't have to build your custom observability solution from scratch.
Getting Started with OpenTelemetry in Node.js
To get started with OpenTelemetry in your Node.js application, you'll need to install the necessary packages and configure your application to use the OpenTelemetry SDK. There are plenty of resources available online to help you get started, including documentation, tutorials, and sample code.
These are discussed in more details in the article. In the next section you will learn about the prerequisites for using OpenTelemetry in Node.js.
Prerequisites for Using OpenTelemetry in Node.js
Before you can start using OpenTelemetry in your Node.js application, you need to ensure that you have the necessary tools and software installed. Here are the prerequisites to get started:
Node.js Installation
The first step is to ensure that you have Node.js installed on your system. OpenTelemetry supports Node.js versions that are actively maintained or in LTS (Long-Term Support) mode. This ensures you have access to the latest security patches and bug fixes.
TypeScript Installation
If your project uses TypeScript, you must ensure that it is installed on your system. TypeScript is a superset of JavaScript that adds optional static typing and other features to improve the development experience. While not required, using TypeScript can help you catch errors early and improve code maintainability.
By following these simple steps, you can ensure that you have the necessary tools to get started with OpenTelemetry.
In the next section, you will learn how to set up your first OpenTelemetry project.
Setting Up Your First OpenTelemetry Project
In this section, you will walk through the process of setting up your first OpenTelemetry project in Node.js. You will start by creating a basic Node.js application using Express, and then we'll guide you through the steps to set up OpenTelemetry in your project.
Creating a Basic Node.js Application
Let's start by creating a simple Node.js application using Express. First, create a new directory for your project and navigate to it in your terminal. Then, run the following commands to set up your project:
npm init -y
npm install express
This will create a new package.json file and install the Express dependency.
Next, create a new file called app.js and add the following code:
javascript
const express = require('express');
const app = express();
const port = 3000;

app.get('/', (req, res) => {
  res.send('Hello, OpenTelemetry!');
});

app.listen(port, () => {
  console.log(`Server is running on port ${port}`);
});
This code sets up a basic Express server that listens on port 3000 and responds with a "Hello, OpenTelemetry!" message when the root URL is accessed.
Gain Powerful Insights into Your Node.js Apps: Sign up for Free with OpenObserve and start monitoring your Node.js applications with OpenTelemetry today!
Setting Up TypeScript
If your project uses TypeScript, you must set up the necessary configuration. Run the following commands to install TypeScript and initialize a tsconfig.json file:
npm install --save-dev typescript
npx tsc --init
This will create a tsconfig.json file in your project directory, which you can customize to fit your project's needs.
Now that you have a basic Node.js application set up, you're ready to start integrating OpenTelemetry into your project.
In the next section, we'll cover the steps to install and configure OpenTelemetry in your Node.js application.
Instrumentation with OpenTelemetry
This section will guide you through the process of installing the necessary packages and setting up automatic instrumentation in your Node.js application.
Installing the Node SDK and Auto-Instrumentation Package
To start instrumenting your Node.js application with OpenTelemetry, you'll need to install the OpenTelemetry Node SDK and the auto-instrumentation package. Run the following command in your terminal:
bash
npm install @opentelemetry/sdk-node @opentelemetry/auto-instrumentations-node
Setting Up Automatic Instrumentation
Once you have the packages installed, you can set up automatic instrumentation in your Node.js application. This involves configuring the auto-instrumentation package to capture telemetry data for your application.
To do this, create a new file called instrumentation.js and add the following code:
javascript
const { registerInstrumentations } = require('@opentelemetry/auto-instrumentations-node');

registerInstrumentations({
  instrumentations: [
    {
      name: 'express',
      version: '4.17.1',
    },
  ],
});
This code registers the Express instrumentation with OpenTelemetry, which will automatically capture telemetry data for your Express application.
Manual Instrumentation
In addition to automatic instrumentation, you can also use manual instrumentation to capture custom telemetry data. This involves creating custom instrumentation using OpenTelemetry APIs.
For example, let's say you want to capture telemetry data for a specific function in your application. You can create a custom instrumentation using the following code:
javascript
const { Span } = require('@opentelemetry/api');

function myFunction() {
  const span = Span.start('my-function');
  try {
    // Your code here
  } finally {
    span.end();
  }
}
This code creates a new span for the myFunction function and captures telemetry data for the function's execution.
In the next section, you will learn how to configure exporters for telemetry data.
Collecting and Exporting Telemetry Data
Once telemetry data is collected, it is processed by OpenTelemetry to provide insights into the performance and behavior of your application. This processing includes filtering, aggregation, and transformation of the data.
Configuring Exporters
To send telemetry data to analysis tools, you need to configure exporters. Exporters are responsible for sending telemetry data to specific destinations, such as log files, databases, or cloud-based services.
Configuring Exporters for Analysis Tools
To configure exporters for analysis tools, you need to specify the destination and any required configuration options. For example, to send telemetry data to a log file, you would specify the log file path and any required log levels.
Conclusion
By following these steps, you can effectively collect and export telemetry data to gain insights into the performance and behavior of your application.
In the next section, you will learn about some advanced topics in Node.js applications.
Advanced Topics
In this section, we will explore advanced topics in OpenTelemetry, focusing on context management, custom context propagation, and sampling strategies.
Context Management in Node.js Applications
Context management is a crucial aspect of OpenTelemetry, as it helps to identify and manage the context of your application. In Node.js applications, context management is particularly important, as it allows you to track the flow of requests and responses across multiple services.
To manage context in your Node.js application, you can use the @opentelemetry/context package. This package provides a set of APIs for creating and managing context objects.
Here is an example of how you can use the @opentelemetry/context package to create a context object:
javascript
const { Context } = require('@opentelemetry/context');

const context = new Context();

// Set the user ID on the context
context.set('user_id', '12345');

// Get the user ID from the context
const userId = context.get('user_id');
Implementing Custom Context Propagation
In addition to using the @opentelemetry/context package, you can also implement custom context propagation in your application. This involves creating a custom context propagation strategy that is tailored to your specific use case.
For example, you can create a custom context propagation strategy that propagates the user ID from the context to the request headers:
javascript
const { Context } = require('@opentelemetry/context');

const context = new Context();

// Set the user ID on the context
context.set('user_id', '12345');

// Create a custom context propagation strategy
function propagateContext(context) {
  // Propagate the user ID from the context to the request headers
  const headers = {
    'X-User-Id': context.get('user_id'),
  };
  return headers;
}

// Use the custom context propagation strategy
const headers = propagateContext(context);
Sampling Strategies
Sampling strategies are used to reduce the volume of telemetry data by selectively capturing and sending telemetry data to the analysis tools. There are several sampling strategies available in OpenTelemetry, including:
- Random Sampling: This strategy randomly selects a subset of telemetry data to capture and send to the analysis tools.
- Fixed Rate Sampling: This strategy captures and sends a fixed rate of telemetry data to the analysis tools.
- Exponential Sampling: This strategy captures and sends telemetry data at an exponential rate.
Here is an example of how you can use the @opentelemetry/sampling package to implement a random sampling strategy:
javascript
const { Sampling } = require('@opentelemetry/sampling');

// Create a random sampling strategy
const samplingStrategy = new Sampling({
  type: 'random',
  probability: 0.5,
});

// Use the sampling strategy to capture and send telemetry data
const telemetryData = samplingStrategy.sample(telemetryData);
By understanding these advanced topics, you can effectively manage and analyze telemetry data in your Node.js applications.
In the next section, you will learn about deploying and monitoring serverless applications.
Deploying and Monitoring Serverless Applications
Serverless applications have become increasingly popular due to their scalability, cost-efficiency, and ease of deployment. However, managing and monitoring serverless applications can be challenging due to their distributed nature.
In this section, we will explore the best practices for deploying and monitoring serverless applications using OpenTelemetry.
Instrumenting Serverless Functions with OpenTelemetry
To instrument serverless functions with OpenTelemetry, you need to follow these steps:
Install OpenTelemetry:
npm install @opentelemetry/sdk-node @opentelemetry/exporter-console
Create a Tracer:
javascript
const { Tracer } = require('@opentelemetry/sdk-trace-node');
const tracer = new Tracer();
Create a Span:
const span = tracer.startSpan('my-function');Add Attributes:
span.setAttribute('user_id', '12345');End the Span:
span.end();
Monitoring Serverless Applications
Monitoring serverless applications involves tracking key performance indicators (KPIs) such as response time, error rates, and resource utilization. Here are some best practices for monitoring serverless applications:
Use CloudWatch:
bash
aws cloudwatch put-metric-data --metric-name CPUUtilization --namespace AWS/EC2 --value 0.5
Use Prometheus:
bash
prometheus --config.file=prometheus.yml
Use Grafana:
bash
grafana --config.file=grafana.yml
In this section, we have covered the best practices for deploying and monitoring serverless applications using OpenTelemetry.
In the next section, you will learn how OpenObserve can help you in getting started with Node.js in OpenTelemetry.
Using OpenObserve with Node.js
To use OpenObserve with Node.js, you need to follow these steps:
Install the OpenObserve SDK for Node.js using npm
bash
npm install @openobserve/pino-openobserve
Create a Pino logger and configure it to send logs to OpenObserve
javascript
const pino = require("pino");
const pinoOpenObserve = require('@openobserve/pino-openobserve');

const logger = pino({
  level: "info"
}, new pinoOpenObserve({
  url: 'https://alpha1.dev.zinclabs.dev/',
  organization: 'YOUR_ORGANIZATION_NAME',
  auth: {
    username: "YOUR_USERNAME",
    password: "YOUR_PASSWORD",
  },
  streamName: "YOUR_STREAM_NAME",
  batchSize: 1,
  timeThreshold: 15 * 1000
}));

app.use(express.json());
app.get("/hello", (req, res) => {
  logger.info({ log: `Hello World`, type: "GET", url: "/hello" });
  res.send("Hello World");
});
Send logs to OpenObserve using the Pino logger
javascript
logger.info({ log: `Hello World`, type: "GET", url: "/hello" });
Setting Up OpenObserve
To set up OpenObserve, you need to follow these steps:
- Sign Up: Go to the OpenObserve website and sign up for an account.
- Create a Project: Create a new project in OpenObserve and note down the project ID.
- Install the OpenObserve SDK: Install the OpenObserve SDK for your programming language (e.g., Node.js).
- Configure the SDK: Configure the SDK with your project ID and other required settings.
Stop Guessing, Start Knowing: Eliminate Performance Bottlenecks in Your Node.js Applications with OpenTelemetry and OpenObserve. Sign up for Free Now!
In the next section, you will learn how to troubleshoot implementation issues.
Troubleshooting and Feedback
As you work with OpenTelemetry, you may encounter various issues or have questions about the framework. In this article, we'll cover how to troubleshoot your OpenTelemetry implementation and provide feedback or get help from the community.
Troubleshooting OpenTelemetry
When you encounter issues with your OpenTelemetry implementation, the first step is to enable diagnostic logging. This will provide you with more detailed information about the inner workings of OpenTelemetry, which can help you identify and resolve the problem.
To enable diagnostic logging, you can use the following code:
javascript
const { LogLevel, ConsoleLogger } = require('@opentelemetry/core');

const logger = new ConsoleLogger({
  level: LogLevel.DEBUG,
});

// Set the logger for the OpenTelemetry SDK
const { NodeSDK } = require('@opentelemetry/sdk-node');
const sdk = new NodeSDK({
  logger,
  // Other SDK configuration options
});

// Initialize the SDK
sdk.start();
This code creates a new ConsoleLogger instance with the LogLevel.DEBUG setting, which will output detailed logs to the console. You can then use these logs to identify and troubleshoot any issues with your OpenTelemetry implementation.
Providing Feedback and Getting Help
If you have questions, feedback, or need help with OpenTelemetry, there are several ways to get in touch with the community:
- GitHub Discussions: The OpenTelemetry project has a dedicated GitHub Discussions page where you can ask questions, share ideas, and engage with the community. You can access the discussions at https://github.com/open-telemetry/opentelemetry-js/discussions.
- CNCF Slack: The OpenTelemetry project has an active community on the CNCF Slack workspace. You can join the workspace and participate in the #opentelemetry channel to get help and connect with other users. You can sign up for the CNCF Slack at https://slack.cncf.io/.
- OpenObserve Community: If you're using OpenObserve in addition to OpenTelemetry, you can also reach out to the OpenObserve community for support. You can find information about the OpenObserve community on the project's website at https://openobserve.ai/.
By leveraging these resources, you can ensure that you get the most out of your OpenTelemetry experience and contribute to the ongoing development of the project.
Conclusion
This article equips you with the basics of using OpenTelemetry to collect telemetry data from your Node.js applications. OpenObserve complements OpenTelemetry by providing Simplified Data Visualization and Robust Alerting.
By following these steps and leveraging OpenObserve, you can gain a comprehensive understanding of your Node.js application's performance and ensure a seamless user experience.
Gain Powerful Insights into Your Node.js Apps: Sign up for Free with OpenObserve and start monitoring your Node.js applications with OpenTelemetry today!
Additional Resources & Bibliography
- Check out the official OpenTelemetry Demo: https://github.com/open-telemetry/opentelemetry-demo
- OpenTelemetry JavaScript API functionalities with the official reference guide: https://opentelemetry.io/docs/languages/js/getting-started/nodejs/
- Explore a wider range of OpenTelemetry examples and tutorials to solidify your understanding: https://github.com/open-telemetry/opentelemetry.io
- A comprehensive walkthrough of instrumenting your Node.js application with OpenTelemetry: https://opentelemetry.io/docs/languages/js/getting-started/
- This video provides a good introduction to OpenTelemetry and walks you through instrumenting a Node.js application with tracing.
- This video provides a good introduction to OpenTelemetry and walks you through instrumenting a Node.js application with tracing: https://www.youtube.com/watch?v=n-Ar0nnho3s
- This video focuses on using OpenTelemetry with the Express framework in Node.js:https://www.youtube.com/watch?v=DYHAmbi42ZU by DebugBear.
- OpenObserve Documentation
- OpenObserve: The Ultimate Open-Source Platform
- Watch OpenObserve Videos on YouTube
Author:

The OpenObserve Team comprises dedicated professionals committed to revolutionizing system observability through their innovative platform, OpenObserve. Dedicated to streamlining data observation and system monitoring, offering high performance and cost-effective solutions for diverse use cases.


