Explore latest insights and updates
Evaluating Datadog competitors? Compare OpenObserve, Grafana, New Relic, Dynatrace, Splunk & more with pricing breakdowns, feature tables, and a step-by-step migration guide. Find the best alternative for your stack in 2026
Compare the best log management tools of 2026- Splunk, Datadog, Loki, OpenObserve & more. Features, pricing, and pros/cons in one guide.
Datadog's per-host billing, custom metric taxes, and two-part log pricing can turn a modest monitoring setup into a six-figure annual spend. See how OpenObserve's usage-based pricing compares — no host charges, no OTel penalties, no surprise bills.
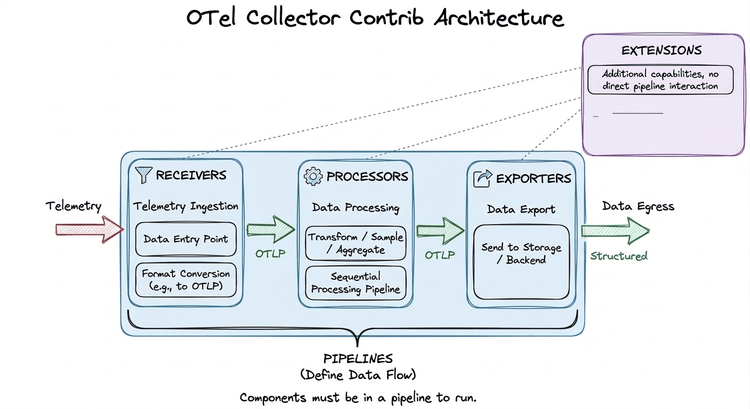
Learn how to use the OpenTelemetry Collector Contrib distribution to collect, process, and export telemetry data. This guide covers architecture, key components, configuration examples, and practical deployment tips.
Learn how to implement distributed tracing in a Java Spring Boot microservices application using the OpenTelemetry Java Agent and OpenObserve. Covers zero-code auto-instrumentation, JVM metrics, cross-service trace propagation, flamegraphs, and Gantt charts , with working source code and curl examples.
Looking for a Dynatrace alternative? Whether you're frustrated by DDU pricing complexity, vendor lock-in, or the steep learning curve, this guide covers the 10 best Dynatrace alternatives in 2026 from open-source platforms to enterprise SaaS tools.
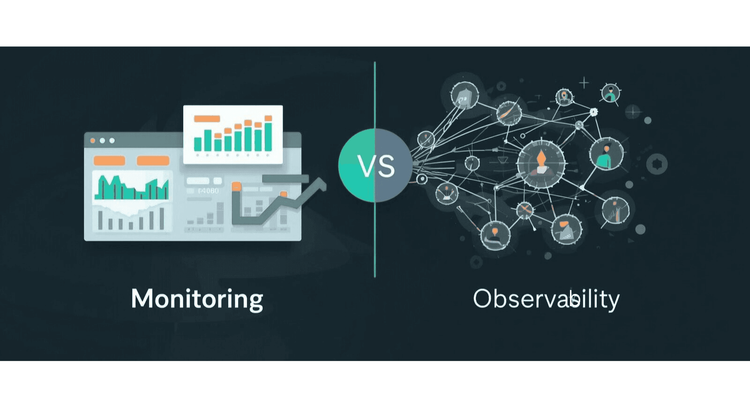
Observability vs monitoring explained. Learn the key differences, use cases, and why modern teams move beyond monitoring to observability.
Explore top New Relic alternatives that offer better pricing, open-source flexibility, and full-stack observability for modern DevOps and SRE teams.
A complete guide to full stack observability - covering frontend, backend, infrastructure, traces, logs, metrics, and OpenTelemetry for DevOps and SRE teams.
Discover the top open-source Grafana alternatives in 2026. Compare features like dashboards, alerting, metrics, logs, traces, scalability, and ease of use for modern DevOps teams.
Discover the best Elasticsearch alternatives in 2026. Compare open-source and commercial tools for search, log analytics, and observability. Find cost-effective solutions with our comprehensive guide covering OpenObserve, OpenSearch, Solr, and more.
Discover the best Splunk alternatives in 2026. Compare open-source and enterprise tools for log management, SIEM, and observability. Find cost-effective solutions with our comprehensive guide.
Lightstep sunsets March 2026. Compare 10 OpenTelemetry-native alternatives with cost data, migration guides, and real performance analysis. Find your replacement fast.
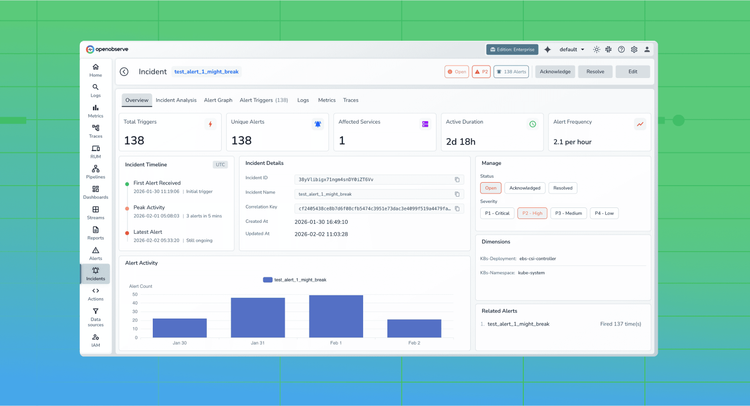
Learn how incident correlation transforms observability by connecting logs, metrics, traces, and alerts into actionable insights. Discover why modern engineering teams rely on correlated telemetry to reduce MTTR and eliminate blind spots in distributed systems.
Looking for a DataDog alternative for Real User Monitoring? Compare OpenObserve vs DataDog for RUM capabilities: session replay with privacy masking, Core Web Vitals tracking (LCP, INP, CLS), error detection, and SQL-based user analytics.
Compare the top 10 AIOps platforms in 2026. AI-powered observability tools for autonomous operations, cost optimization, and intelligent incident response.
Compare the top 10 open source APM tools in 2026. Features, pros & cons, tracing, metrics, logs, OpenTelemetry support, and real-world use cases.
Discover how OpenObserve built the "Council of Sub Agents" - eight specialized AI agents powered by Claude Code that automate end-to-end testing. Learn how we reduced feature analysis time from 60 minutes to 5 minutes, eliminated 85% of flaky tests, grew test coverage from 380 to 700+ tests, and caught a production bug before customers reported it. This deep dive reveals the architecture, real-world impact, and lessons learned from building an autonomous QA team that doesn't just automate testing - it amplifies quality.
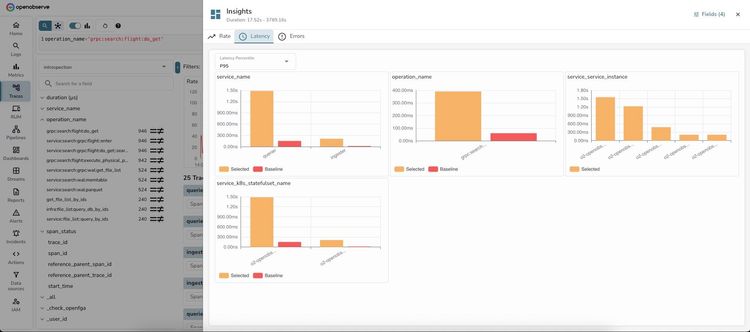
Learn how to use OpenObserve Insights for interactive log and trace analysis. Identify root causes in 60 seconds with dimension analysis. Real examples, step-by-step guides, and troubleshooting tips.
Cloud native was promised to be simple, yet observability has become a massive tax on both budgets and engineering time. Our new CRO, Shani Shoham, shares why he’s joining OpenObserve to break the cycle of expensive complexity and operational toil.
Compare the best APM tools in 2026 with real pricing data, technical analysis, and use case guides. OpenObserve delivers 60-90% cost savings with unified observability for logs, metrics, traces, and APM.