How to Monitor Apache Airflow Logs and Metrics Using OpenTelemetry

Chaitanya Sistla
January 22, 2025
4 min read
Don’t forget to share!
Try OpenObserve Cloud today for more efficient and performant observability.
Apache Airflow is a powerful workflow automation tool used for orchestrating complex data pipelines. It enables users to define, schedule, and monitor workflows as directed acyclic graphs (DAGs). However, monitoring Airflow logs and metrics is crucial to ensure the reliability and performance of workflows.
In this guide, we will explore how to monitor Airflow logs and metrics using OpenTelemetry (OTel) and OpenObserve. We will configure Airflow to emit telemetry data, install the OpenTelemetry Collector, and visualize logs and metrics in OpenObserve.
Apache Airflow is an open-source workflow automation tool that allows users to:
Monitoring Apache Airflow involves collecting:
To achieve this, we configure Airflow to send logs and metrics to an OpenTelemetry (OTel) collector, which forwards them to OpenObserve for visualization.
airflow.cfg for OpenTelemetryEdit the airflow.cfg file to enable OpenTelemetry for Airflow metrics.
[metrics]
otel_on = True
otel_host = localhost
otel_port = 4318
This ensures that Airflow emits OpenTelemetry metrics to an OpenTelemetry Collector running on localhost:4318.
Restart Airflow services after making these changes:
airflow db migrate
airflow scheduler -D
airflow webserver -D
The OpenTelemetry Collector is responsible for receiving logs and metrics from Airflow and forwarding them to OpenObserve.
wget https://github.com/open-telemetry/opentelemetry-collector-releases/releases/latest/download/otelcol-linux-amd64
chmod +x otelcol-linux-amd64
sudo mv otelcol-linux-amd64 /usr/local/bin/otelcol
Verify the installation:
otelcol --version
Create an OpenTelemetry Collector configuration file otel-config.yaml:
receivers:
  filelog/std:
    include:
      - /airflow/logs/*/*.log                # change the path
      - /airflow/logs/scheduler/*/*/*/*.log  # change the path
    start_at: beginning
  otlp:
    protocols:
      grpc:
      http:
processors:
  batch:

extensions:
  zpages: {}

exporters:
  otlphttp/openobserve:
    endpoint: https://example.com/api/default/ # add these configurations from O2 data source section
    headers:
      Authorization: "Basic cdcfefgqg=" # add these configurations from O2 data source section
      stream-name: blog_airflow # you can set this anything

service:
  pipelines:
    metrics:
      receivers: [otlp]
      processors: [batch]
      exporters: [otlphttp/openobserve]
    logs:
      receivers: [filelog/std, otlp]
      processors: [batch]
      exporters: [otlphttp/openobserve]
    traces:
      receivers: [otlp]
      processors: [batch]
      exporters: [otlphttp/openobserve]
This configuration does the following:
/airflow/logs/ and /airflow/logs/scheduler/. otlp receiver. blog_airflow).Start the OpenTelemetry Collector with this configuration:
systemctl start otel-collector
To check if it's running:
systemctl status otel-collector
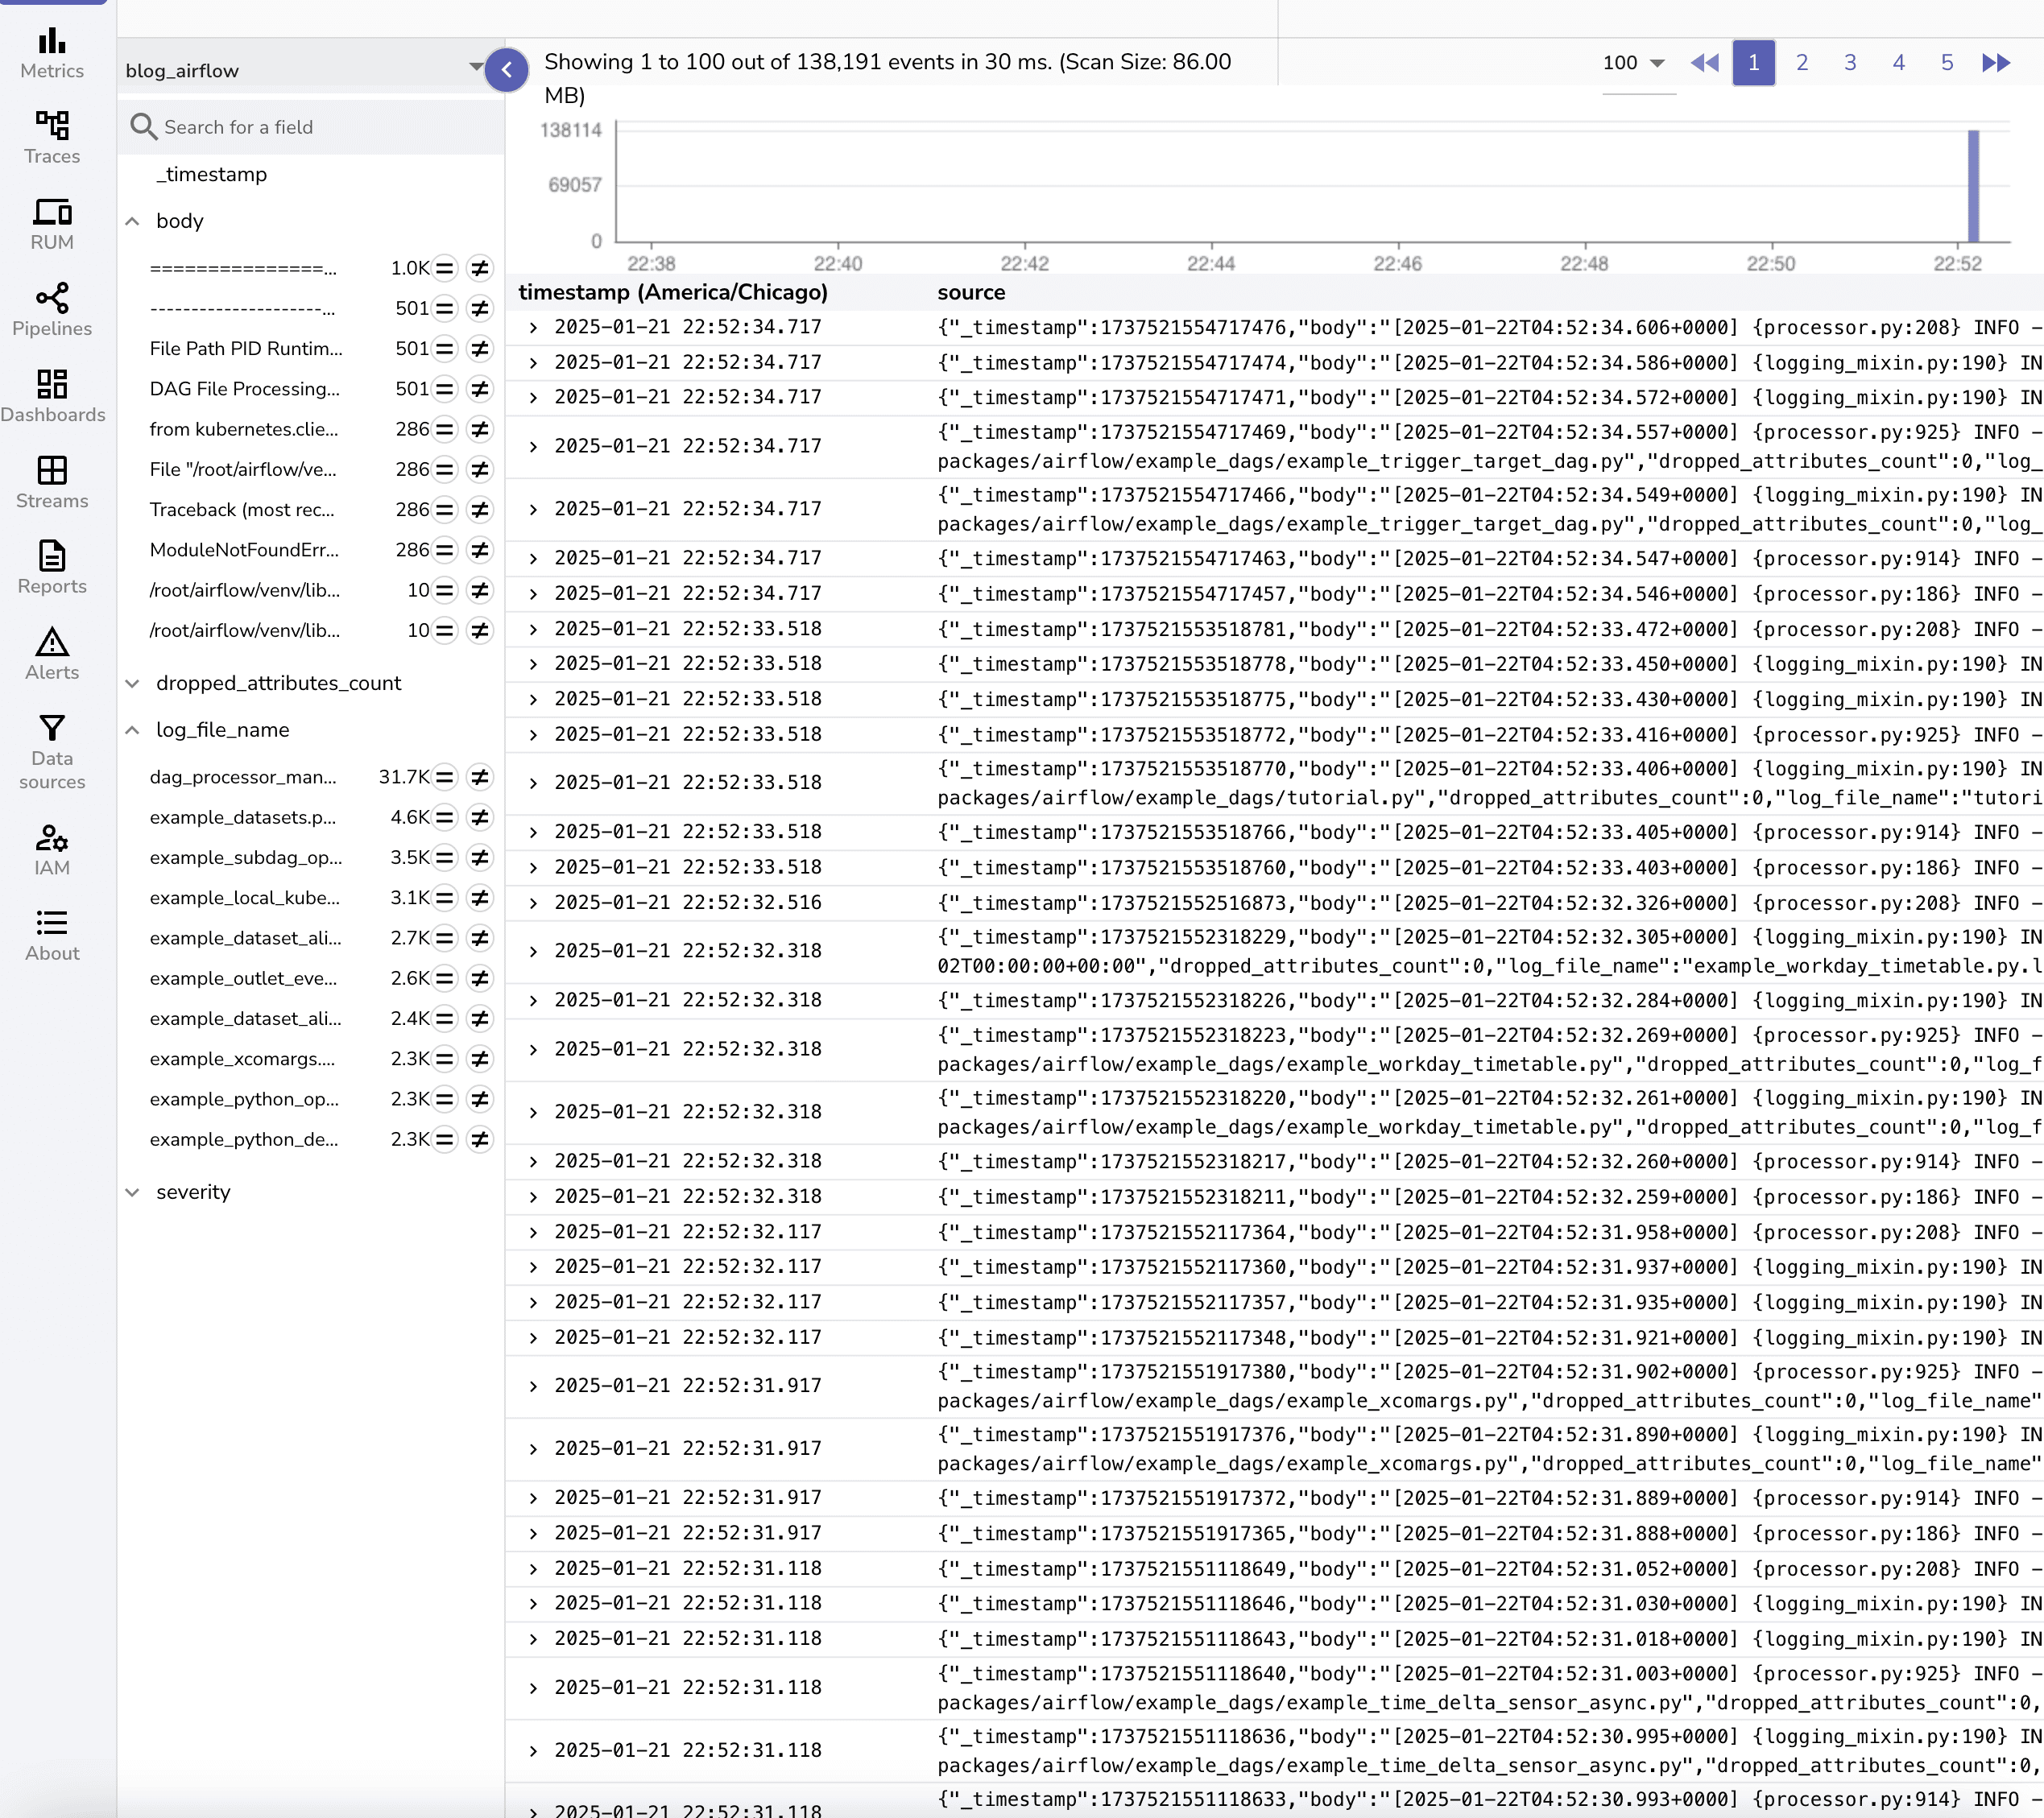
Once the OpenTelemetry Collector is running, it starts ingesting logs from:
To view logs in OpenObserve, navigate to the logs section and select blog_query:
Pre-built dashboards for Airflow are available at: OpenObserve Airflow Dashboards
 These dashboards provide:
To import a dashboard into OpenObserve:
Monitoring Airflow logs and metrics is crucial for maintaining workflow health and debugging failures. By integrating OpenTelemetry and OpenObserve, you can:
This setup provides a scalable observability solution for Apache Airflow, ensuring efficient workflow automation and monitoring.
Chaitanya Sistla is a Principal Solutions Architect with 17X certifications across Cloud, Data, DevOps, and Cybersecurity. Leveraging extensive startup experience and a focus on MLOps, Chaitanya excels at designing scalable, innovative solutions that drive operational excellence and business transformation.


