AWS ALB Logs Monitoring: Complete Setup and Real-Time Insights


Try OpenObserve Cloud today for more efficient and performant observability.
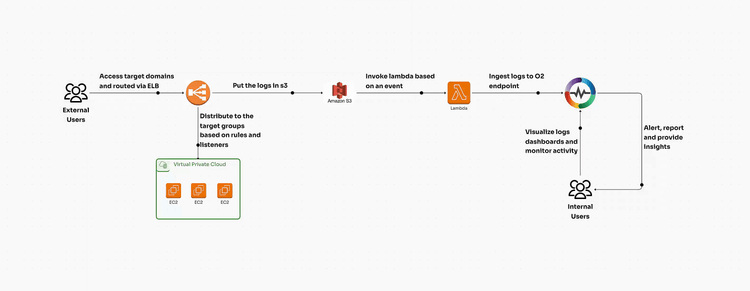
AWS Application Load Balancer (ALB) is a fully managed service provided by Amazon Web Services (AWS) that automatically distributes incoming application traffic across multiple targets, such as EC2 instances, containers, and IP addresses. It operates at the application layer (Layer 7 of the OSI model) and provides advanced request routing capabilities based on HTTP/HTTPS headers, paths, and hostnames. ALB also supports WebSockets, gRPC, and enhanced security features, making it a preferred choice for modern applications.
Key features of AWS ALB:
Monitoring AWS ALB logs is critical for several reasons:
Traffic Analysis
Security & Compliance
Performance Optimization
Cost Management
Before you begin setting up AWS ALB log monitoring, ensure you have the following:
AWS provides an automated way to configure ALB log ingestion using a CloudFormation template. Download the pre-built template from: https://github.com/openobserve/cloudformation-templates/blob/main/aws_alb/alb.yaml
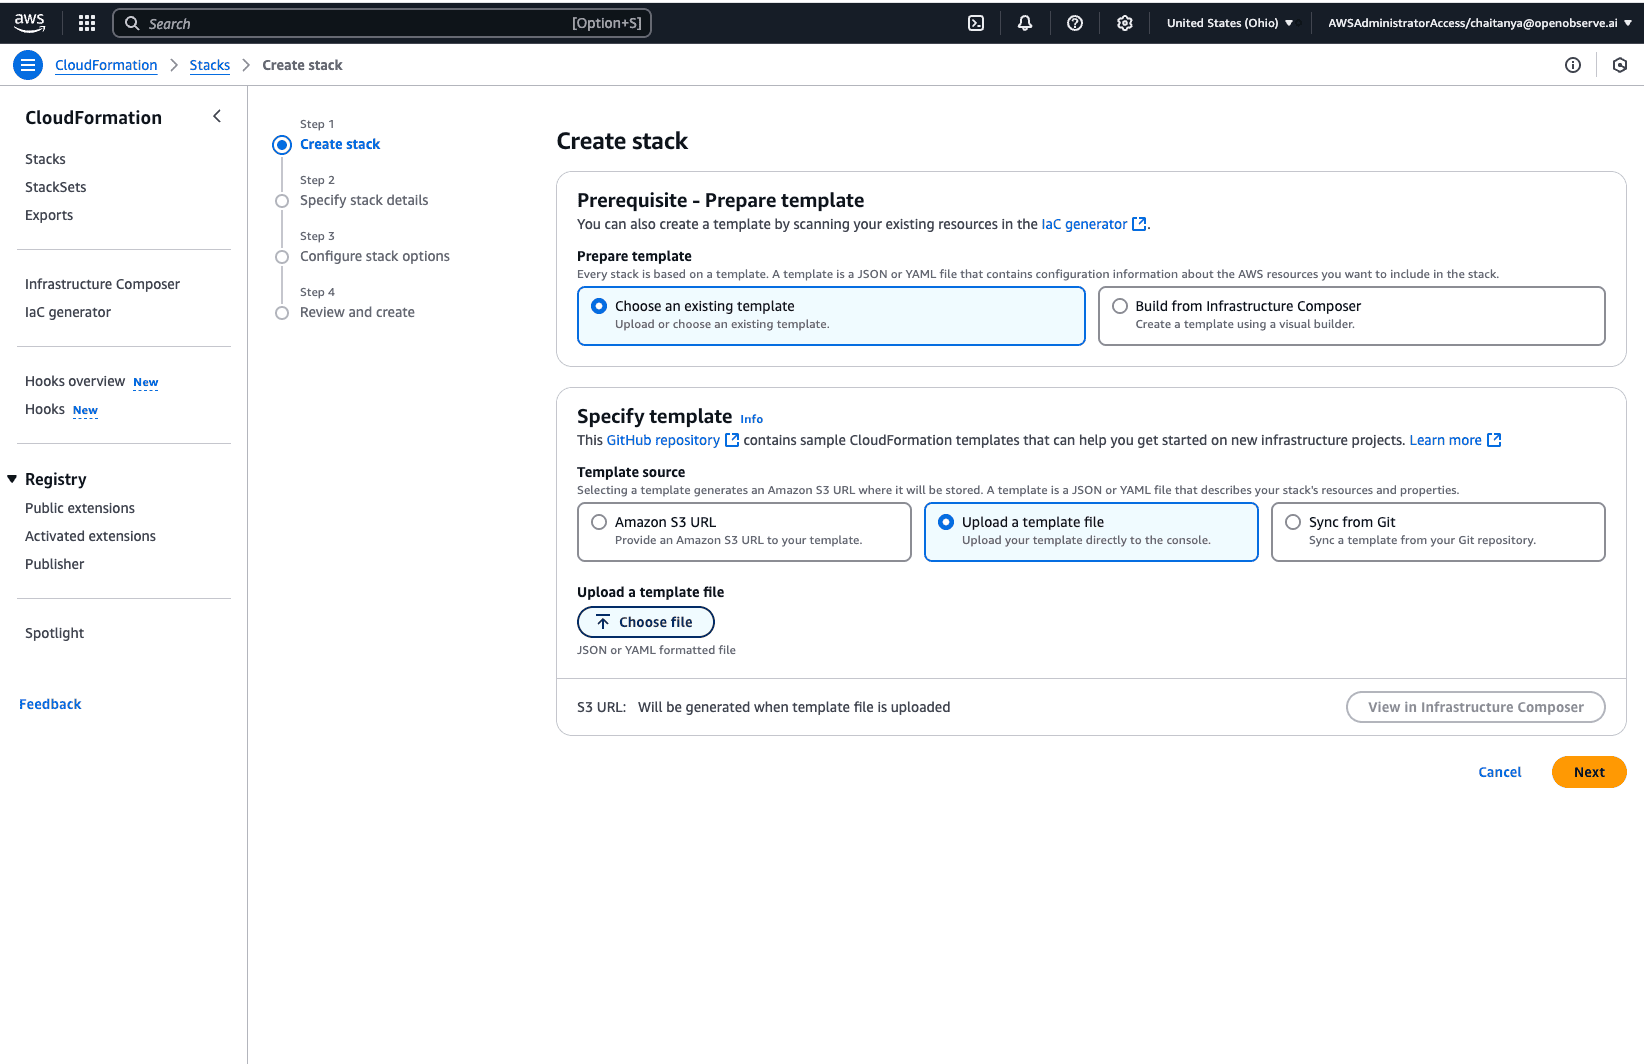
alb.yaml template.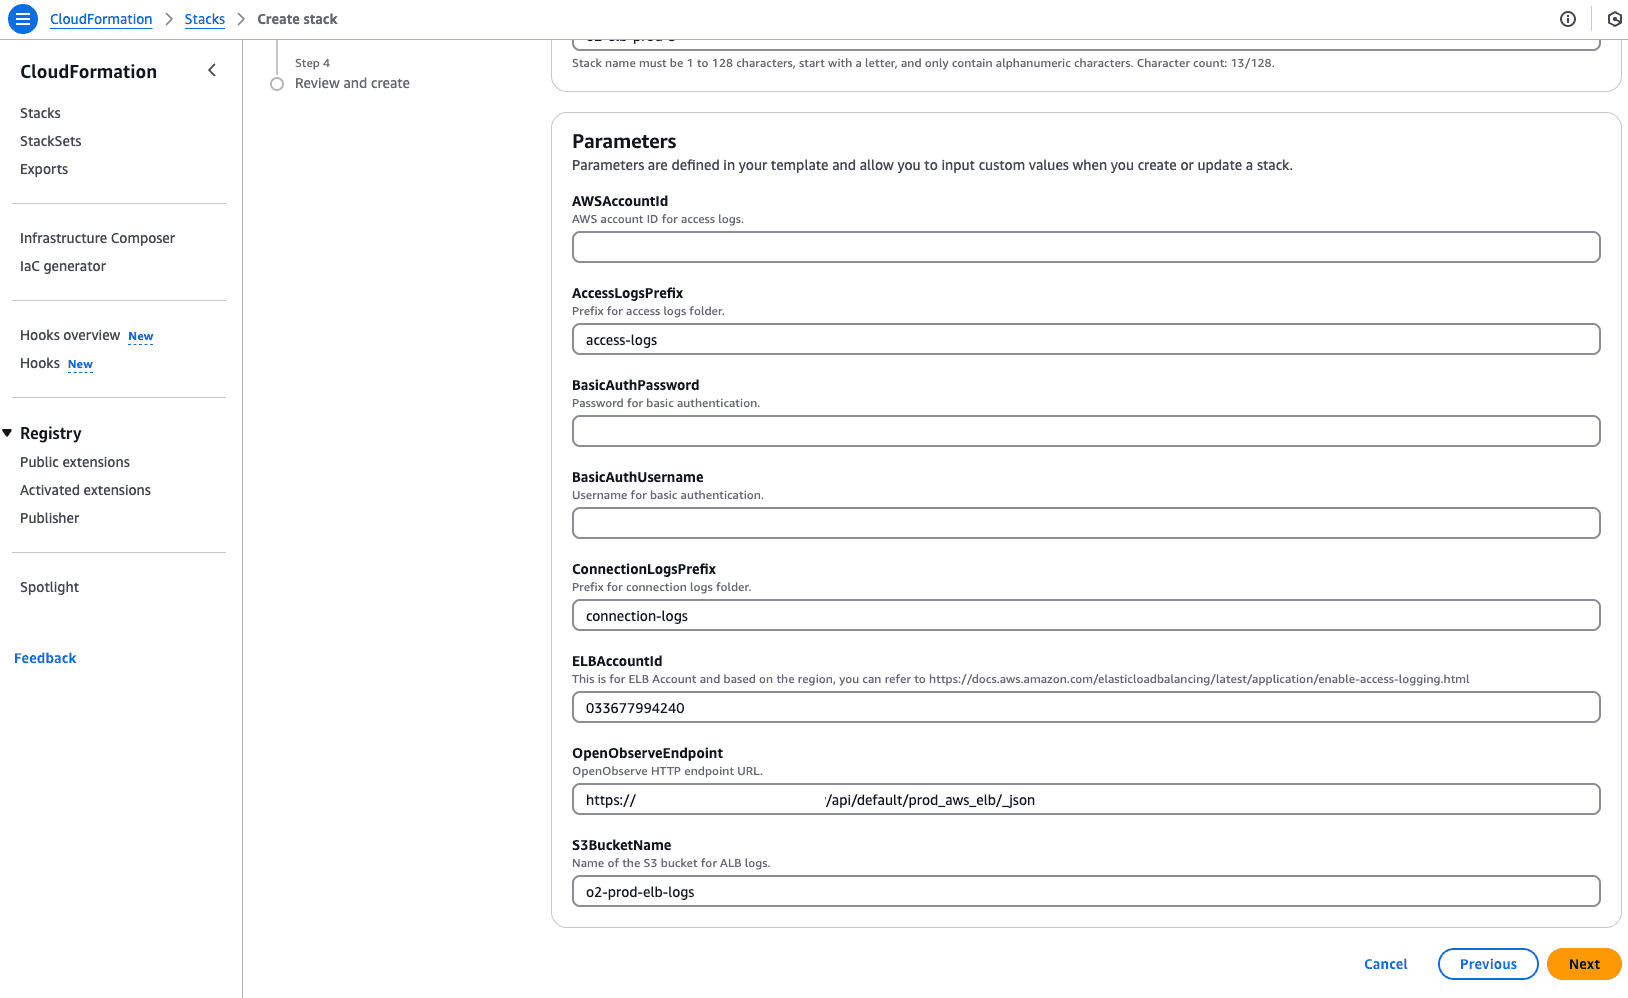
CREATE_COMPLETE.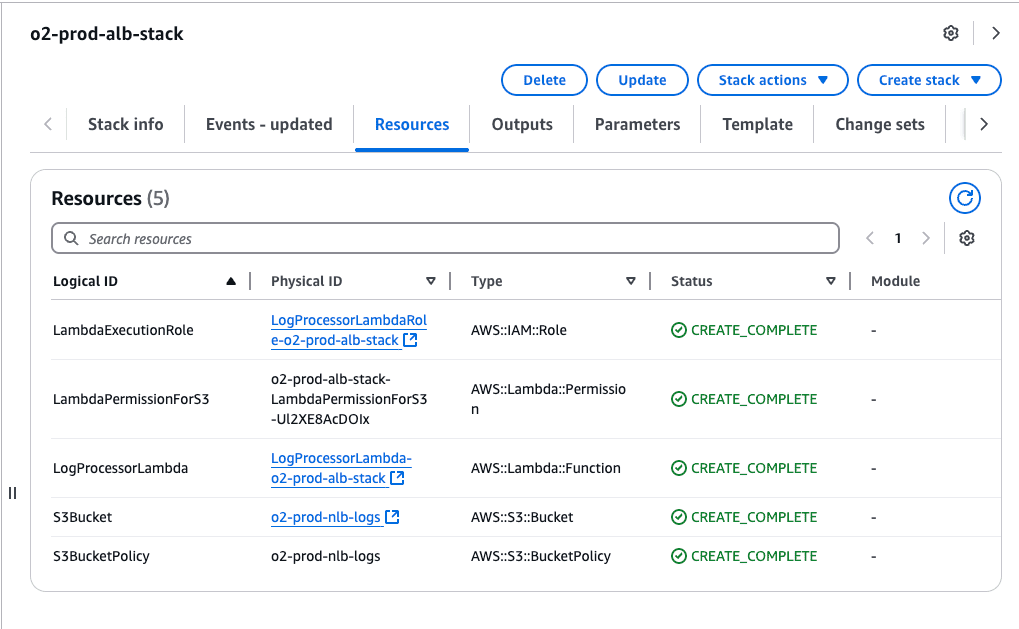
Once the S3 bucket is created via CloudFormation:
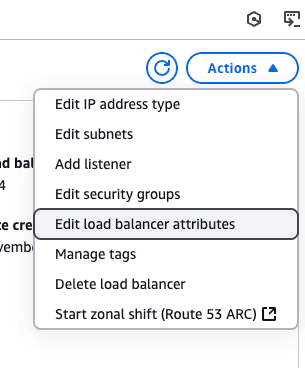
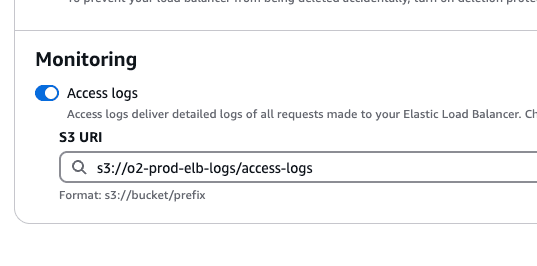
Once logs are flowing to the S3 bucket, the lambda function will be invoked and start ingesting the logs to OpenObserve endpoint.
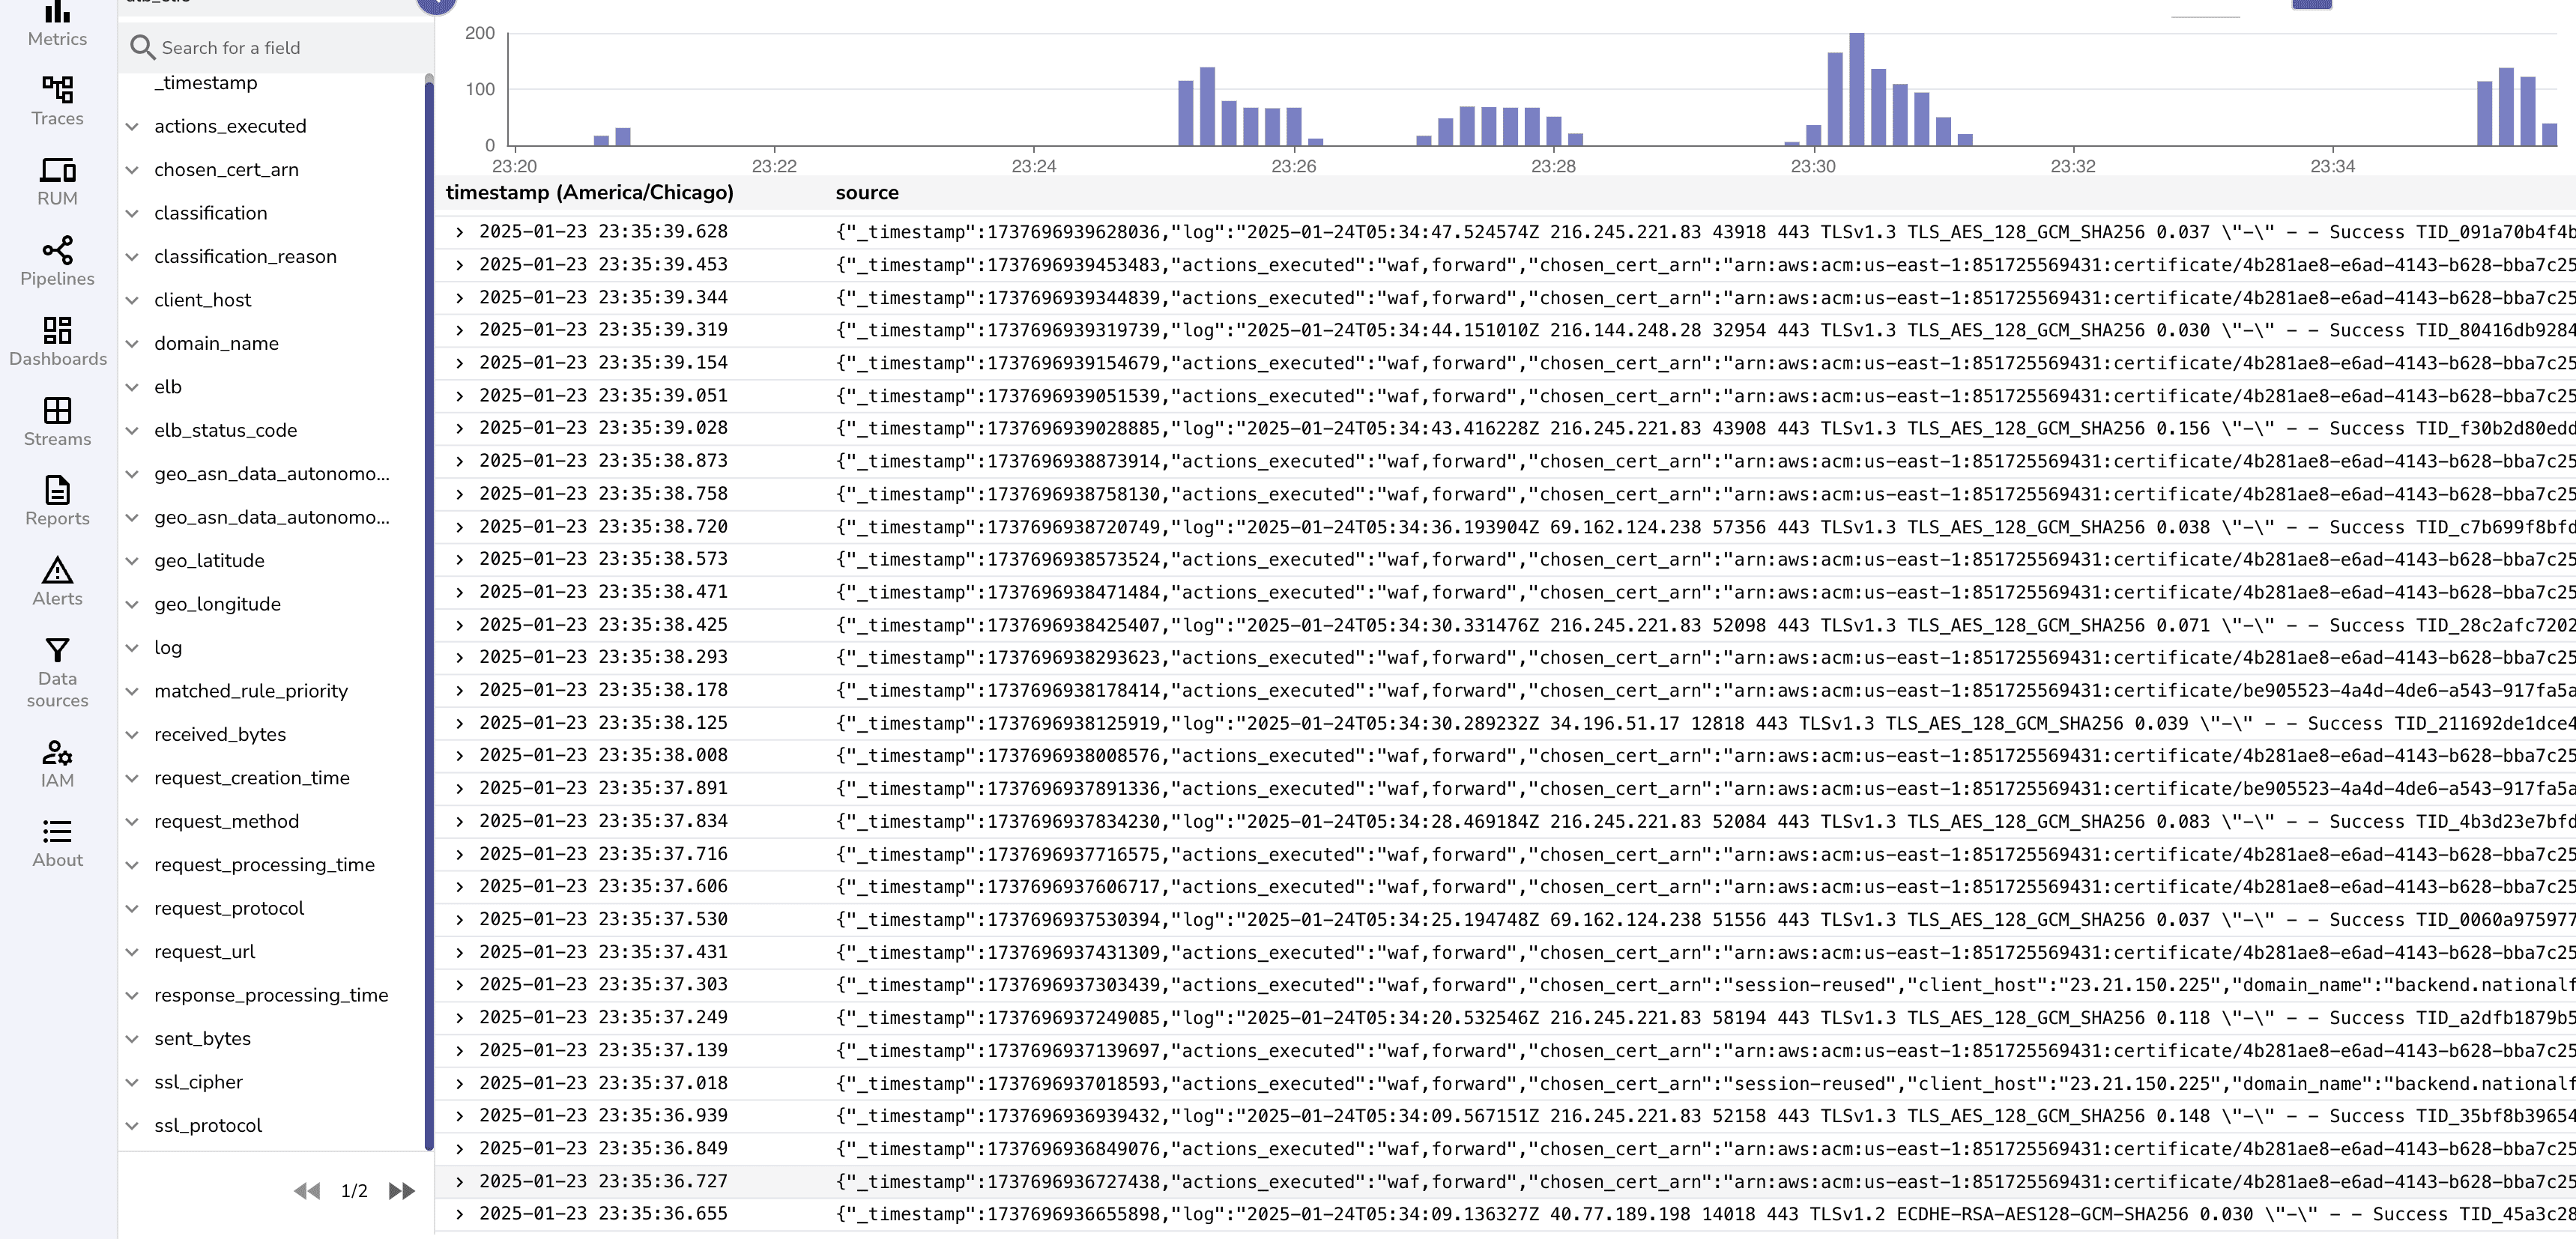
By default ALB logs are unstructured and are ingested as below.
"http 2018-11-30T22:23:00.186641Z app/my-loadbalancer/50dc6c495c0c9188 192.168.131.39:2817 - 0.000 0.001 0.000 200 200 34 366 \"GET http://www.example.com:80/ HTTP/1.1\" \"curl/7.46.0\" - - arn:aws:elasticloadbalancing:us-east-2:123456789012:targetgroup/my-targets/73e2d6bc24d8a067 \"Root=1-58337364-23a8c76965a2ef7629b185e3\" \"-\" \"-\" 0 2018-11-30T22:22:48.364000Z \"forward\" \"-\" \"-\" \"-\" \"-\" \"-\" \"-\""
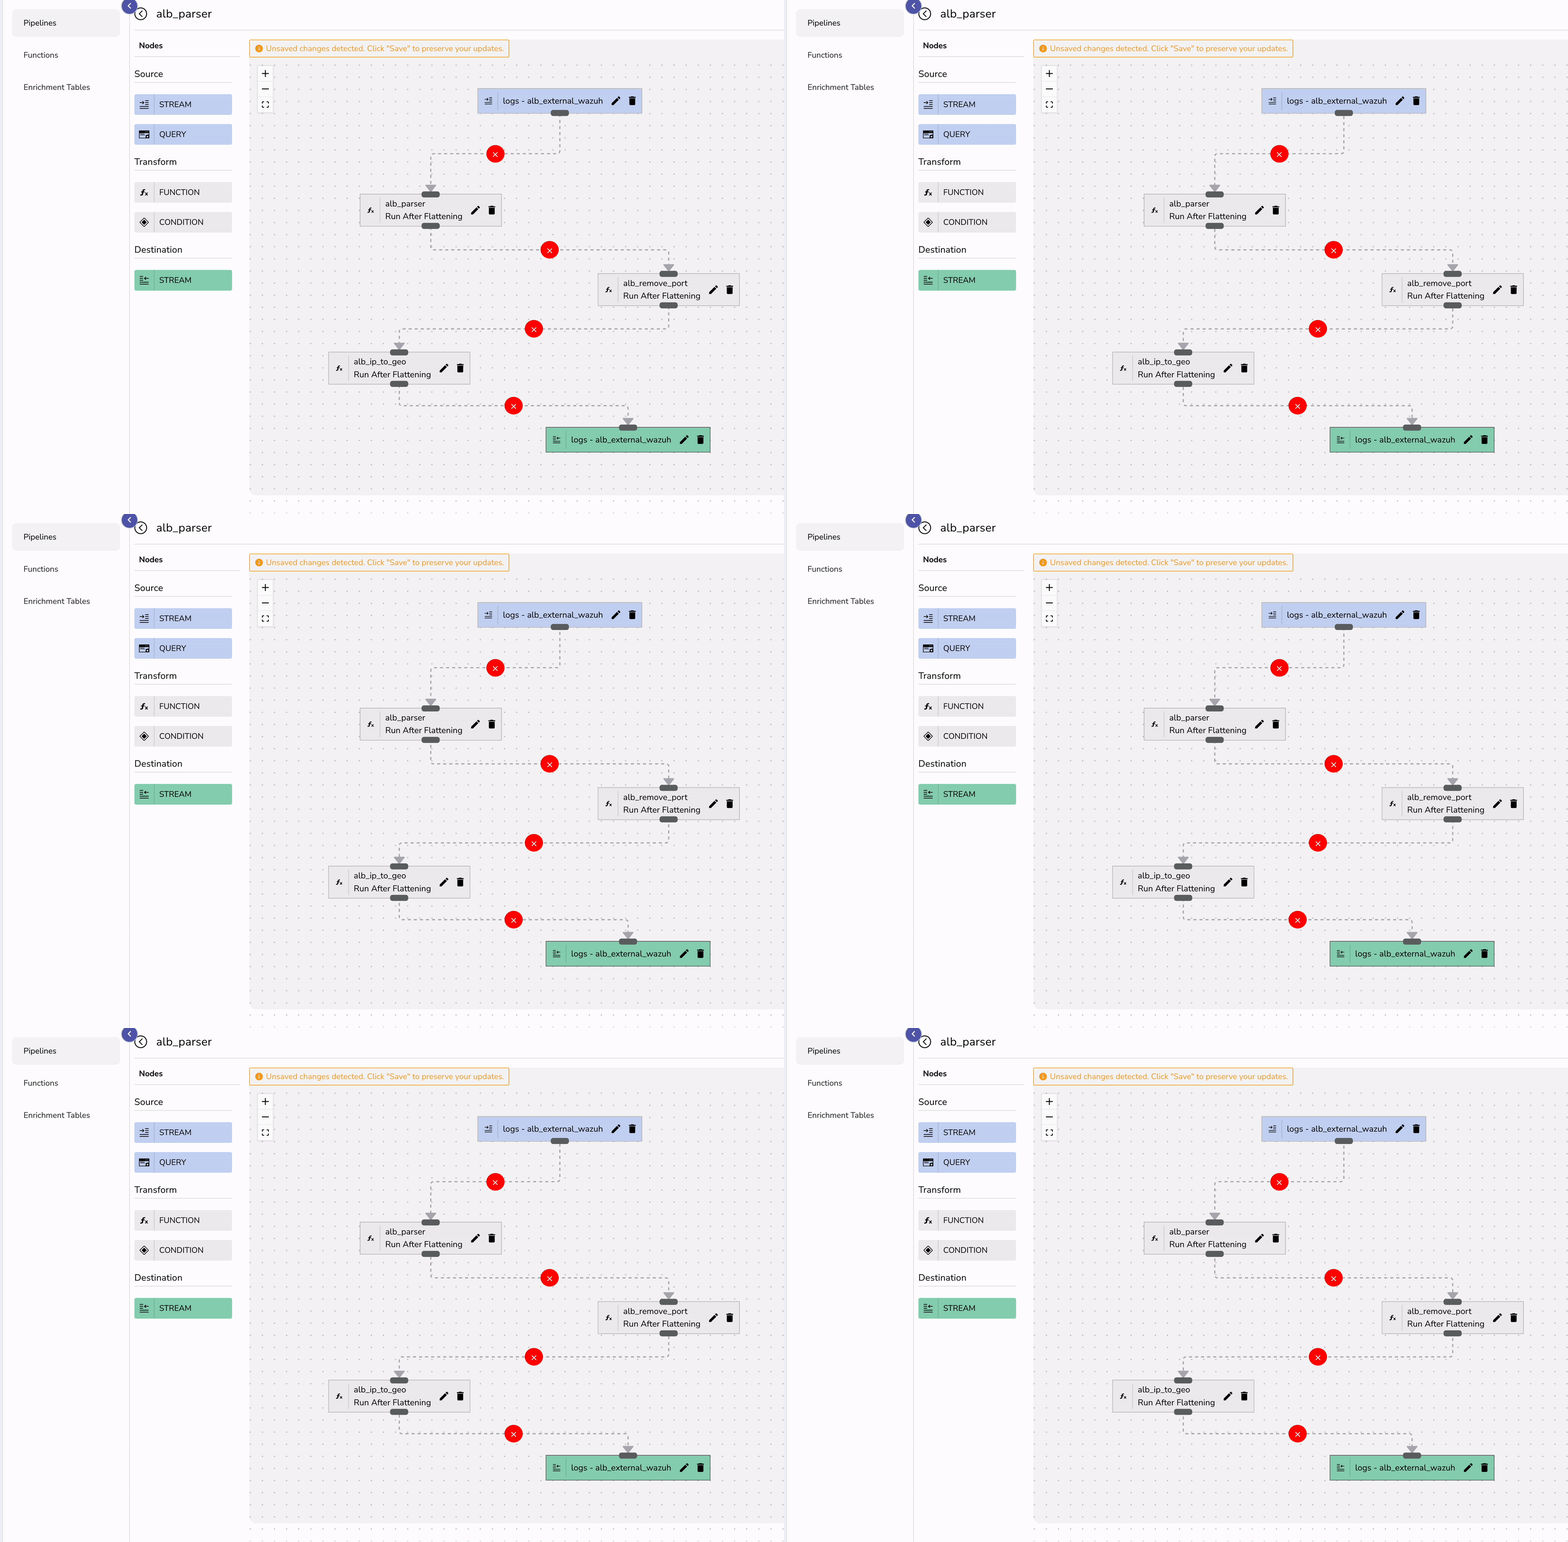
To enhance log analysis, add three VRL (Vector Remap Language) functions in OpenObserve for parsing:
VRL supports parse_aws_alb_log that helps transform the logs.
. = parse_aws_alb_log!(.log)
 .
.client_host = split!(.client_host, ":")[0]
 .
if exists(.client_host) && (is_ipv4(string!(.client_host)) || is_ipv6(string!(.client_host))) {
    .geo_city_data = get_enrichment_table_record!("maxmind_city", {"ip": string!(.client_host)})
    if exists(.geo_city_data) {
        .geo_city = .geo_city_data.city
        .geo_country = .geo_city_data.country
        .geo_latitude = .geo_city_data.latitude
        .geo_longitude = .geo_city_data.longitude
    }
    .geo_asn_data = get_enrichment_table_record!("maxmind_asn", {"ip": string!(.client_host)})

    if exists(.geo_asn_data) {
        .geo_asn = .geo_asn_data.asn
        .geo_org = .geo_asn_data.organization
    }
}
 .
Finally create a pipeline that can transform your logs in real-time.
To visualize ALB logs effectively:
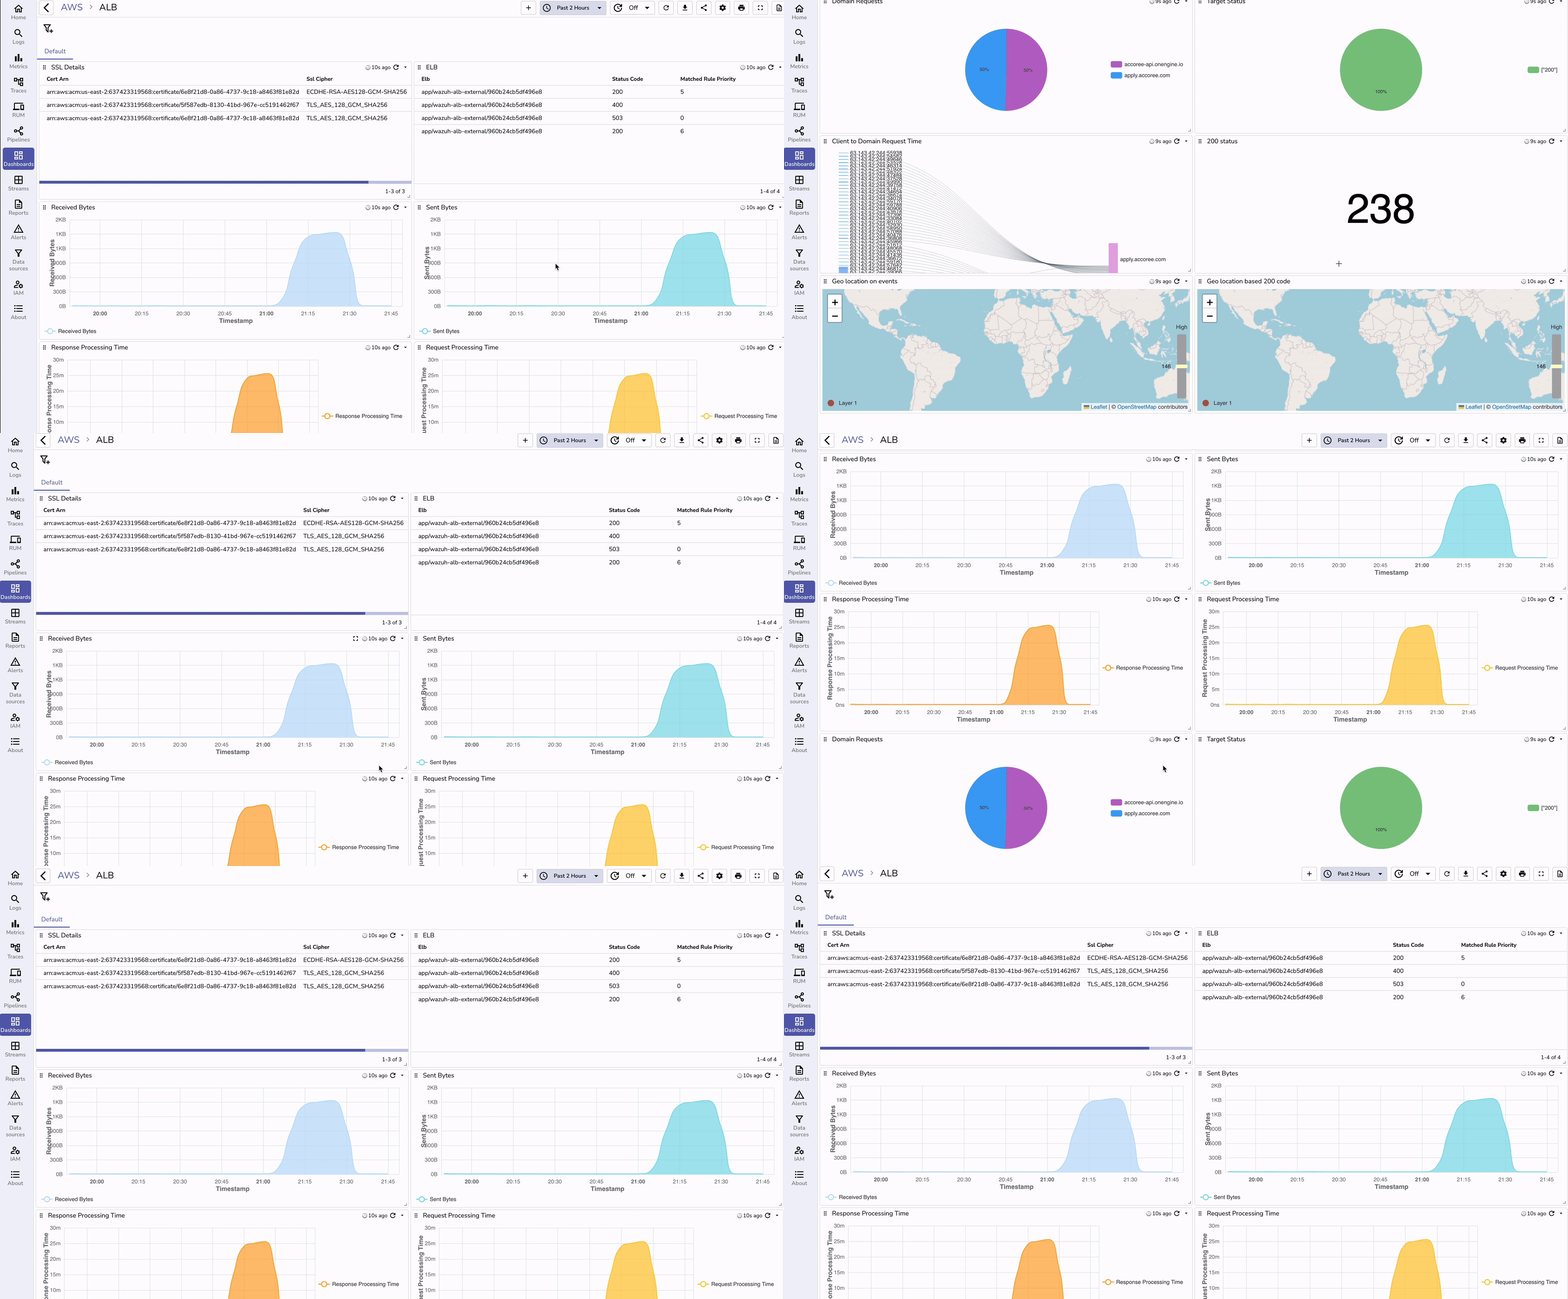
To understand the benefits of using OpenObserve for ALB log monitoring, let’s compare it with traditional methods:
| Feature | Without OpenObserve | With OpenObserve |
|---|---|---|
| Log Storage | Logs stored in S3, requiring additional processing | Real-time log ingestion with query capabilities |
| Data Parsing | Requires custom scripts to parse logs | Prebuilt VRL functions simplify parsing |
| Visualization | Needs third-party tools (e.g., Kibana, Grafana) | Built-in dashboards for instant insights |
| Alerting | No built-in alerting; needs external setup | Real-time alerts on anomalies |
Monitoring AWS ALB logs is crucial for security, performance optimization, and compliance. Traditional log monitoring methods often involve complex setups and additional tools for parsing and visualization. However, with OpenObserve, organizations can streamline log ingestion, parsing, and visualization in real time, reducing complexity and improving insights.
By leveraging CloudFormation templates, VRL functions, and pre-built dashboards, teams can efficiently monitor AWS ALB logs, ensuring high availability and proactive issue detection. Setting up AWS ALB log monitoring with OpenObserve takes just minutes but provides long-term benefits in operational efficiency, security, and cost optimization.

Chaitanya Sistla is a Principal Solutions Architect with 17X certifications across Cloud, Data, DevOps, and Cybersecurity. Leveraging extensive startup experience and a focus on MLOps, Chaitanya excels at designing scalable, innovative solutions that drive operational excellence and business transformation.