Error Handling With Opentelemetry Python SDK: A Step-by-Step Guide

Manas Sharma
November 13, 2024
5 min read
Don’t forget to share!
Try OpenObserve Cloud today for more efficient and performant observability.
Get Started For Free
Error handling is a fundamental aspect of robust software development. However, the concept of errors and exceptions varies significantly across programming languages. For instance, languages like Java and Python provide built-in support for exceptions, while Go discourages their use, treating errors as ordinary issues. This disparity poses challenges when developing microservices in multiple languages. Each language's unique error handling mechanisms complicate unified telemetry and error reporting.
OpenTelemetry (OTel) stands out as a powerful open-source tool that brings all these observability signals together in a standardized, vendor-neutral way. Managed by the Cloud Native Computing Foundation (CNCF), OpenTelemetry provides an observability framework that supports seamless tracking, monitoring, and troubleshooting of distributed applications across various languages and platforms.
In this blog, we’ll take a deep dive into the OpenTelemetry Python and focus on its Global Error Handler, which provides a structured way to manage and log exceptions in Python applications.
OpenTelemetry (OTel) standardizes telemetry data collection, processing, and export across distributed services. Its open-source, vendor-neutral framework supports multiple languages, simplifying observability.
This powerful combination enhances error handling, performance monitoring, and application reliability.
In OpenTelemetry Python, the Global Error Handler provides a mechanism to capture and handle exceptions across our application in a consistent and reliable manner. Unhandled exceptions are caught by a default handler, ensuring that the application flow remains uninterrupted.
To create a custom error handler, we can extend the ErrorHandler class. Here’s an example for handling ZeroDivisionError:
from opentelemetry.sdk.error_handler import ErrorHandler
from logging import getLogger

logger = getLogger(__name__)

class ZeroDivisionErrorHandler(ErrorHandler, ZeroDivisionError):
    def handle(self, error: Exception, *args, **kwargs):
        logger.exception("Handled ZeroDivisionError: %s", error)
ZeroDivisionErrorHandler class inherits from both ErrorHandler and ZeroDivisionError.handle method defines how errors are logged and processed.opentelemetry_error_handler entry points.To integrate the custom error handler, we wrap our code within the GlobalErrorHandler context manager:
from opentelemetry.sdk.error_handler import GlobalErrorHandler

with GlobalErrorHandler():
    1 / 0  # Example where ZeroDivisionError is handled
The GlobalErrorHandler automatically catches and processes the ZeroDivisionError using the custom handler.
mkdir global_error_handler
cd global_error_handler
python -m venv global_error_handler
source global_error_handler/bin/activate
global_error_handler\Scripts\activate
Install the OpenTelemetry SDK:
pip install opentelemetry-sdk
Clone the OpenTelemetry repository:
git clone https://github.com/open-telemetry/opentelemetry-python.git
Install error handlers:
pip install -e opentelemetry-python/docs/examples/error_handler/error_handler_0
pip install -e opentelemetry-python/docs/examples/error_handler/error_handler_1
example.py)from opentelemetry.sdk.error_handler import GlobalErrorHandler
# ZeroDivisionError handling
with GlobalErrorHandler():
1 / 0
print()
# IndexError handling
with GlobalErrorHandler():
[1][2]
print()
# KeyError handling
with GlobalErrorHandler():
{1: 2}[2]
print()
# Default error handling (AssertionError)
with GlobalErrorHandler():
assert False
print()
# No error scenario
with GlobalErrorHandler():
print("No error raised")
Run the example.py script, you should get output similar to this one:
ErrorHandler0 handling a ZeroDivisionError
Traceback (most recent call last):
  File "test.py", line 5, in <module>
    1 / 0
ZeroDivisionError: division by zero

ErrorHandler1 handling an IndexError
Traceback (most recent call last):
  File "test.py", line 11, in <module>
    [1][2]
IndexError: list index out of range

ErrorHandler1 handling a KeyError
Traceback (most recent call last):
  File "test.py", line 17, in <module>
    {1: 2}[2]
KeyError: 2

Error handled by default error handler:
Traceback (most recent call last):
  File "test.py", line 23, in <module>
    assert False
AssertionError

No error raised
OpenTelemetry's GlobalErrorHandler employs a centralized exception management system.
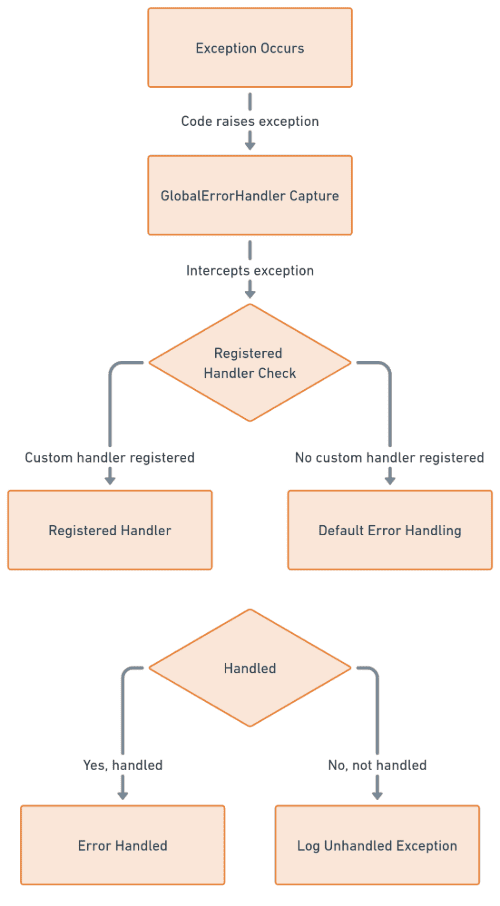
GlobalErrorHandler intercepts exceptions raised within its context.opentelemetry_error_handler entry points.GlobalErrorHandler routes captured exceptions to registered handlers.Inherit from opentelemetry.sdk.error_handler.ErrorHandler.
Implement exception-specific handling logic.
Register handlers in python code:
[options.entry_points]
opentelemetry_error_handler =
    error_handler_0 = error_handler_0:ErrorHandler0
This entry point should point to the error handler class, ErrorHandler0 in this case.
Mastering OpenTelemetry's Global Error Handler revolutionizes error and exception management. Key takeaways include:
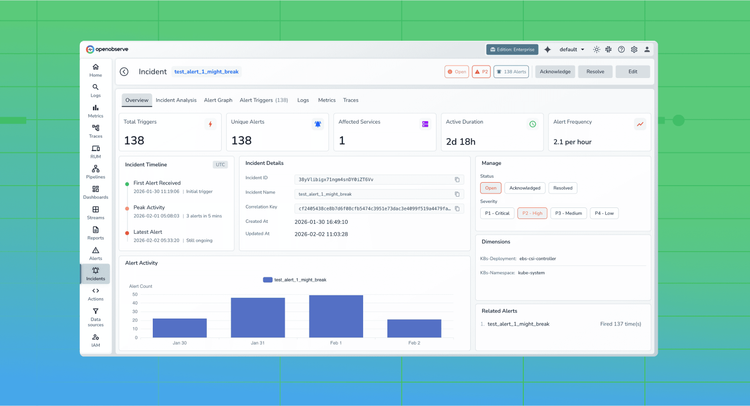
Next, integrate OpenTelemetry with OpenObserve to visualize error data, uncovering patterns and areas for optimization. Leverage OpenObserve's capabilities to streamline error analysis and amplify application reliability.
Happy Monitoring! 🚀
Manas is a passionate Dev and Cloud Advocate with a strong focus on cloud-native technologies, including observability, cloud, kubernetes, and opensource. building bridges between tech and community.