Explore latest insights and updates
Send logs from Google Cloud Run to OpenObserve for fast search, longer retention, and lower costs, and using just a few lines of code.
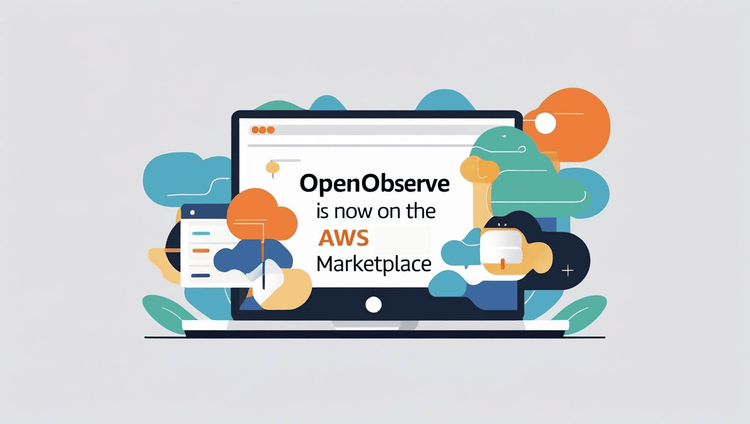
OpenObserve is now available on AWS Marketplace! Discover how teams can streamline observability with faster deployment, simplified billing, and seamless integration within their AWS infrastructure.
Efficient log parsing with OpenObserve unlocks real-time analytics, troubleshooting, and alerting through VRL, flexible pipelines, and seamless ingestion.
How to send data from OpenObserve Pipelines to Splunk using the Splunk HTTP Event Collector (HEC) in 5 easy steps.
Avatar achieved SOC 2 compliance, improved uptime to 99.99%, and saved 60% on observability costs with OpenObserve's unified monitoring platform.
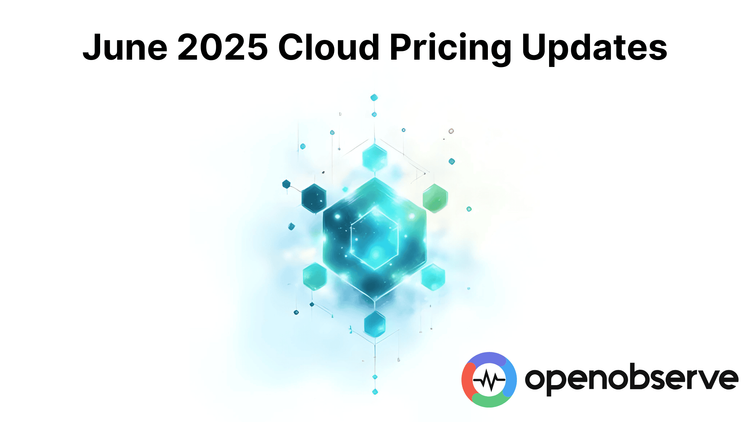
OpenObserve is transitioning to a fully usage-based pricing model effective June 2nd, 2025, eliminating minimum fees and the free tier. The new pay-as-you-go structure charges $0.30 per GB for log, metric, and trace ingestion, with additional fees for queries, pipelines, and advanced features like RUM and error tracking. Existing free-tier customers receive a 30-day exemption period, while current standard-tier customers will have their flat monthly fees removed after 30 days. New customers can access a 14-day free trial. The company emphasizes that their open-source version remains completely free for self-hosting, providing users with flexibility to choose between managed cloud services or self-managed deployments. This pricing change aims to create a more transparent, scalable cost structure that aligns charges with actual resource consumption while supporting OpenObserve's continued development and platform improvements.Description - OpenObserve announces usage-based pricing starting June 2025. Free tier ends, pay-as-you-go begins at $0.30/GB ingestion. 30-day transition period for existing users. Self-hosting remains free.
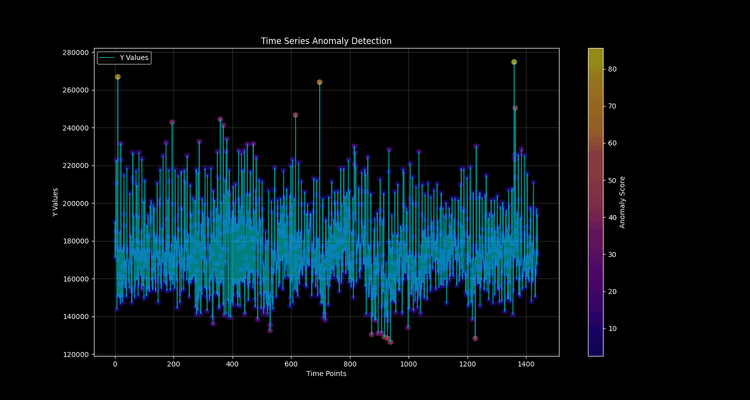
This comprehensive guide explains how to implement real-time anomaly detection using OpenObserve and the Random Cut Forest algorithm for time series data. Learn what anomaly detection is, how OpenObserve streamlines monitoring, and step-by-step instructions for setting up a robust anomaly detection system. Discover common challenges, troubleshooting tips, and best practices for scalable, cost-effective anomaly detection solutions.
Deploy OpenObserve on Heroku without DevOps complexity. Get logs, metrics, and traces monitoring running in minutes with our comprehensive deployment guide.
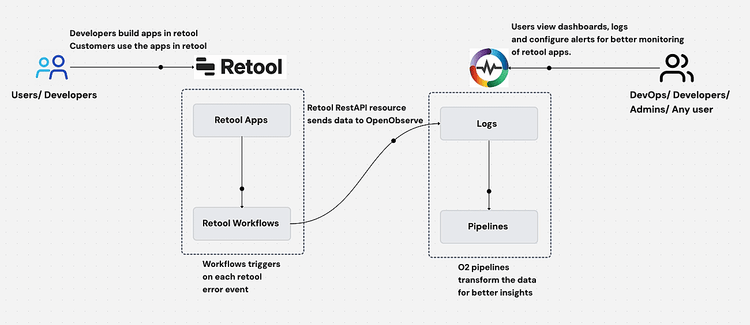
Learn how to implement enterprise-grade error monitoring and observability for Retool applications. Compare native monitoring vs OpenObserve, setup workflows, configure dashboards, and establish best practices for tracking Retool app errors.
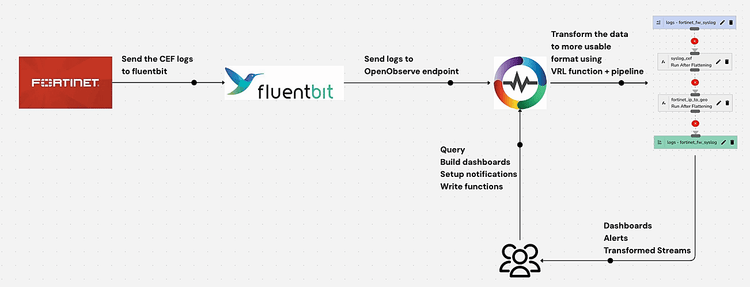
Learn how to monitor Fortinet firewalls using OpenObserve. Step-by-step guide for syslog setup, log transformation, and creating dashboards for real-time security monitoring.
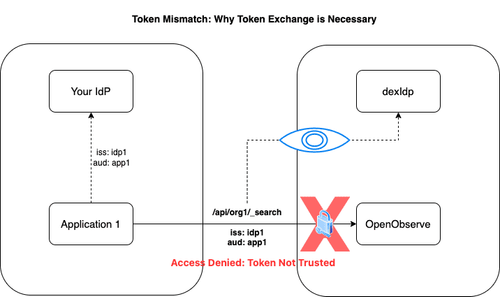
Discover OpenObserve’s Service Accounts feature, designed for secure programmatic access to APIs. Learn how token exchange enhances security and simplifies automation.
OpenObserve has just surpassed 15,000 stars on GitHub, a milestone that fills me with both pride and gratitude. When we started this project three years ago, the goal was simple yet ambitious: to build an open-source observability platform that is easier, faster, and dramatically more cost-effective than anything out there.
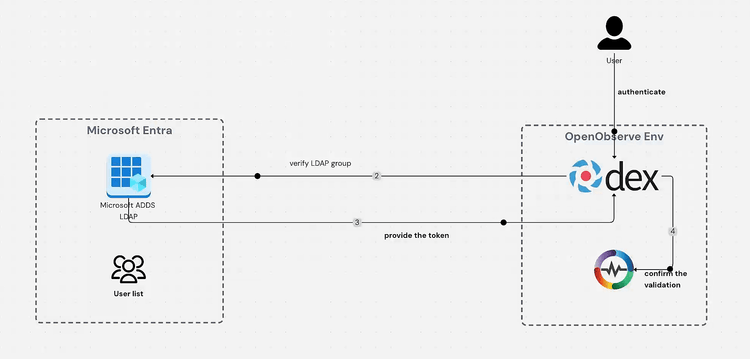
Learn how to securely integrate Microsoft Active Directory Domain Services (ADDS) LDAP with OpenObserve and Dex. This step-by-step guide covers authentication configuration, troubleshooting tips, and best practices for enterprise observability solutions.
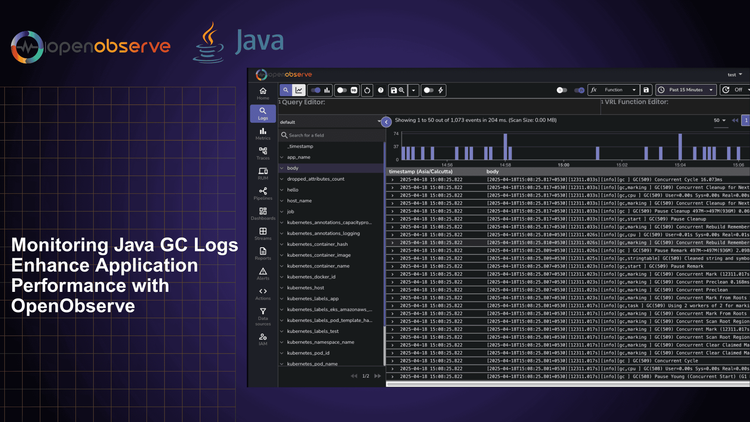
Learn how to leverage Java GC logs to diagnose memory issues, optimize application performance, and prevent production outages. This guide explains how to interpret GC log patterns and use OpenObserve for practical monitoring and analysis.
Learn how to implement effective SNMP monitoring using OpenTelemetry and OpenObserve. Monitor network devices, servers, and infrastructure with real-time insights and improved troubleshooting.
Unlock the full potential of your ArgoCD deployments with Prometheus and OpenObserve monitoring. Get real-time insights into application health, sync status, and reconciliation performance.
Monitor Linux systems with OpenObserve. Learn how to collect and analyze system logs, metrics, and security events for improved system visibility, troubleshooting, and compliance. Get insights into performance monitoring and security with OpenObserve.
Set up comprehensive Windows monitoring with OpenObserve. Collect, analyze, and visualize event logs, performance metrics, and security events for enhanced troubleshooting and system visibility.
Learn how to capture and analyze Amazon EKS Fargate logs using AWS's built-in Fluent Bit log router, Kinesis Firehose, and OpenObserve for comprehensive container monitoring.
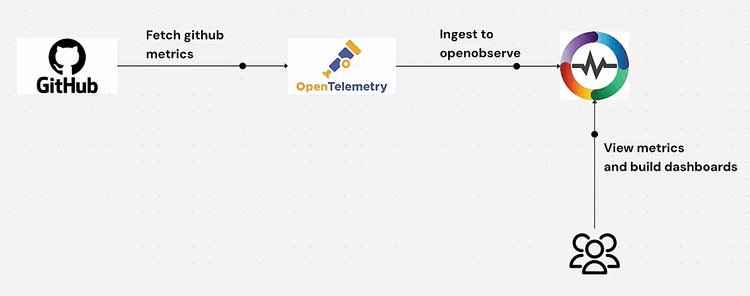
Learn how to set up real-time GitHub metrics monitoring using OpenTelemetry Collector and OpenObserve. This step-by-step guide covers installation, configuration, and visualization of repository analytics, PR metrics, and contributor statistics. Perfect for DevOps teams looking to gain deeper insights into their development workflows and improve productivity with data-driven decisions.
Learn how to monitor Docker container metrics using OpenTelemetry and OpenObserve. Collect CPU, memory, network, and disk metrics without modifying your applications.