TypeScript Distributed Tracing - OpenTelemetry APM
Setup distributed tracing for your Node.js TypeScript application using OpenTelemetry for TypeScript application performance monitoring (APM) and trace ingestion. Check sample configuration on how to setup OpenTelemetry traces for TypeScript applications.
Clone
If you don't have node.js installed, please install it and then follow below steps.
Open tracing.ts file from that repository. and make changes to the highlighted lines below and make changes to the highlighted lines below.
Setup up credentials
You will get url and Authorization key here.
Replace the url and Authorization key in the tracing.js file.
Setup Service/Application
Follow the steps given in the sample-tracing-nodejs-typescript readme and then start server
The server is now running on 8080, navigate to http://localhost:8080 Refresh page couple of times to get more traces exported.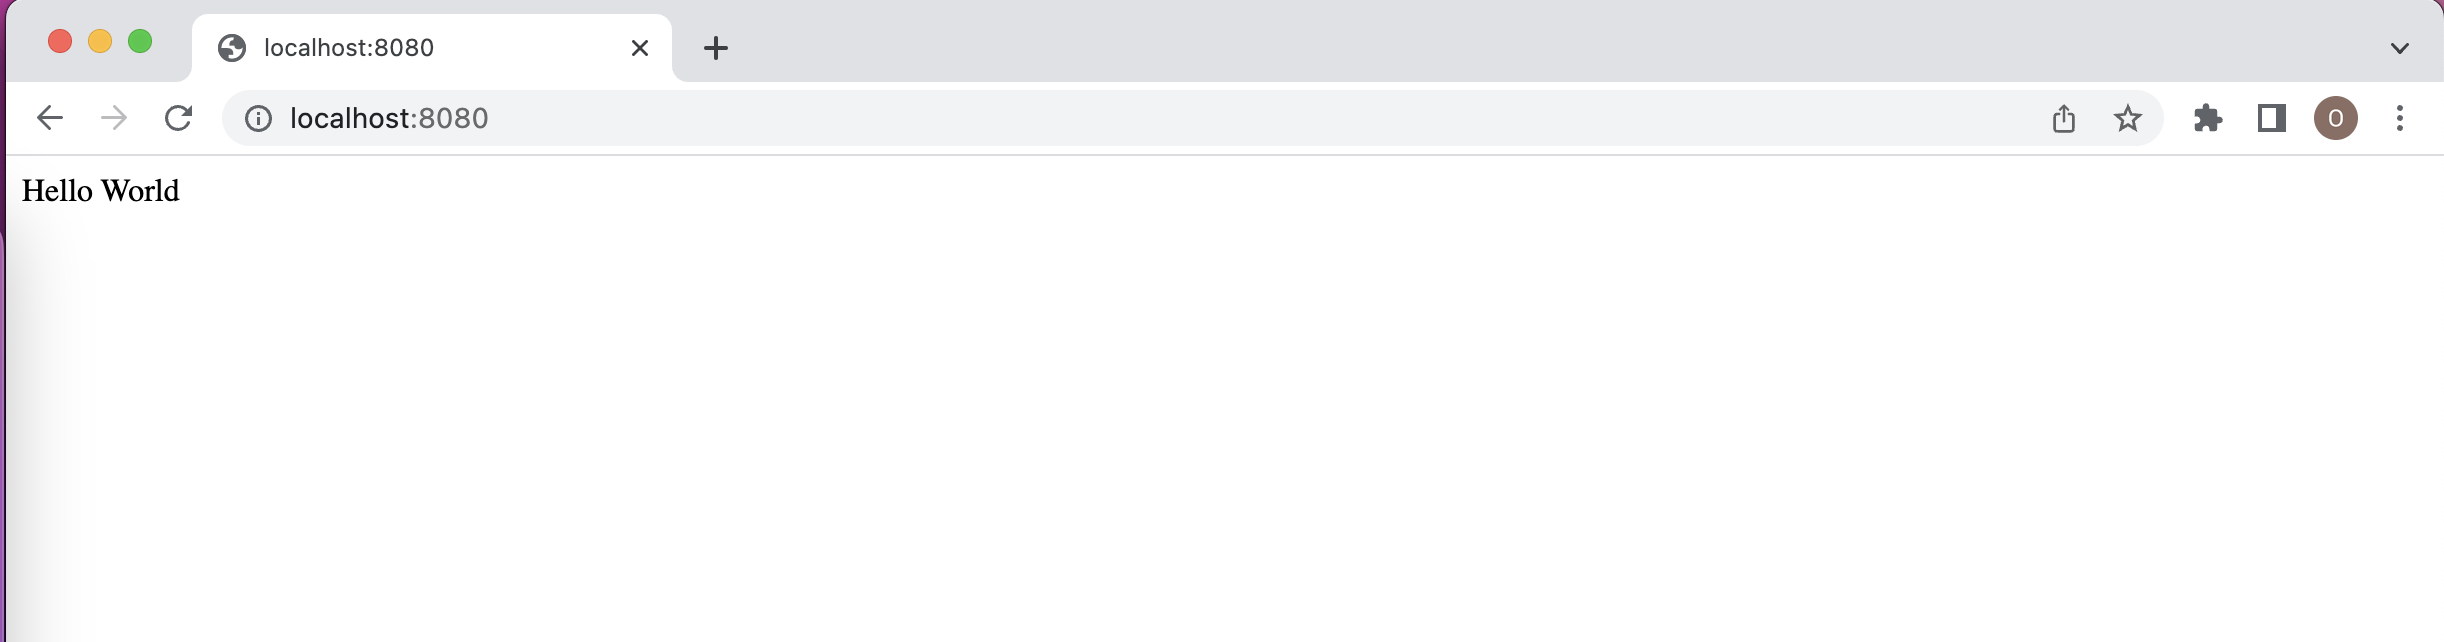
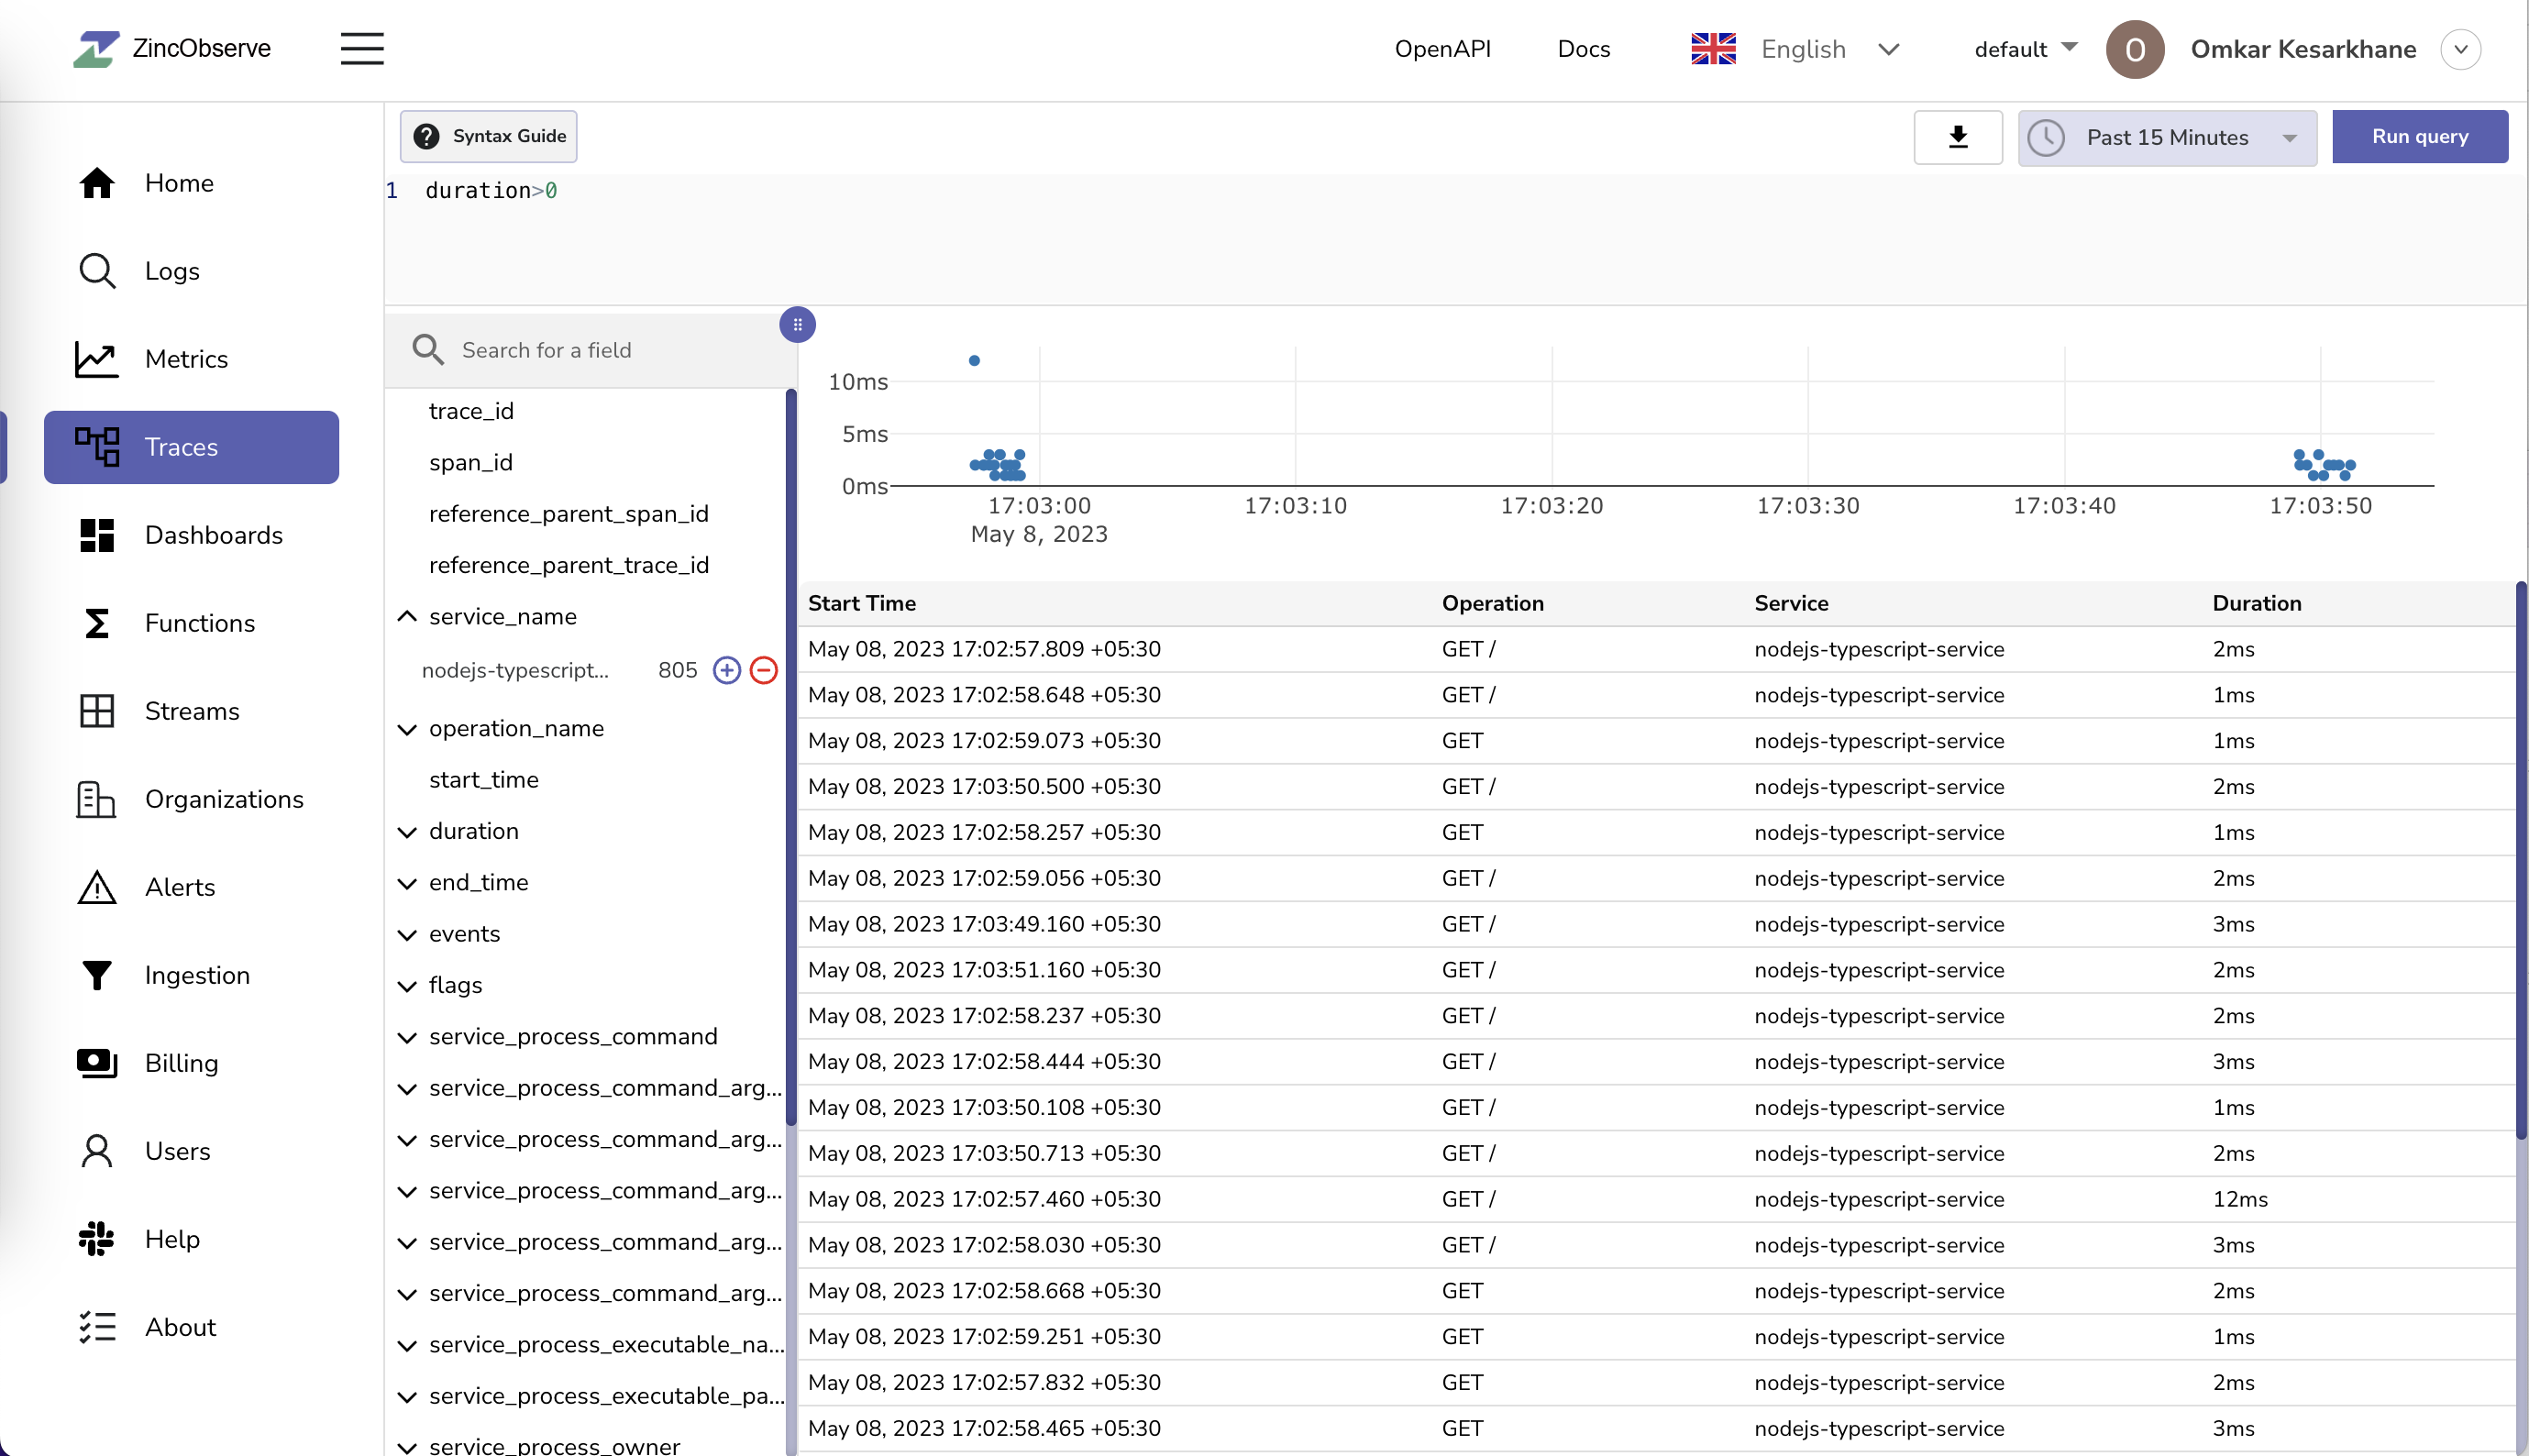
Traces are captured, you can check them in the Traces UI
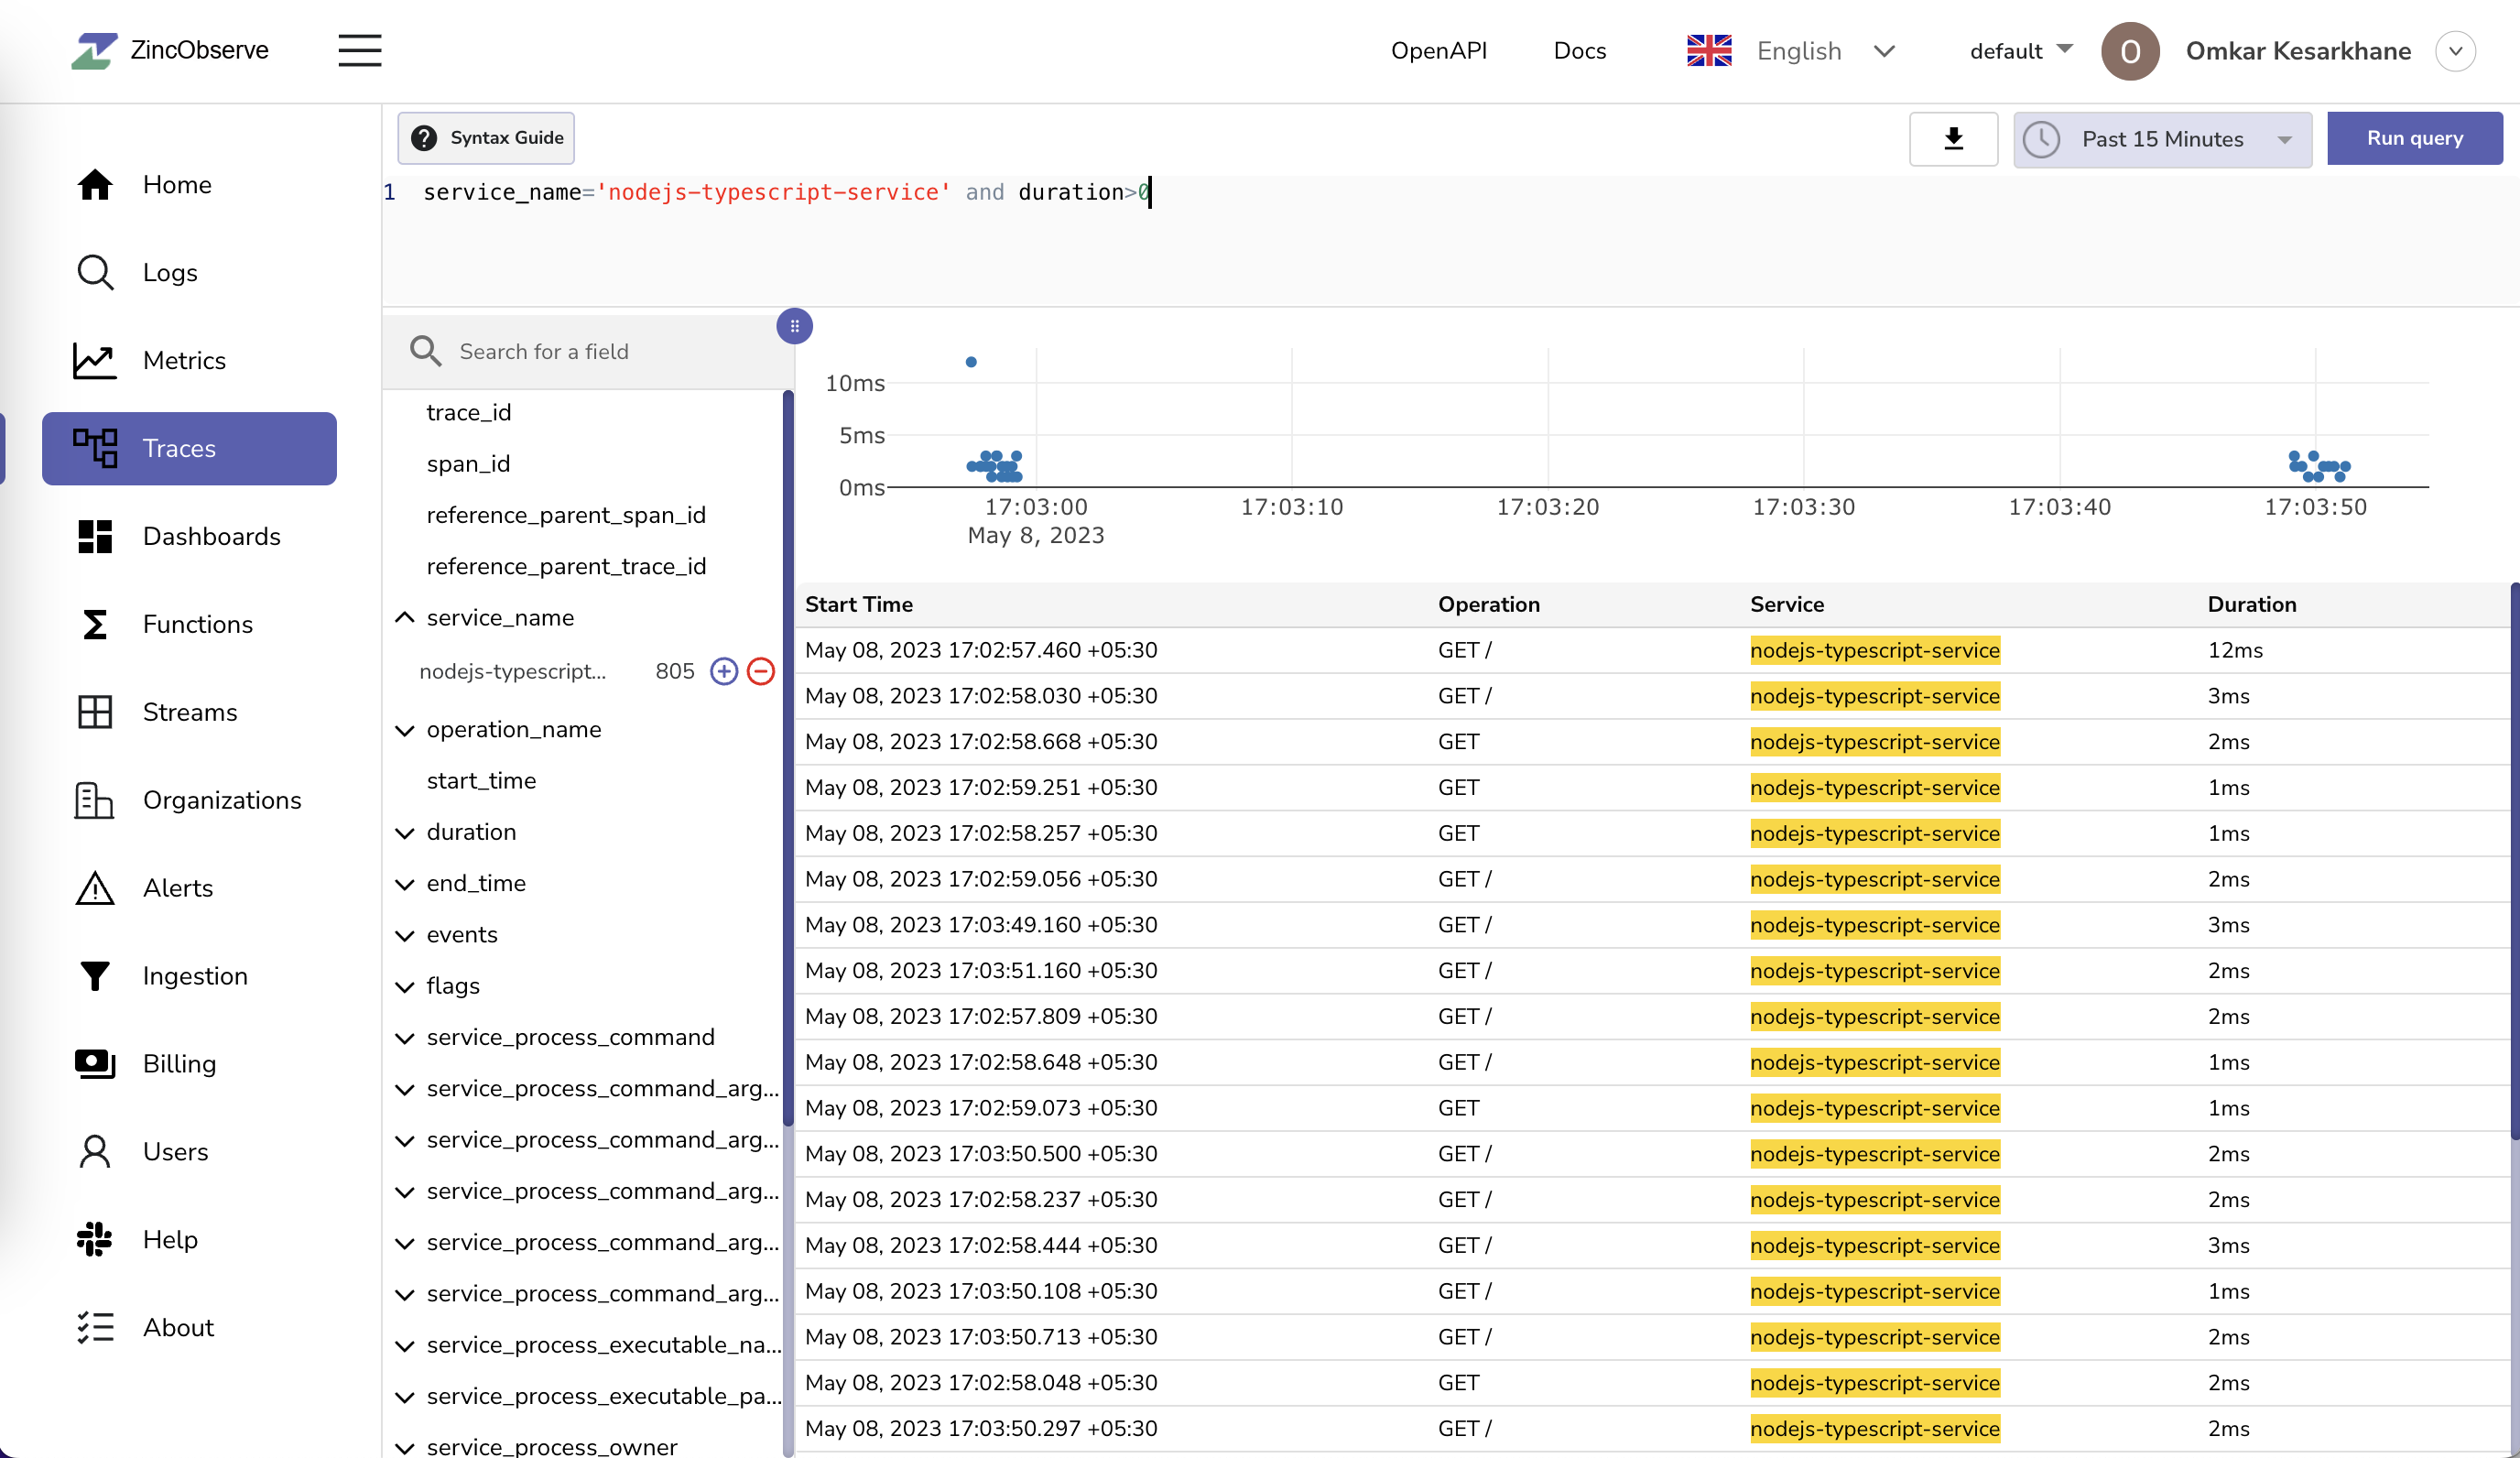
Filter traces with your service name nodejs-typescript-service
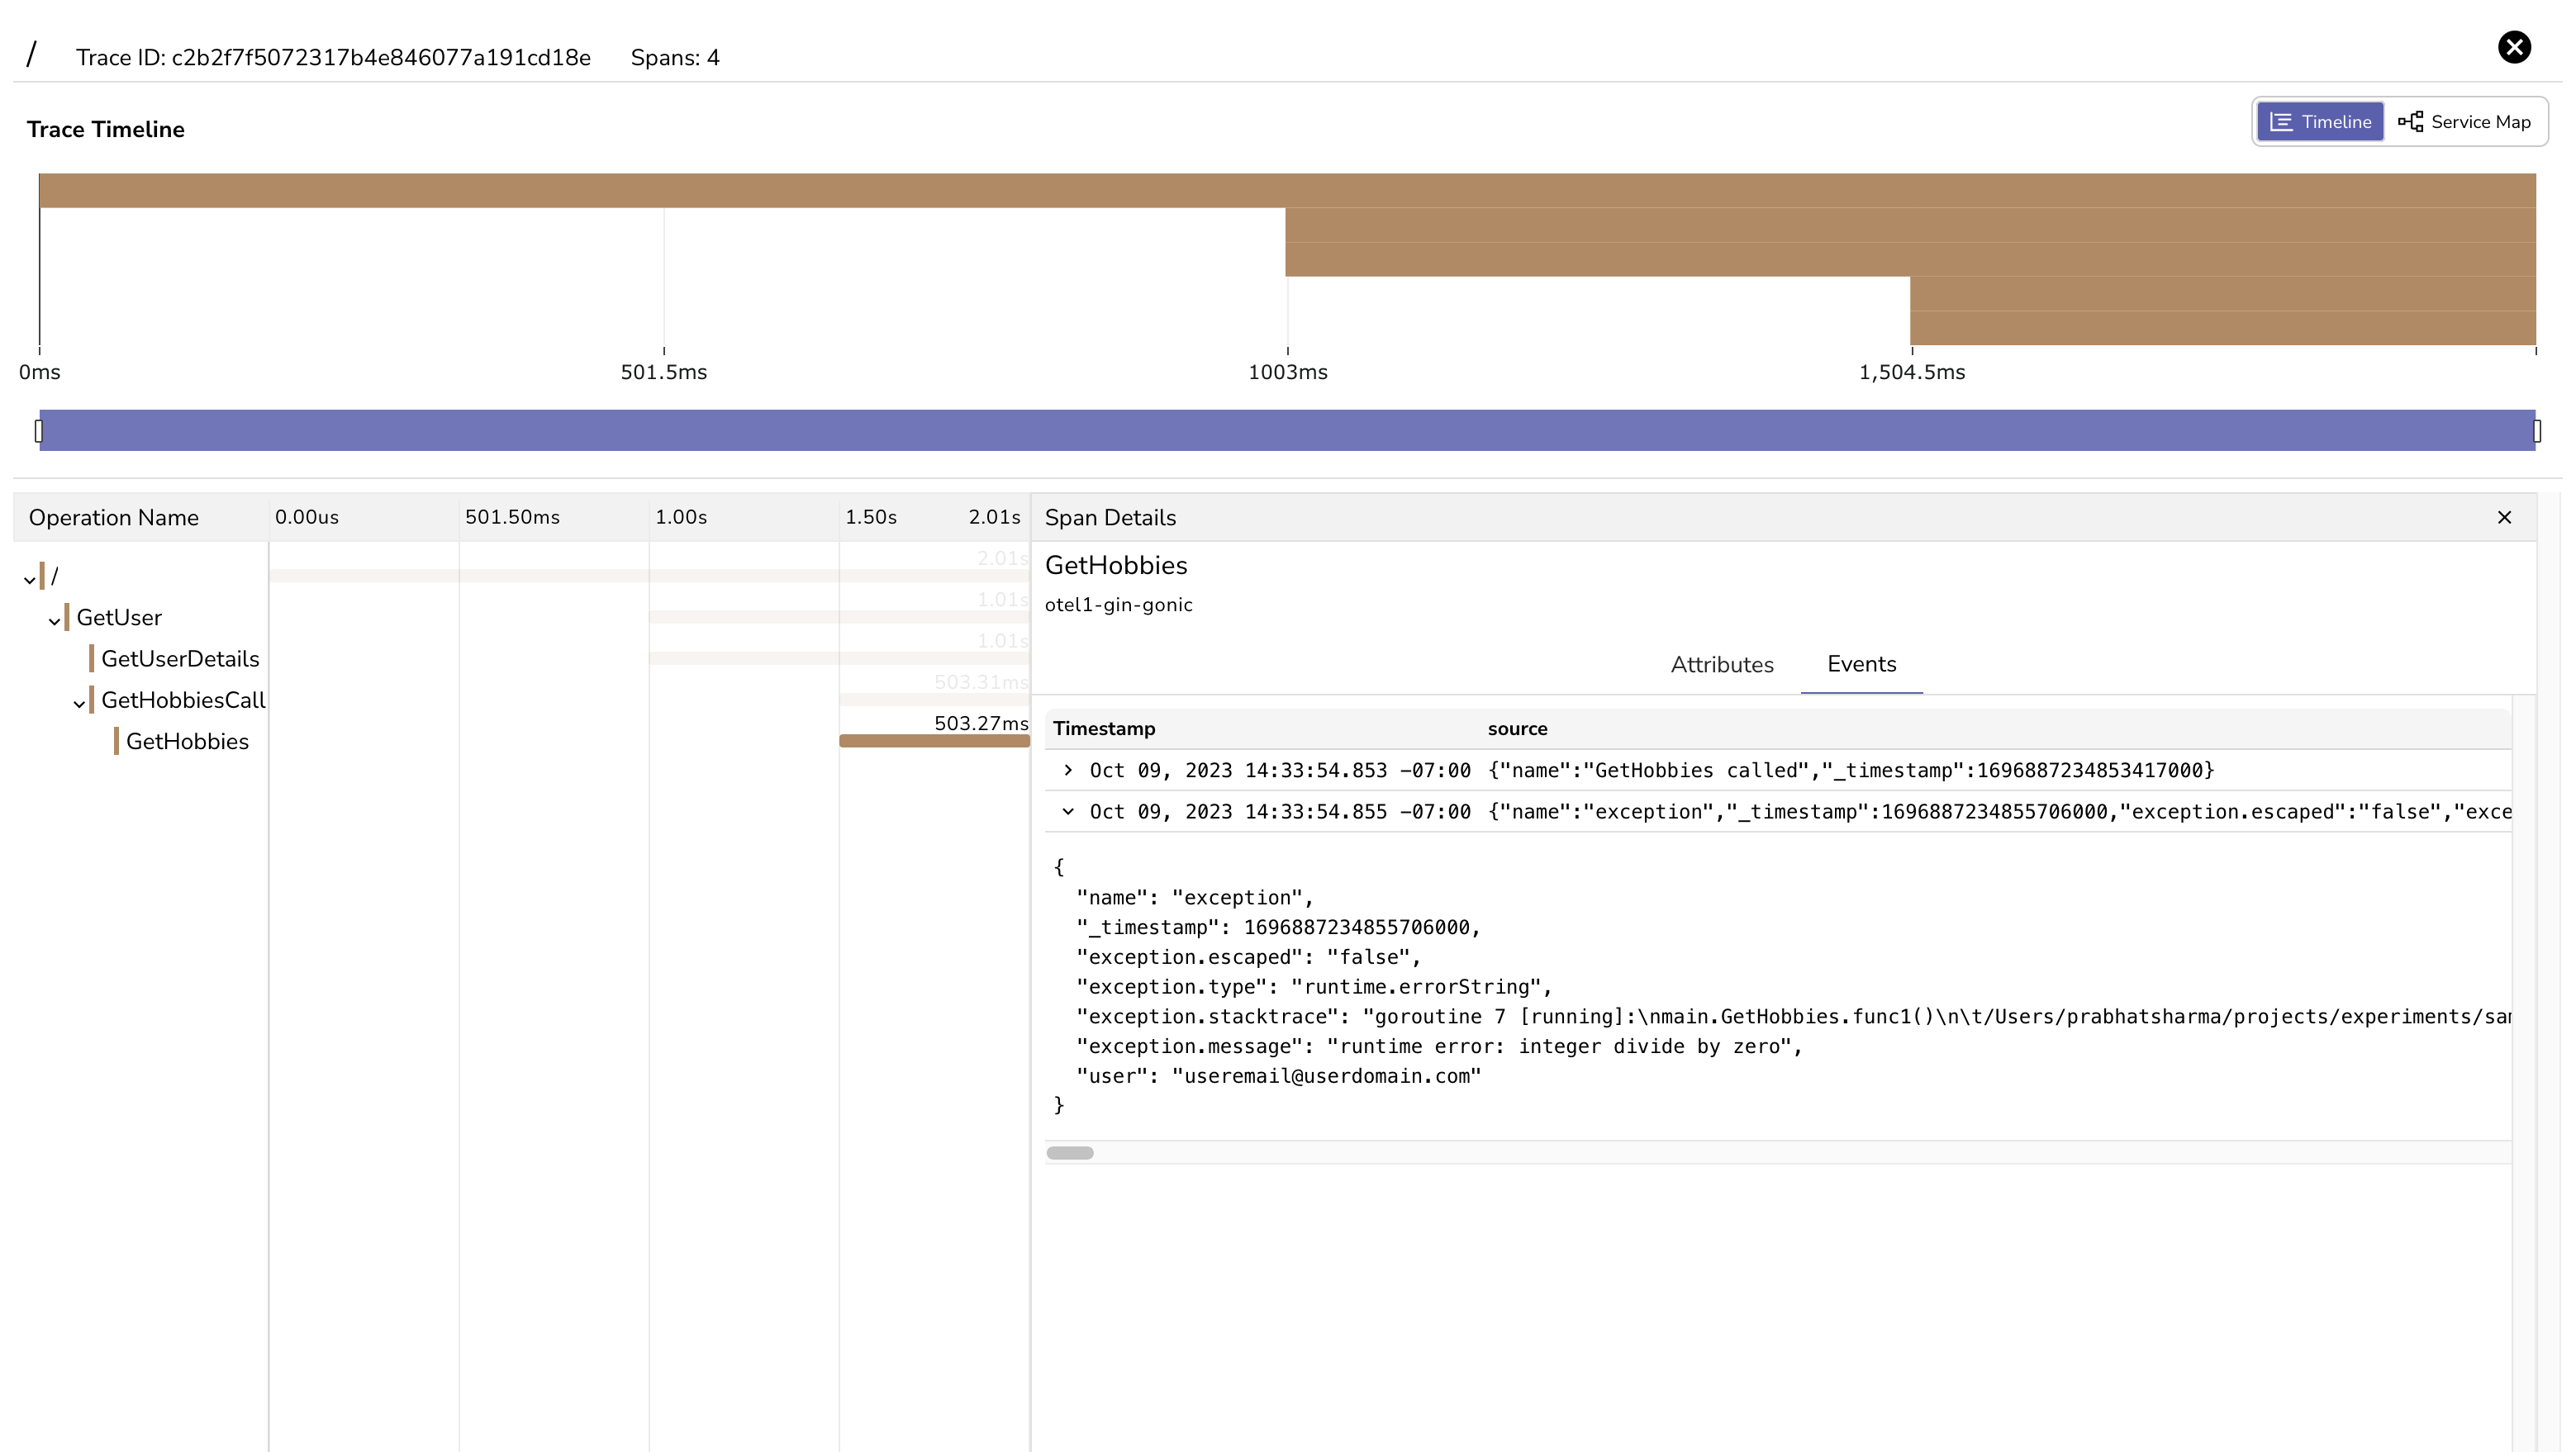
Click on any trace to check trace data.
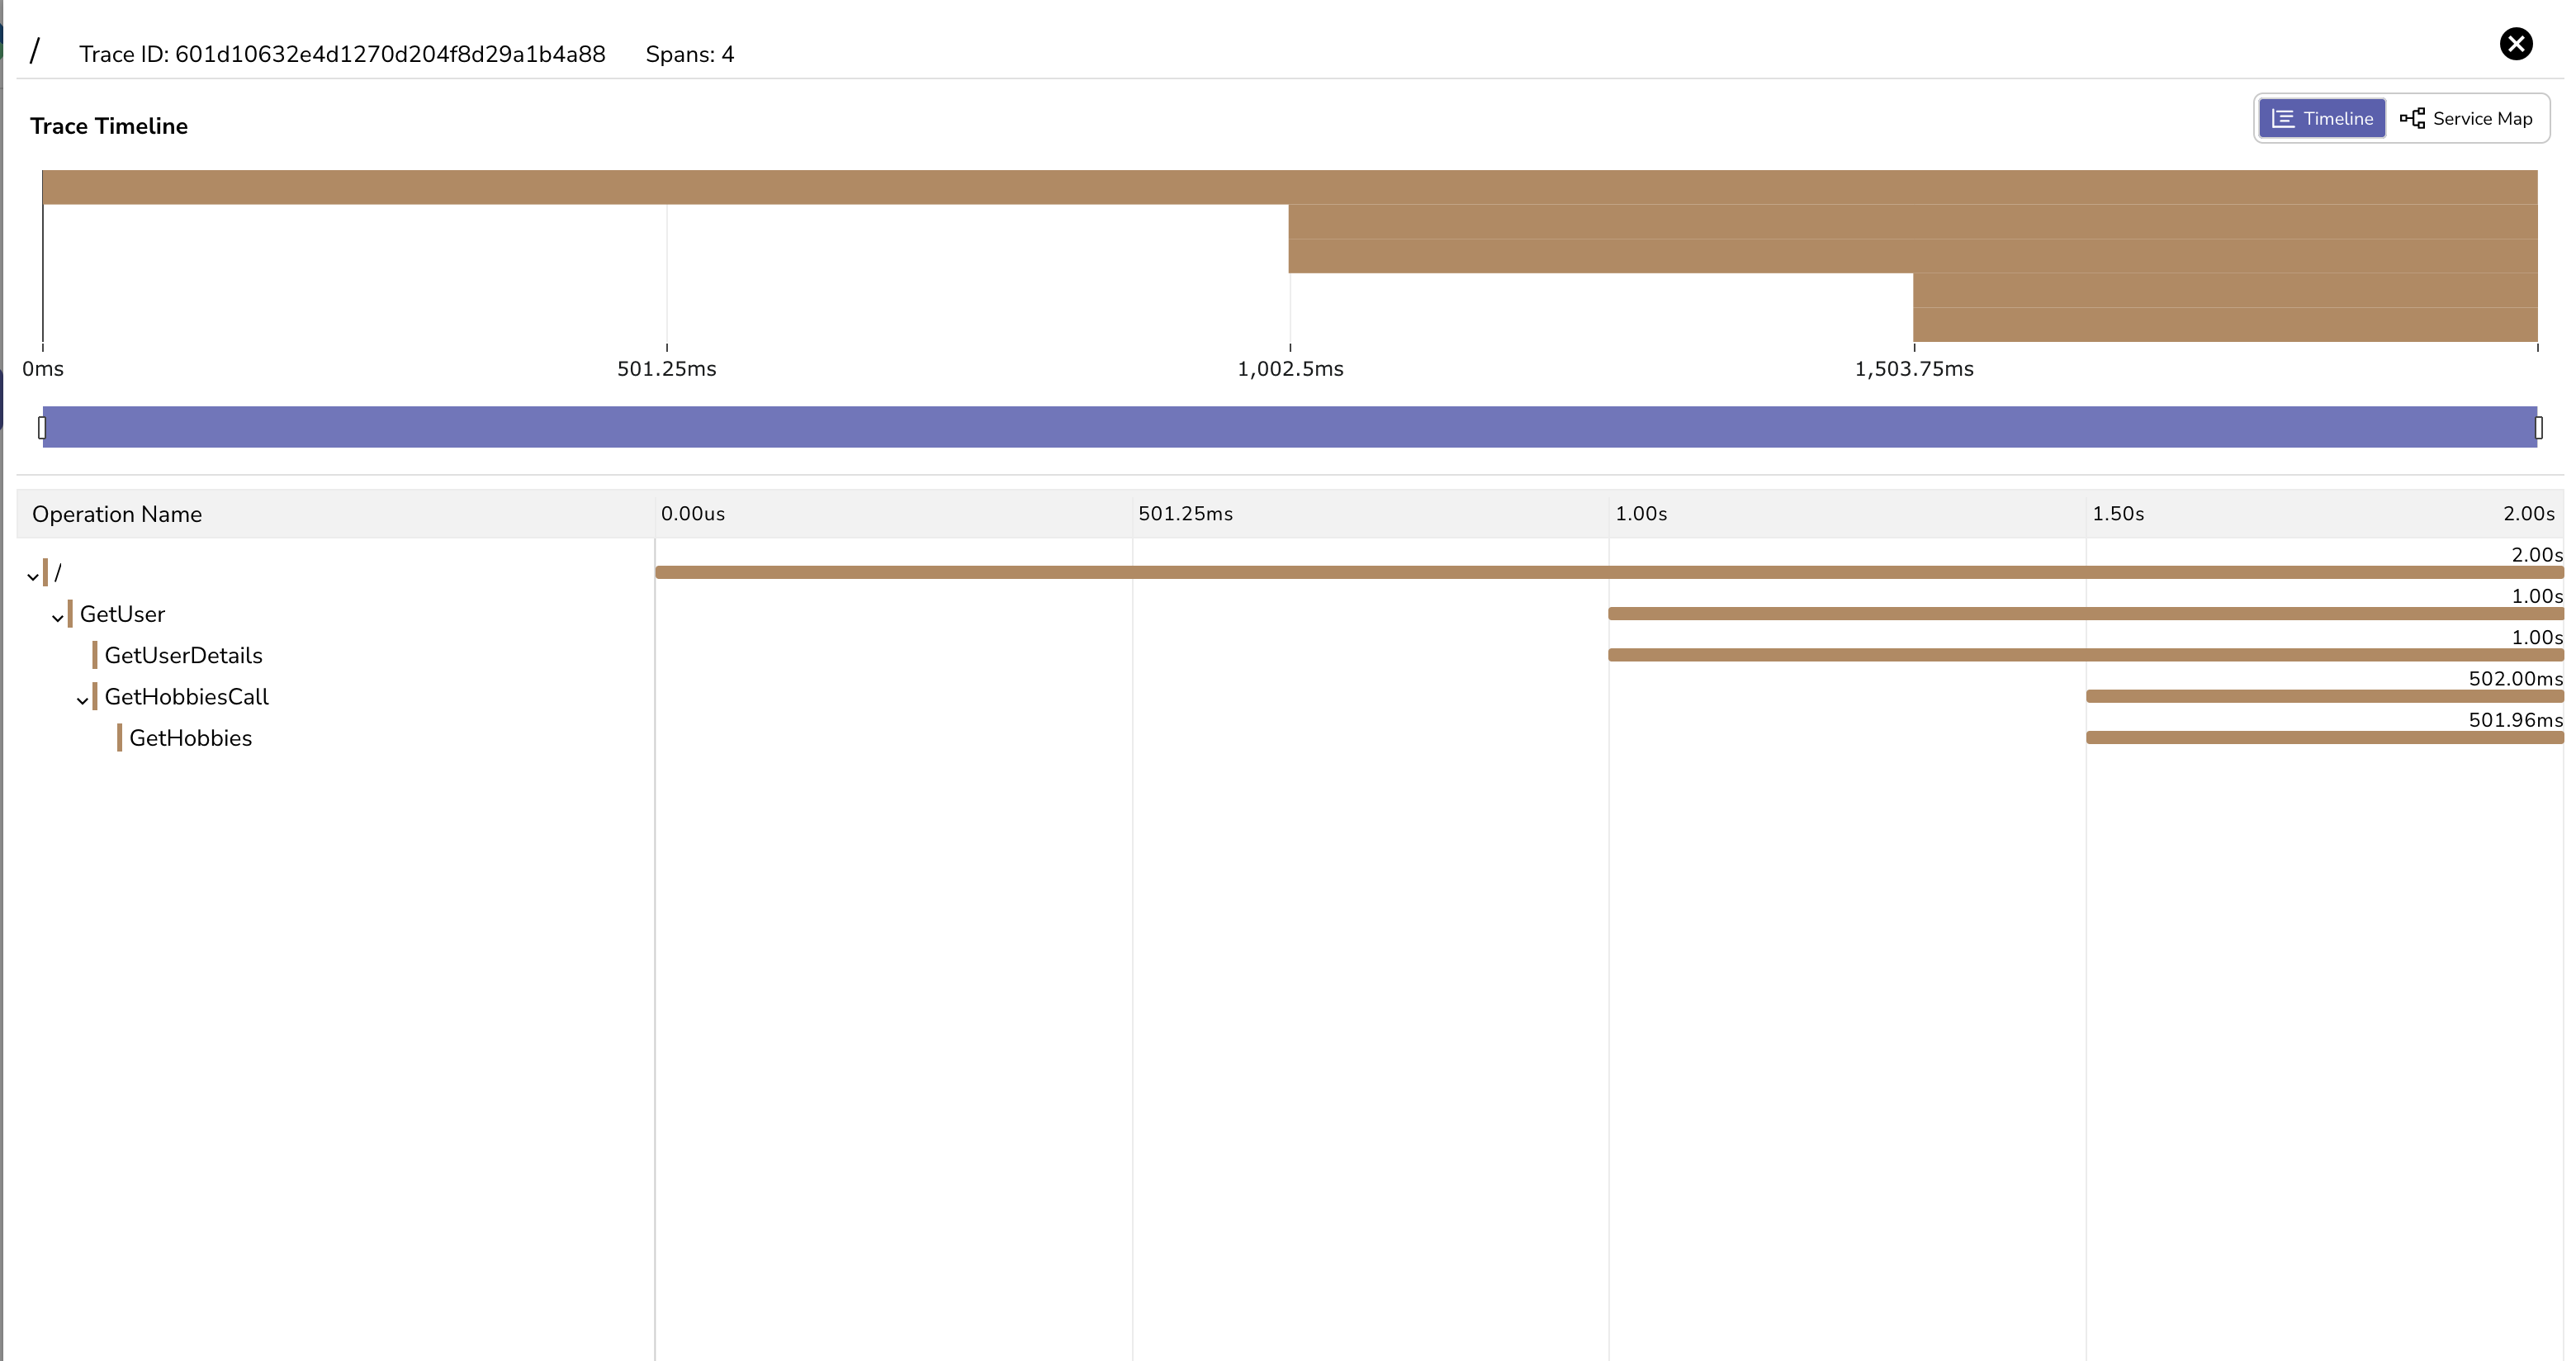
Trace can have multiple spans, each span represents single operation or task within that trace. Click on any span to check span details.