
Advanced Alert Configuration
This page covers advanced alert features: warning thresholds alongside critical thresholds, per-group multi-alert evaluation, priority and tags for triage, and SLO-based alerting.
Multi-level thresholds
For scheduled alerts, you can define a warning threshold in addition to the critical threshold. The warning level provides an early signal without triggering the same urgency as critical. It appears in the alert history and on the alerts list as a separate severity axis alongside the firing outcome.
Count-based alerts
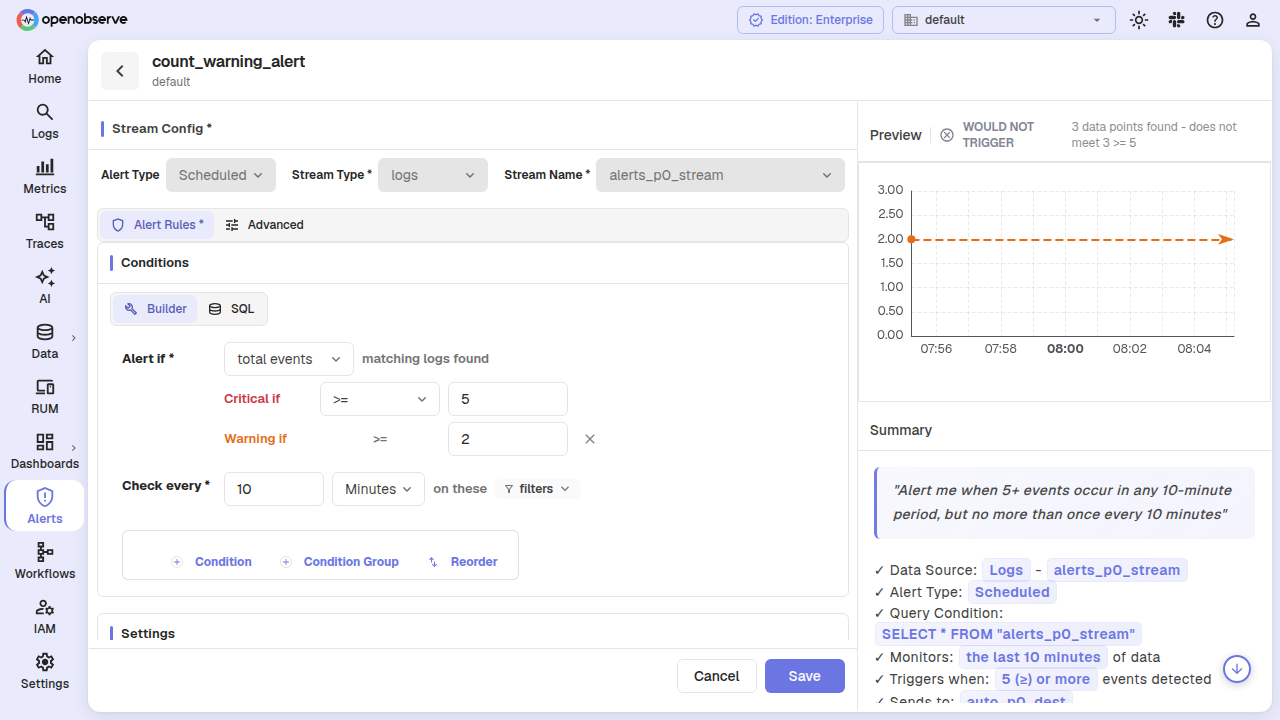
Count-based alerts (the default "total events" mode) gain an optional Warning threshold field below the existing threshold. The operator is shared between warning and critical — the warning value must be strictly less severe than the critical value:
- For
>=/>: warning must be smaller (e.g. critical=100, warning=50) - For
<=/<: warning must be larger (e.g. critical=10, warning=25) =/!=/Containsdo not support a warning level
When the evaluation exceeds the critical threshold, the alert fires at critical. When it crosses only the warning threshold, it fires at warning. A Notify on warning checkbox controls whether a warning-level match sends a notification — when disabled, warnings still update state and appear in the UI but do not page anyone.
Aggregation alerts
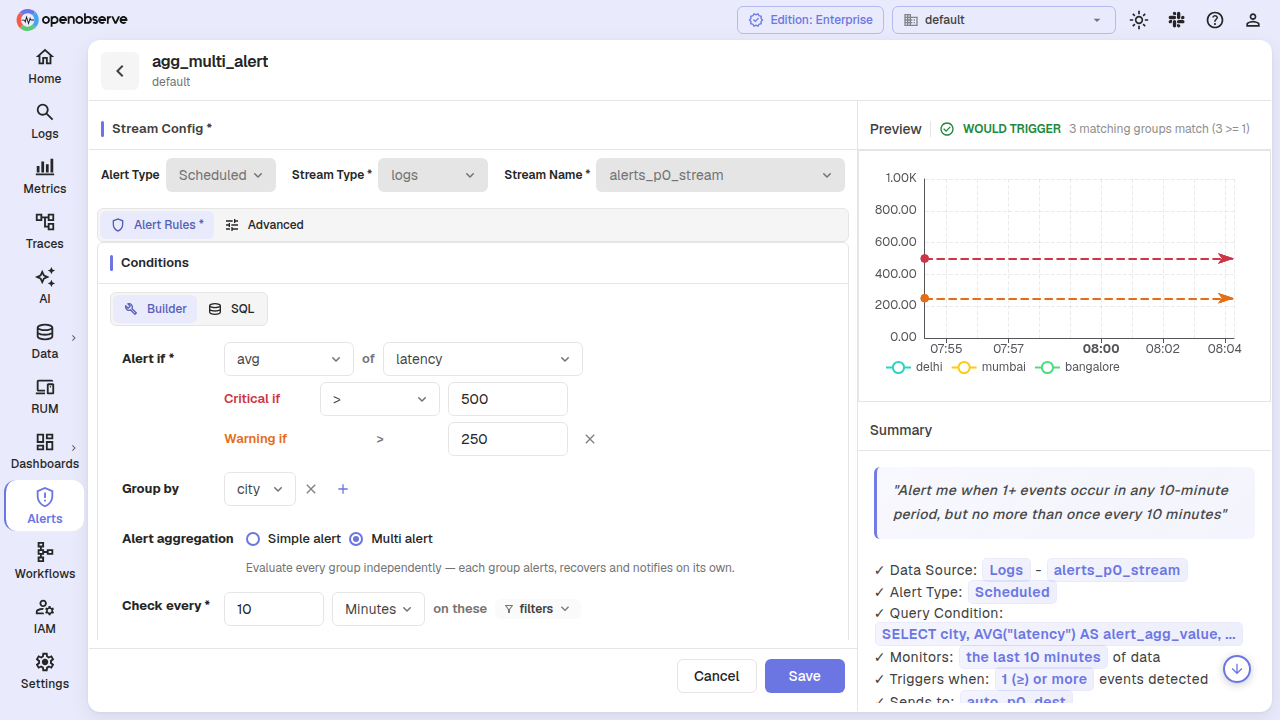
Aggregation alerts (measure mode with avg, sum, min, max, etc.) add a Warning value field to the aggregation section. The having.value remains the critical threshold; the warning value must be strictly less severe and shares the same operator and column.
The SQL HAVING clause widens to admit the warning band, then OpenObserve classifies each group in Rust so the two bands stay independent. A group at warning does not inflate the critical count.
The group-count threshold in the Settings section also accepts an optional warning count — for example, "critical when at least 5 groups cross the critical value, warning when at least 2 groups cross the warning value."
PromQL alerts
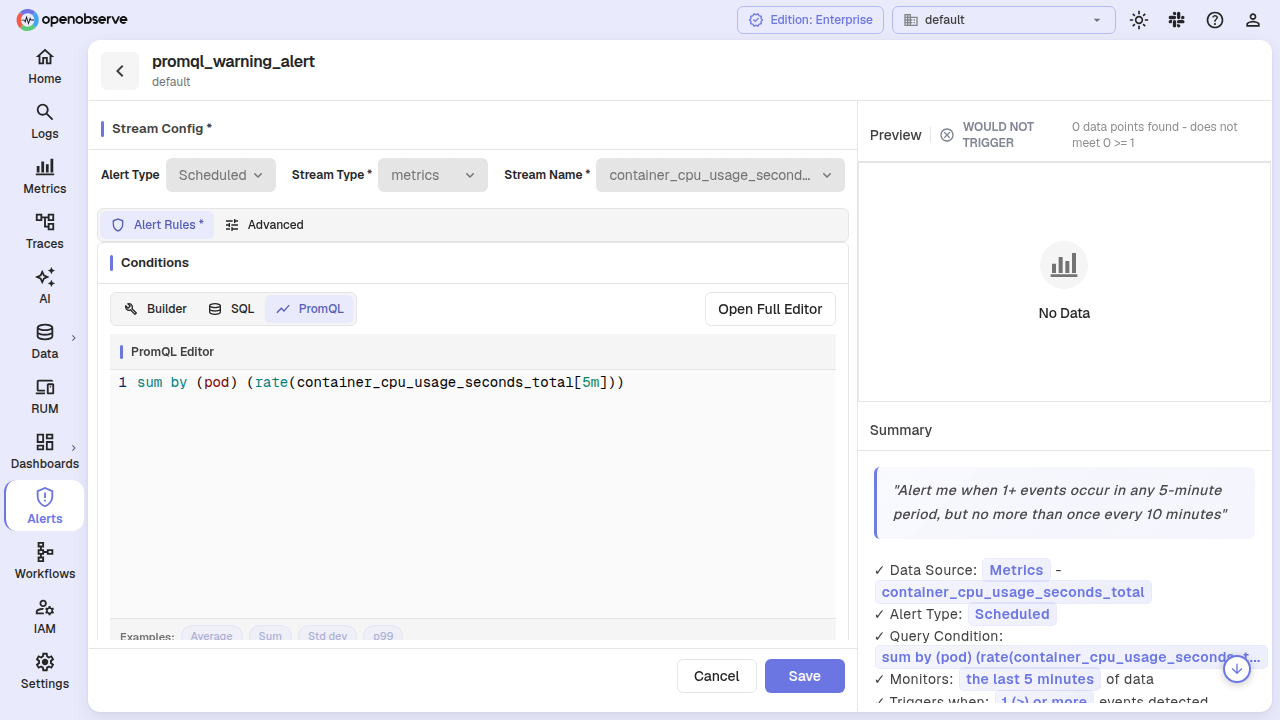
PromQL alerts add a Warning value field alongside the existing condition value. The operator is shared. The PromQL expression widens to evaluate at the less severe threshold, then each series is re-classified against both bands in Rust. A Per-series evaluation checkbox (promql_multi_alert) evaluates each series independently, using the series' full label set as the group key — the PromQL counterpart to aggregation multi-alerts.
Multi-alerts (per-group evaluation)
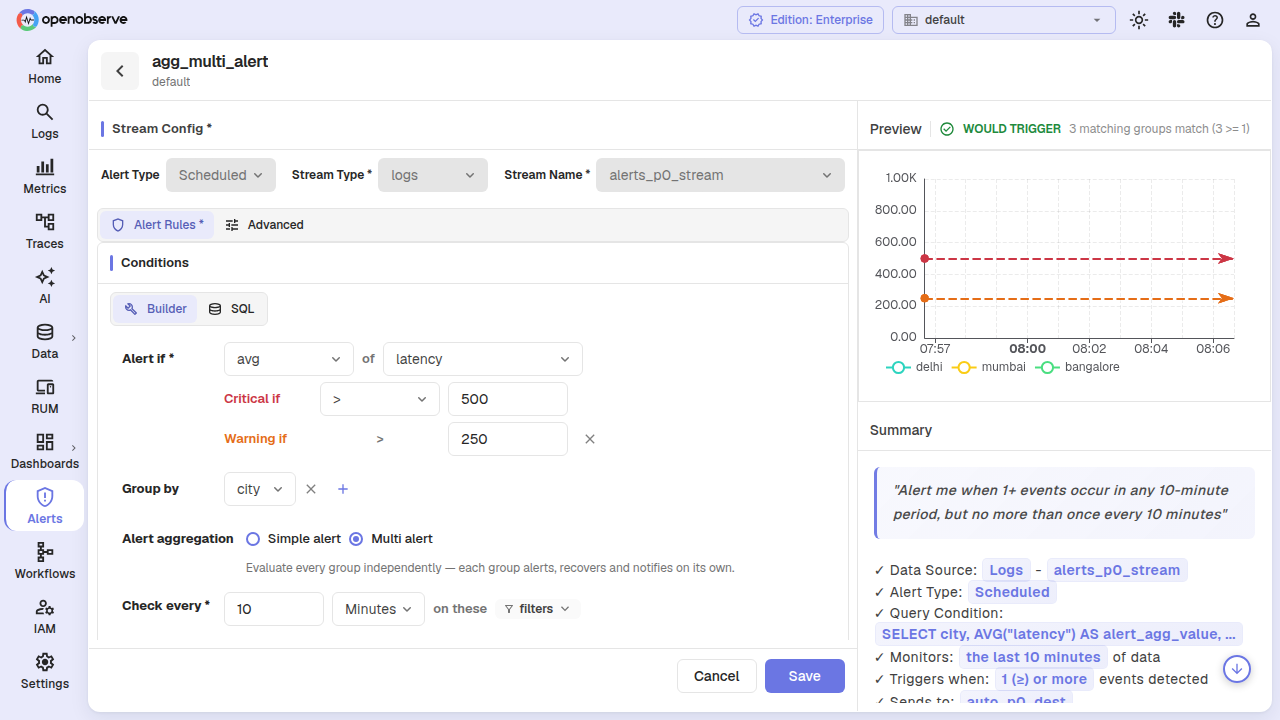
When an aggregation alert uses Group by, you can opt into per-group evaluation by enabling Multi-alert. Each unique group-by combination gets its own level, state row, and notification path, instead of the alert collapsing every group into a single verdict. SQL query-type alerts support the same per-group evaluation, deriving their groups from the query's own GROUP BY clause (see SQL multi-alerts below).
Enabling multi-alert
In the aggregation section, under a non-empty Group by, toggle Multi-alert on. The operator must be orderable (>=, >, <=, < — not = or !=).
When enabled, the alert evaluates the condition per group. Each group's aggregate value is classified against critical and warning thresholds independently, and the group-count thresholds in Settings gate how many groups must match before the alert fires at that level.
Group state and lifecycle
When a group's level changes (e.g. from ok to critical), OpenObserve records a transition in a durable table so history survives group reaping. The scheduler tracks every group in the alert_states table, up to a configurable cap (ZO_ALERT_MAX_GROUPS, default 500).
Groups that disappear from evaluation results do not immediately resolve. A group must be unseen for K times the alert's evaluation frequency (ZO_ALERT_GROUP_DISAPPEARANCE_K, default 3) before it is resolved to ok. After resolution, the state row is retained for a grace period (ZO_ALERT_GROUP_REAP_GRACE_SECS, default 3600 seconds) and then deleted. Transition history is kept regardless.
Viewing group details
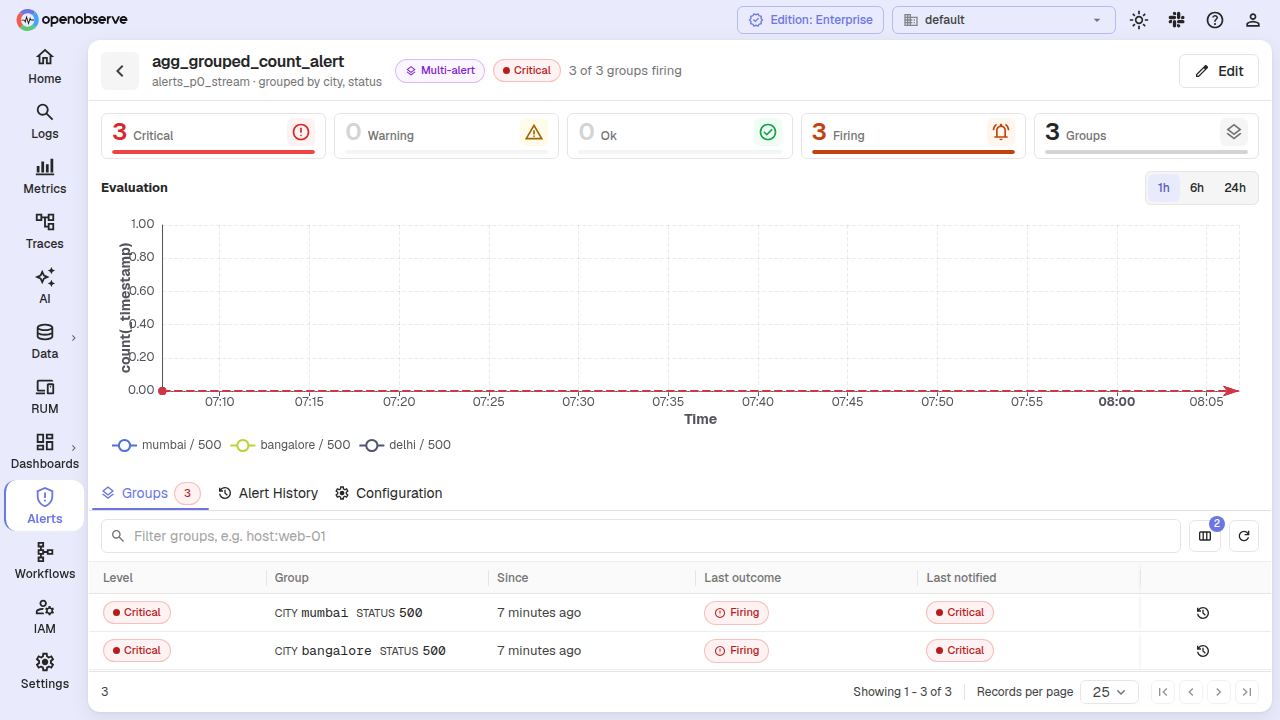
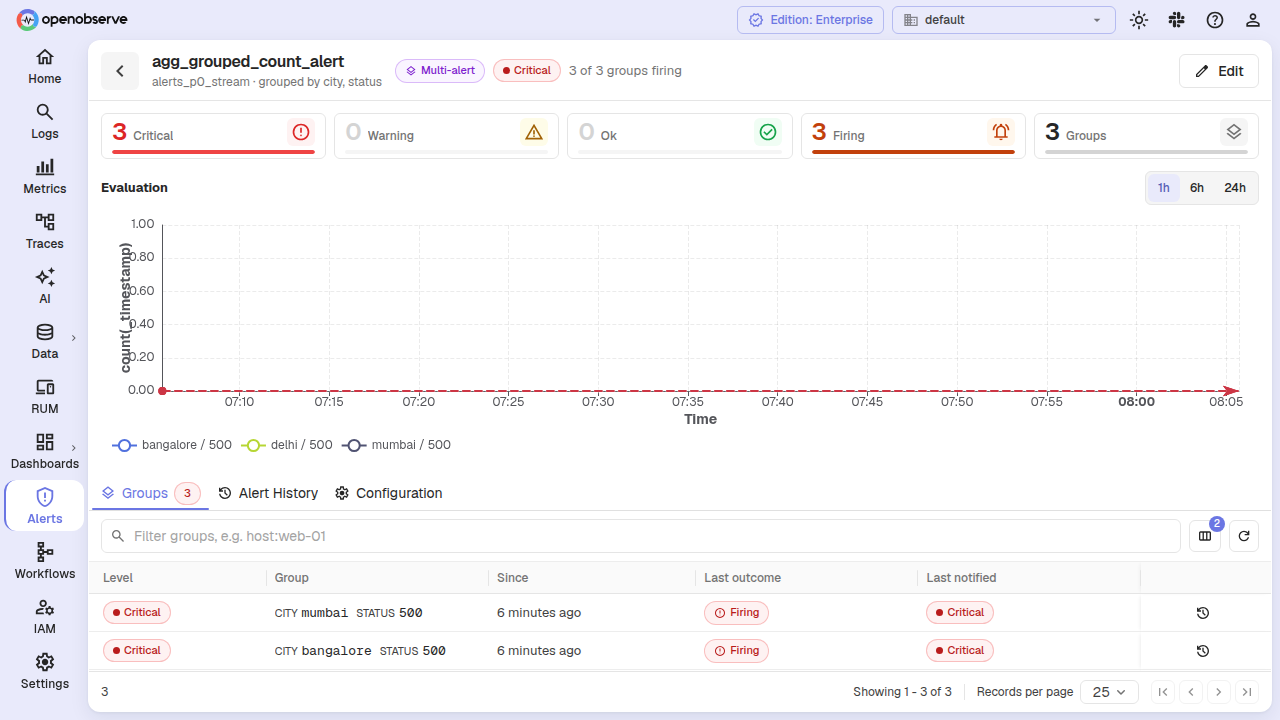
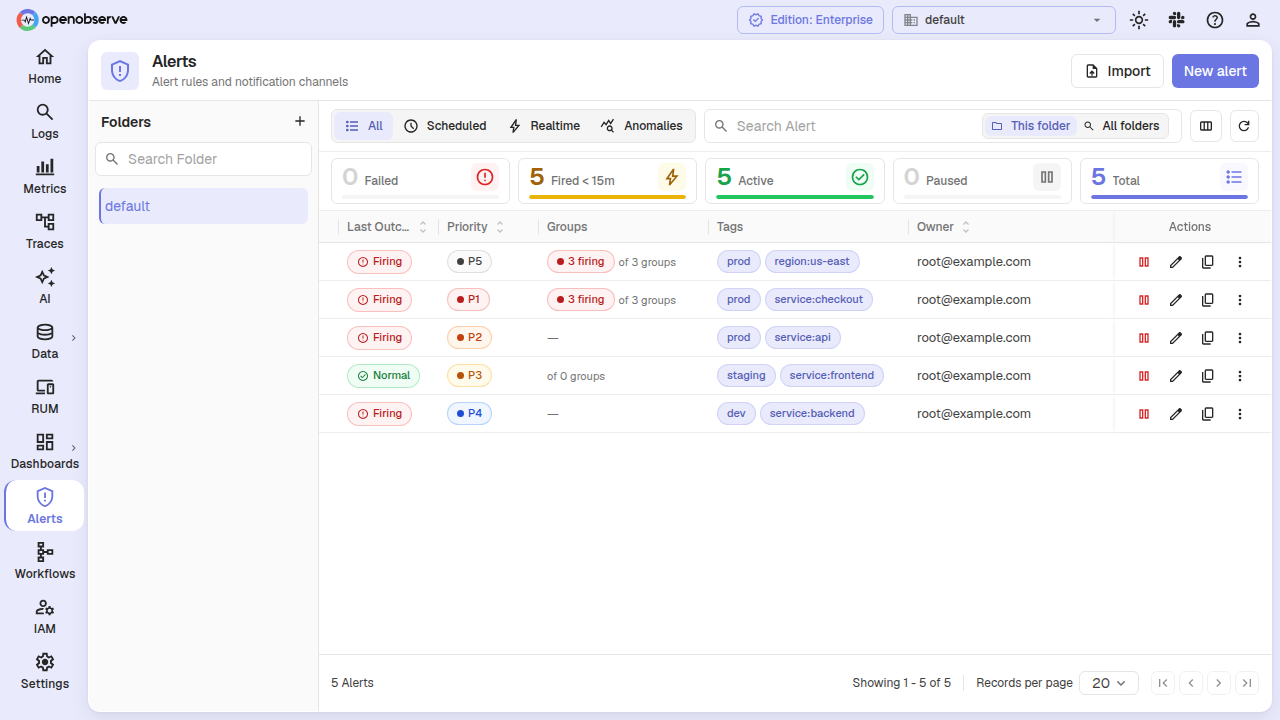
On the alerts list, multi-alerts show a N of M groups firing chip. Click the alert to open its detail drawer, then select the Groups tab to see the per-group breakdown — most severe first, with level, last outcome, and when the group was last seen.
From a group row, click to view its Transition history, showing every level and outcome change with timestamps and observed values.
SQL multi-alerts
SQL query-type alerts can opt into per-group evaluation too. Unlike the Custom builder — where you pick the Group by fields yourself — a SQL multi-alert derives its groups from the query's own GROUP BY clause, and compares a single aggregate value column from the query's output.
Enabling SQL multi-alert
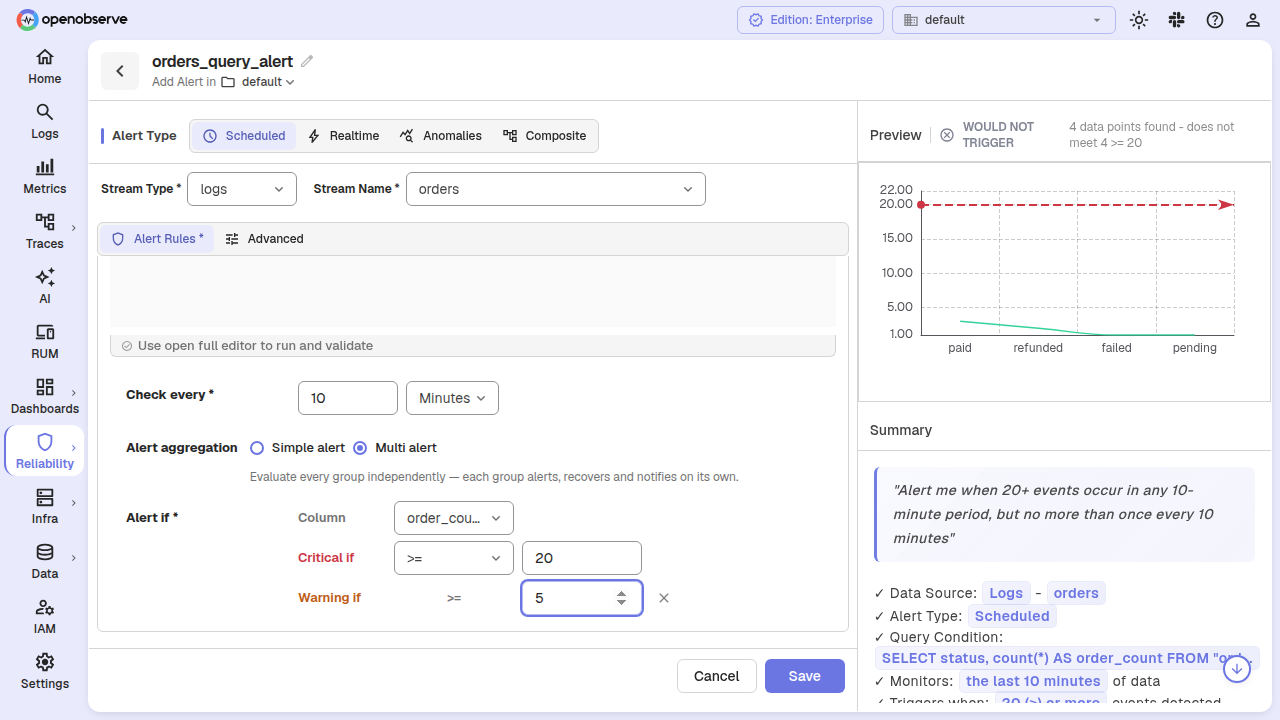
In SQL mode, the Simple / Multi choice appears above the condition row. Leave it on Simple to alert on the total number of returned rows (Alert if No. of events), or switch to Multi to classify each group independently.
When you enable Multi, the condition row becomes Alert if [column]:
- Column: a dropdown listing the query's resolved output columns (the columns your SQL actually projects). Select the aggregate value column the alert should compare.
- Critical if: the operator and threshold applied to that column.
- Warning if (optional): a less-severe threshold that shares the critical operator.
Grouping and validation
A SQL multi-alert does not expose a Group by picker — the groups are the fields in your query's GROUP BY clause. On save, OpenObserve verifies that:
- the query has at least one
GROUP BYfield; - every group-by field is present in the projections, without an alias; and
- the selected Column is one of the query's output columns.
If any of these checks fail, saving is rejected with a 400 error describing the missing or aliased field.
HAVING clause warning
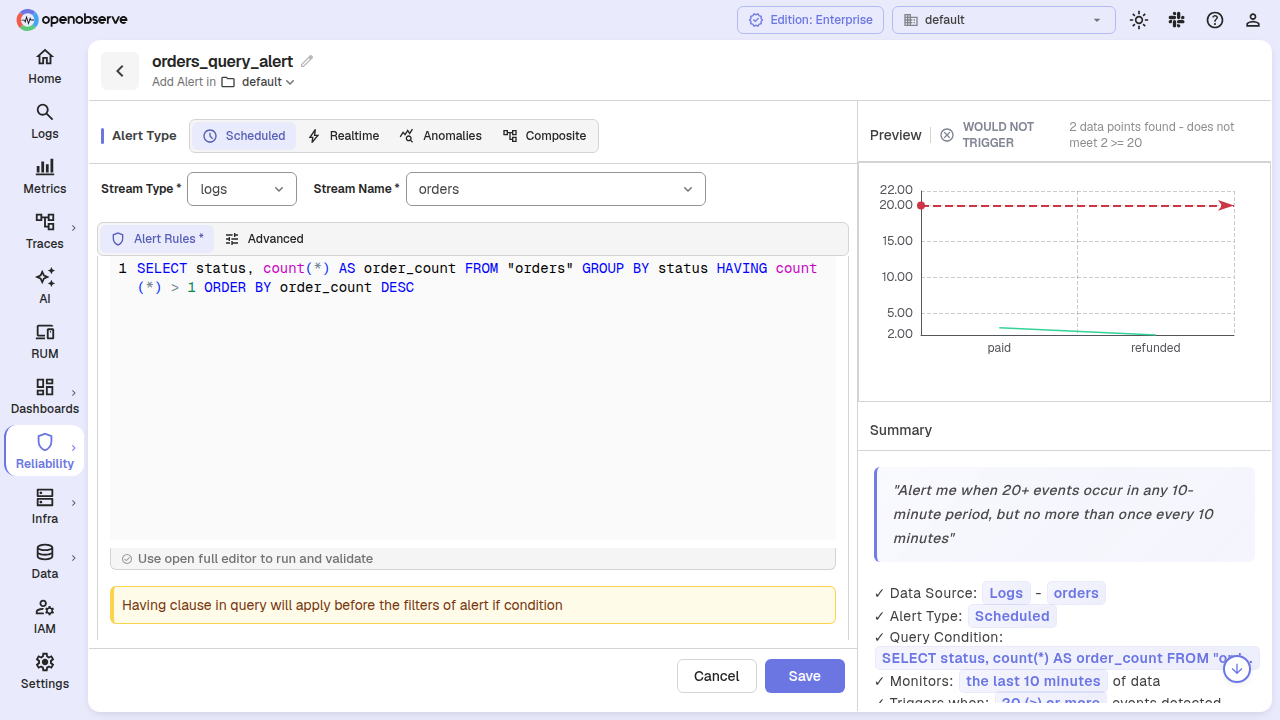
If your SQL includes a HAVING clause, OpenObserve shows a warning banner: Having clause in query will apply before the filters of alert if condition. The clause filters your result set before the multi-alert's Alert if condition evaluates it, so a group that fails the HAVING filter never reaches the threshold check.
Group-count gate
As with Custom multi-alerts, the Settings group-count gate applies. For SQL multi-alerts it is pinned to at least 1 group — the alert fires whenever any single group crosses the threshold.
Alert priority
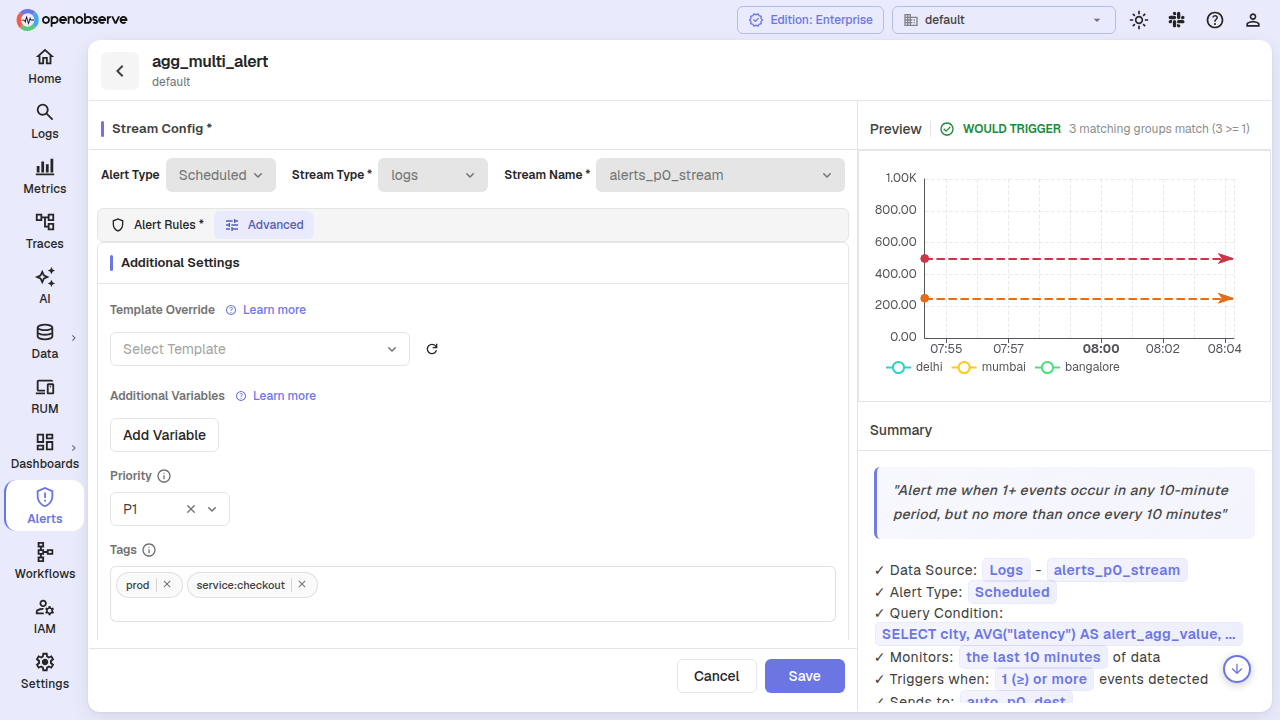
Assign a Priority (P1 through P5, P1 = most urgent) to any scheduled, real-time, or anomaly detection alert. Priority is display-and-propagation metadata — it does not influence evaluation, silence, delivery, or incident severity.
Setting priority
In the alert creation or edit form, select a priority from the Priority dropdown in the top bar or the advanced settings section. Clear it to return to unset.
Filtering and sorting by priority
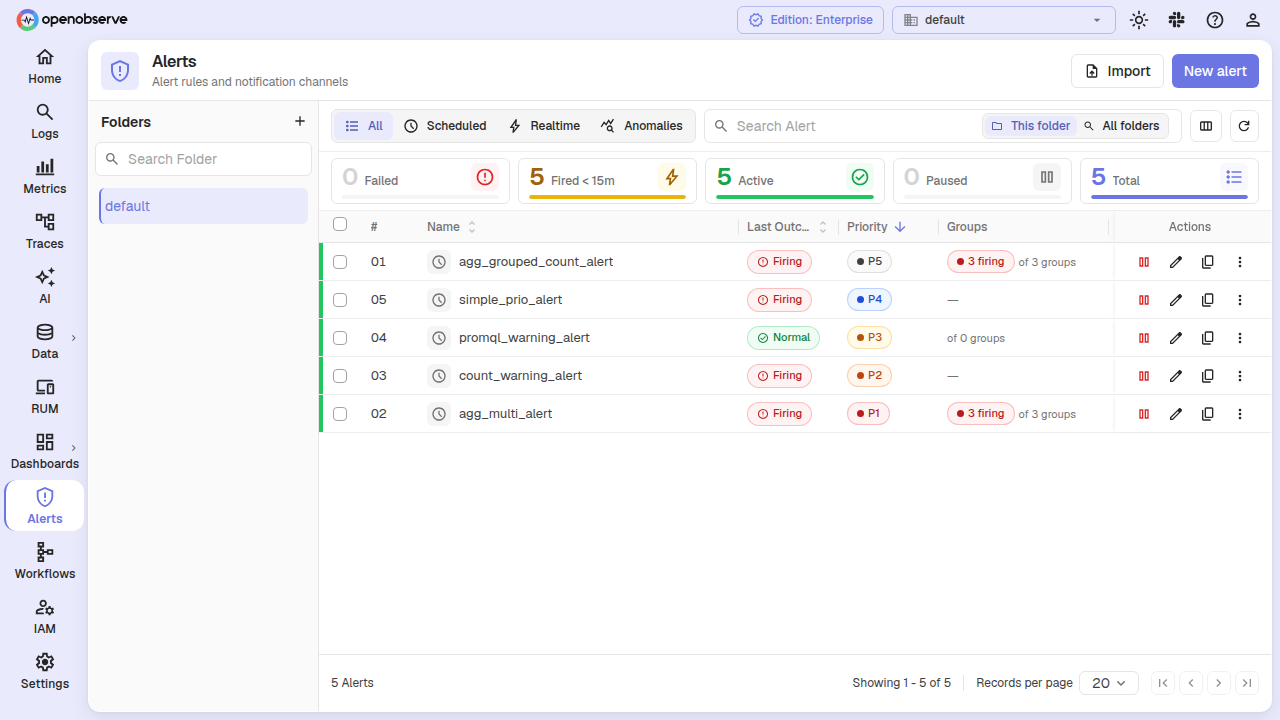
On the alerts list page, use the priority filter to show only alerts at selected levels (OR semantics — ?priority=1&priority=2 returns P1 or P2). The column is also sortable by clicking the priority column header in the table. Unset priority sorts last in either direction.
Alerts with no priority are excluded whenever a filter is active — "show me the P1s" does not surface unprioritized alerts.
Alert tags
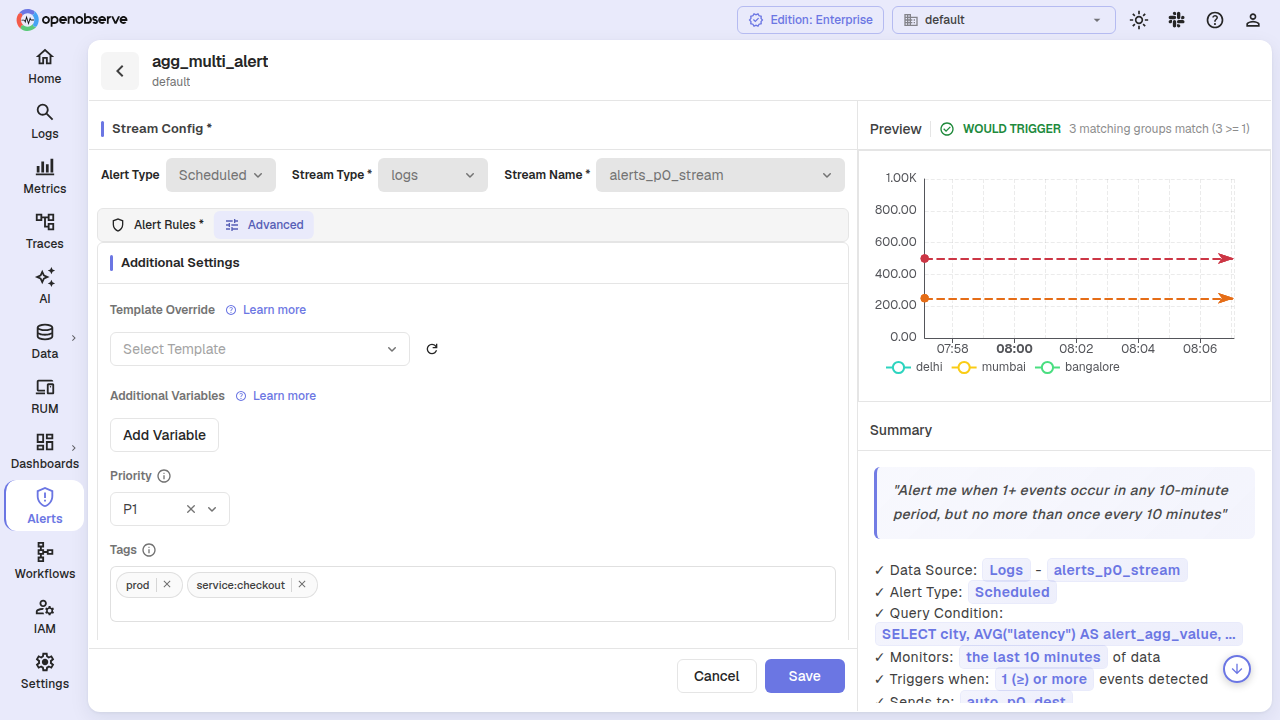
Tags are free-form selection labels (e.g. prod, service:checkout) that make alerts searchable and filterable. Tags are normalized to lowercase on save and validated for allowed characters.
Adding tags
In the alert form's advanced section, add one or more tags. Tags are case-normalized automatically — PROD and prod resolve to the same tag. Invalid characters are rejected at save time with a validation error.
Filtering by tags
On the alerts list, use ?tags=prod,service:checkout to show only alerts that carry every listed tag (AND semantics). An invalid tag token is retained rather than silently dropped — a request for a tag that no alert carries returns an empty result, not every alert.
Tags facet
The tags facet endpoint (GET /v2/{org}/alerts/tags) returns distinct tags with occurrence counts across the alerts the caller can see. It supports an optional ?prefix= parameter for autocomplete and a ?folder= parameter to scope to one folder. The response is authorization-aware: it only returns tags from alerts the caller has permission to list.
Run state on the alerts list
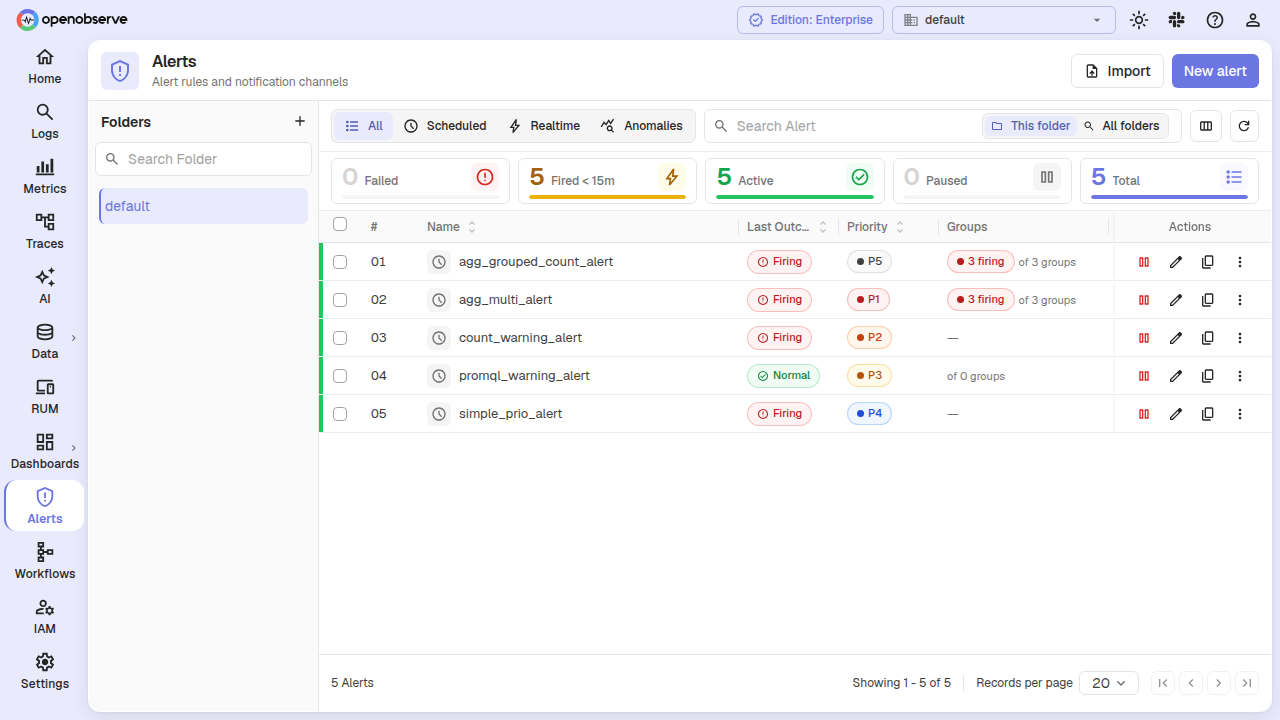
The alerts list now includes live run state for each alert, enriched from the durable alert_states table:
- Last outcome:
firing,normal,error,notify_failed, orsucceeded— the result of the last evaluation - Level:
ok,warning, orcritical— a separate severity axis from the outcome. An alert can befiringatwarning - Level since: how long the alert has been at its current level
For multi-alerts, additional columns show groups_observed and groups_firing with a ≥ marker when the count is a lower bound (the group page was full, and groups beyond the cap were never seen).
Enhanced alert history
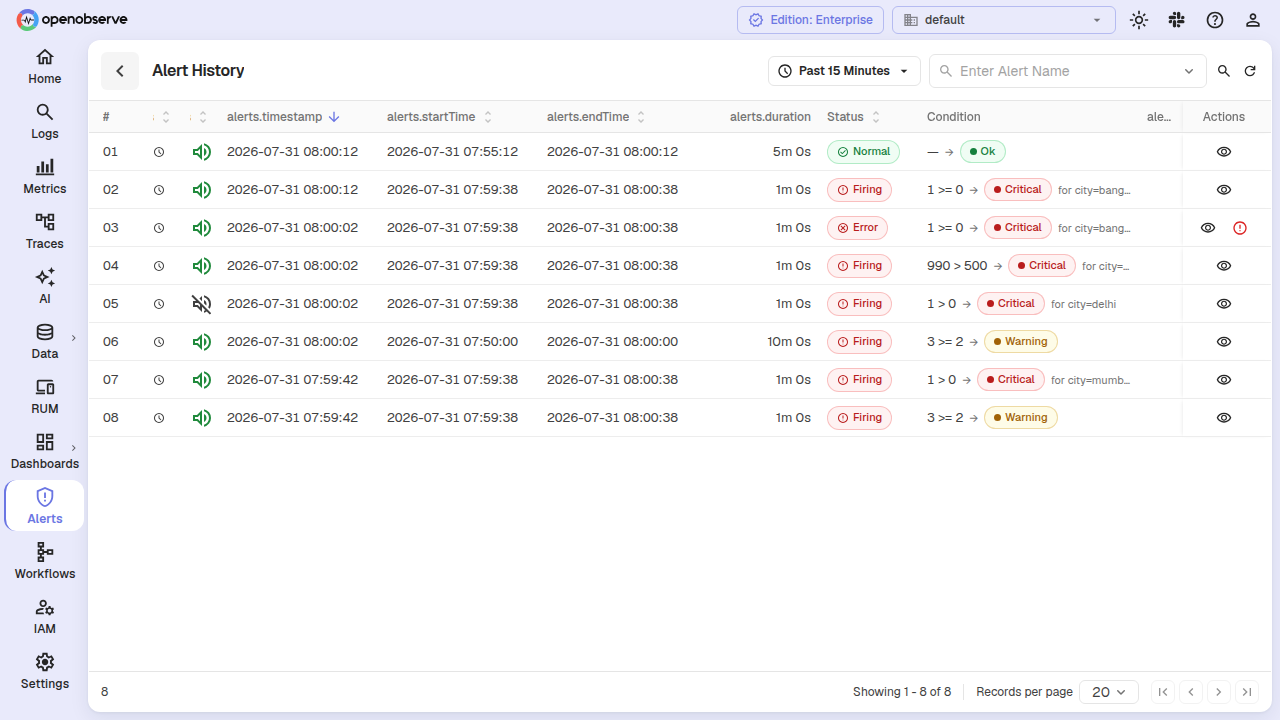
Alert history entries now carry value context so each row reads standalone:
- Level: the severity of the matched threshold (
criticalorwarning) - Actual value: the value that was compared (row count or aggregate)
- Threshold value: the threshold that matched
- Threshold operator: e.g.
>= - Group label: which group produced the value, for multi-alerts and grouped queries
- Value is lower bound:
≥marker for legacy capped count fetches
Outcome values are normalized across the retention window: firing, normal, error, notify_failed, and succeeded replace the older completed / condition_not_met vocabulary.
SLO alerts
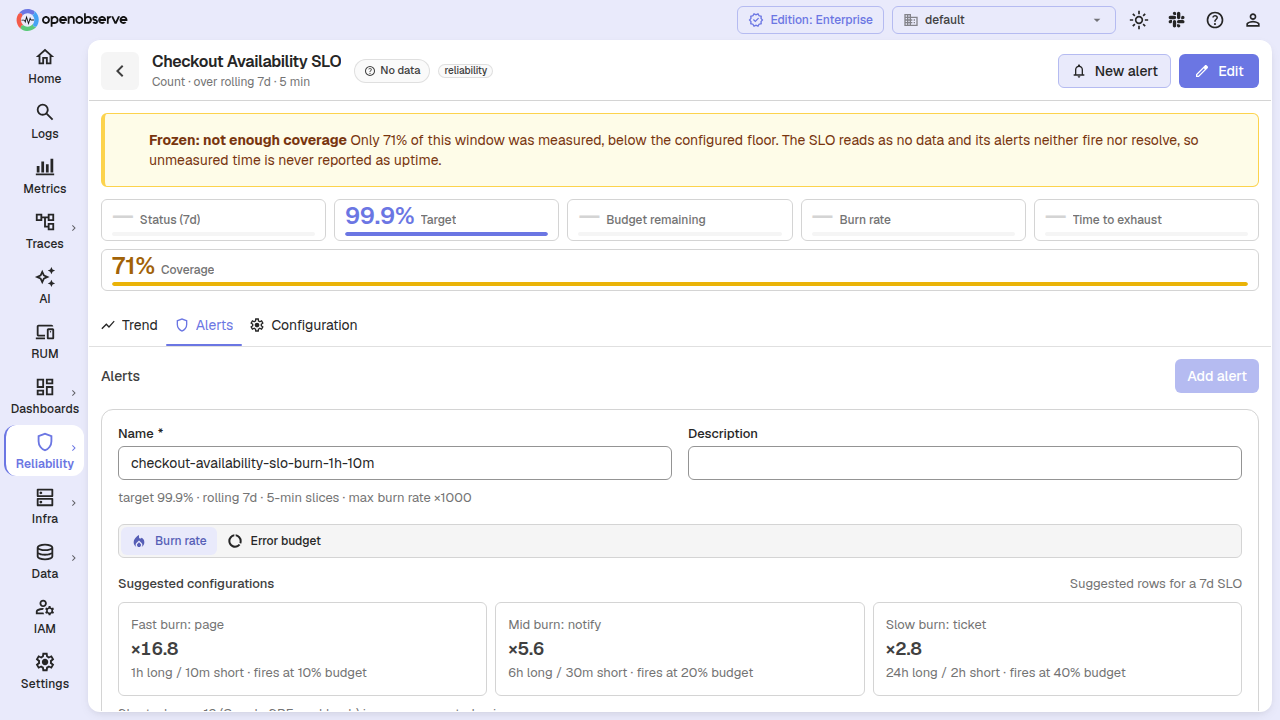
SLO alerts read precomputed SLO status rather than running a query directly. When you select SLO as the query type in the alert form, the alert is bound to an SLO entity. The SLO's burn rate or error budget is evaluated externally, and the alert fires based on the SLO's computed status.
SLO alerts use a dedicated QueryType::Slo. Their deduplication identity is the SLO itself (plus its group key when grouped), not columns of a result row — there is no SQL, PromQL, or condition list to draw column names from.
SLO measurement is behind the feature flag ZO_SLO_ENABLED (default false). SLO CRUD endpoints live under /api/{org}/slos and share the alert folder namespace. When enabled, SLO-based alerts appear as an alert type filter on the alerts list.
New configuration
| Variable | Default | Description |
|---|---|---|
ZO_ALERT_MAX_GROUPS | 500 | Max per-group state rows per multi-alert. 0 = unlimited. |
ZO_ALERT_GROUP_DISAPPEARANCE_K | 3 | A group unseen for K x the alert's frequency is resolved to ok. |
ZO_ALERT_GROUP_REAP_GRACE_SECS | 3600 | How long a resolved group's state row is retained before deletion. |
ZO_ALERT_MAX_GROUP_NOTIFICATIONS_PER_EVAL | 0 | Cap on per-group notifications per evaluation. 0 = unlimited. |
ZO_ALERT_GROUP_SWEEP_INTERVAL | 60 | How often the group lifecycle sweep runs, in seconds. 0 disables it. |
ZO_ALERT_HYBRID_COUNT_THRESHOLD | 100 | Count-based alerts exceeding this row sentinel use a COUNT(*) decision query. |
ZO_SLO_ENABLED | false | Set true to enable SLO measurement and SLO-based alerts. |
API endpoints
Group state and history
-
GET /api/v2/{org}/alerts/{id}/groups— Lists per-group state rows for a multi-alert, most severe first, with pre-cap group counts for the "N of M groups firing" chip. Returns empty for alerts that have not opted into per-group evaluation. -
GET /api/v2/{org}/alerts/{id}/groups/transitions— Returns level/outcome transitions for a multi-alert, newest first. Accepts optional?group_key=to scope to one group and?limit=(default 100, max 1000).
Tags facet
GET /api/v2/{org}/alerts/tags— Returns distinct tags with occurrence counts across the alerts the caller can see. Accepts?prefix=for autocomplete,?limit=(default 100, max 1000), and?folder=for scoping. Authorization-aware — only returns tags from visible alerts.
List filters and sorting
The existing GET /api/v2/{org}/alerts endpoint accepts new query parameters:
?priority=1,2or?priority=1&priority=2— filter by priority (OR semantics)?tags=prod,service:checkout— filter by tags (AND semantics)?sort_by=priority|name— sort column?sort_order=desc— sort direction
Last updated on
Alert History
Alert History records every alert evaluation in OpenObserve's triggers stream, letting you read status codes and retries and debug failed or skipped alerts.
Anomaly Detection
Anomaly Detection uses Random Cut Forest machine learning to flag unusual patterns in logs, metrics, and traces automatically, with no manual threshold tuning.