

Anomaly Detection
Anomaly Detection automatically identifies unusual patterns in your data streams using machine learning, alerting you to deviations before they become incidents.
Overview
Traditional threshold-based alerts require you to define exact conditions for every scenario. Anomaly Detection uses Random Cut Forest (RCF) algorithms to learn your data's normal behavior and flag statistical outliers automatically — no manual threshold tuning required.
Configure a detection rule on any logs, metrics, or traces stream. OpenObserve trains a model on your historical data, then runs periodic detection to surface anomalies and optionally send notifications.
Note
Anomaly Detection is available in OpenObserve Enterprise (self-hosted) edition.
Getting started
Prerequisites:
- OpenObserve Enterprise edition (not available in Cloud)
- At least one data stream with historical data for model training
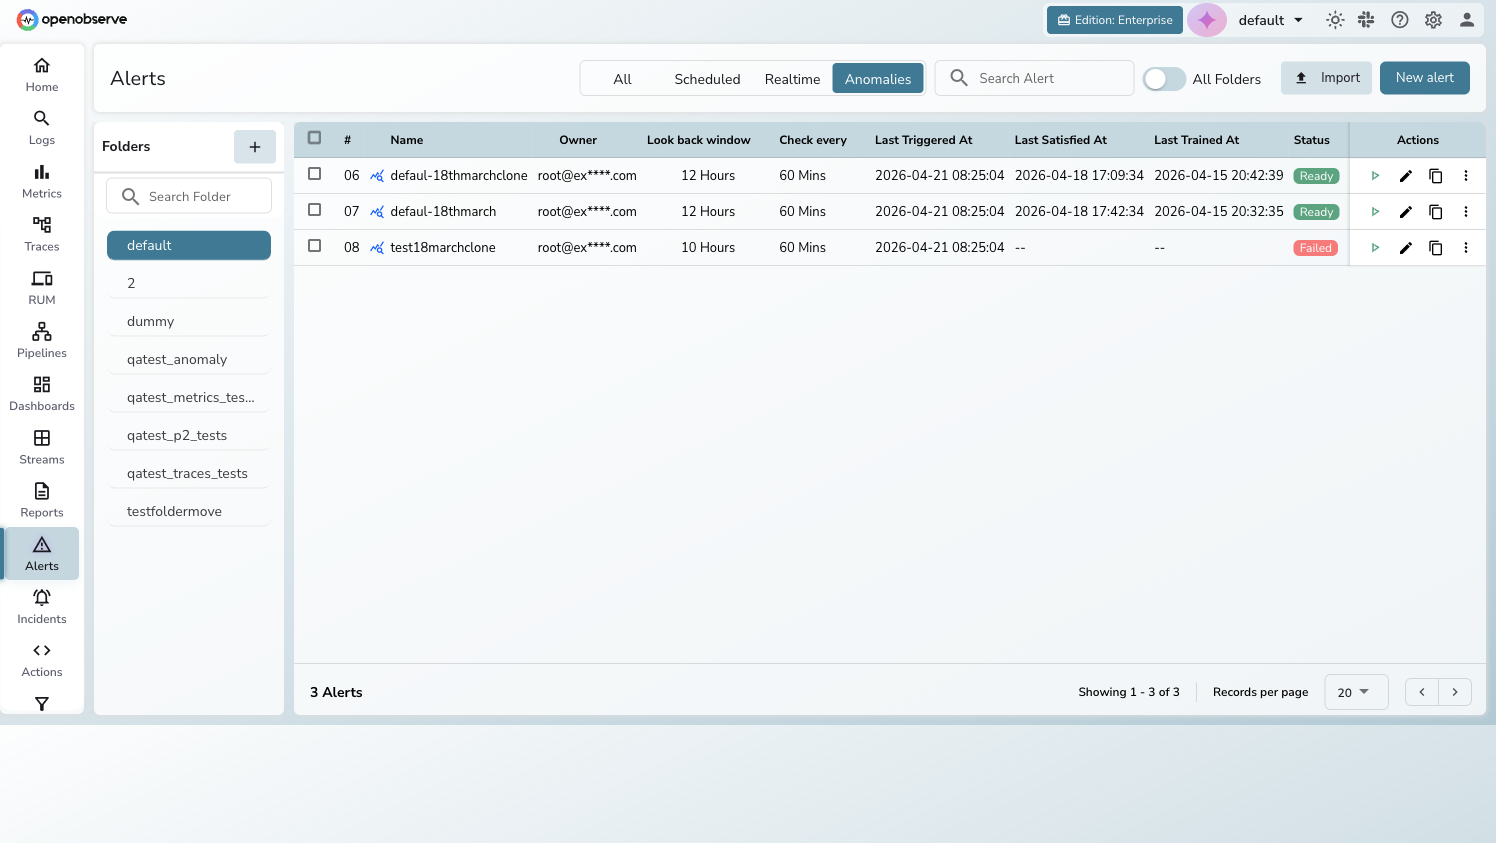
To access anomaly detection:
- Click Alerts in the left sidebar
- Click the Anomalies tab in the filter bar
- The list displays all anomaly detection rules for the current organization
The alerts list can be filtered by type using the tabs: All / Scheduled / Realtime / Anomalies.
Key features
Model training and retraining
OpenObserve trains a Random Cut Forest (RCF) model on historical data from your selected stream. You control the training window (minimum 1 day) and the system automatically detects seasonality patterns:
- Less than 7 days: hour-of-day seasonality
- 7 days or more: hour-of-day + day-of-week seasonality
Automatic retraining keeps the model current. Set a retraining interval (1, 7, or 14 days) or choose Never to train once and retrain manually.
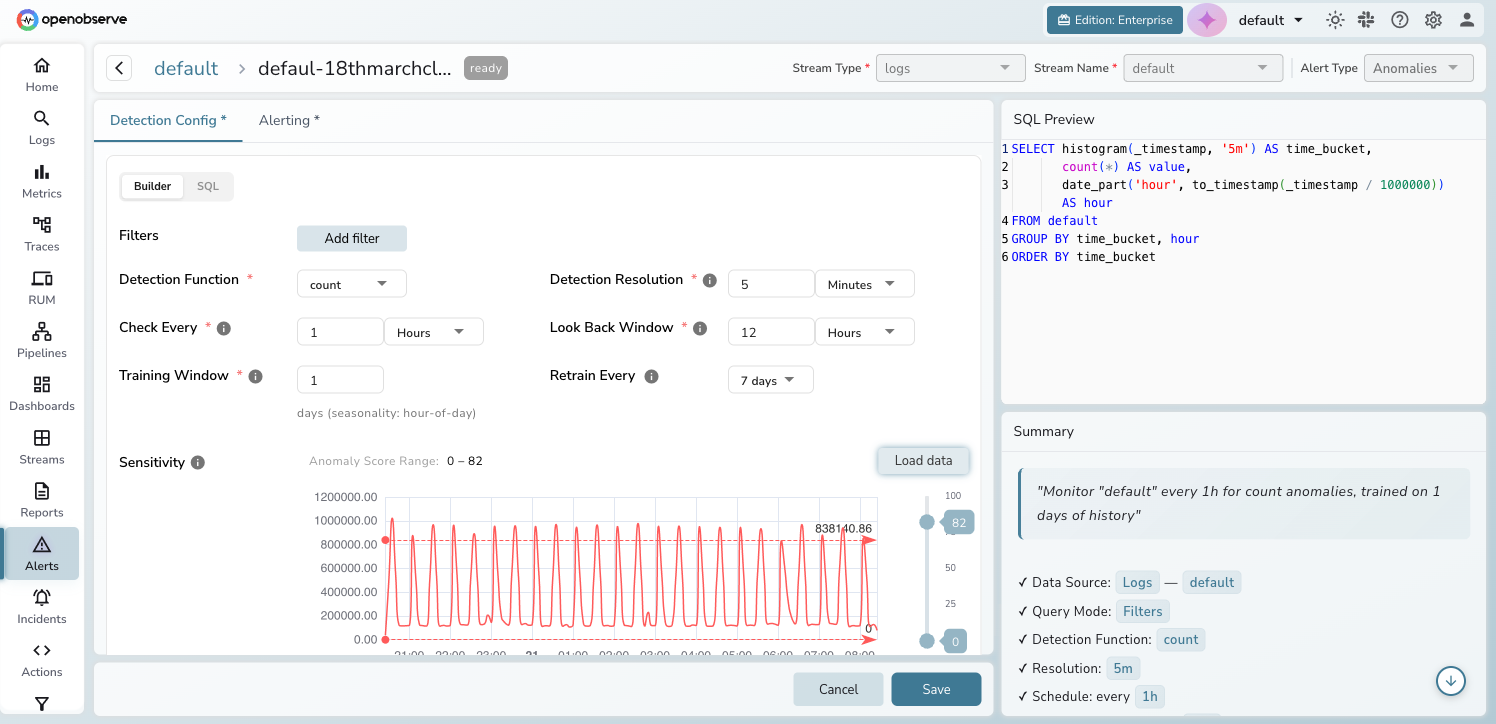
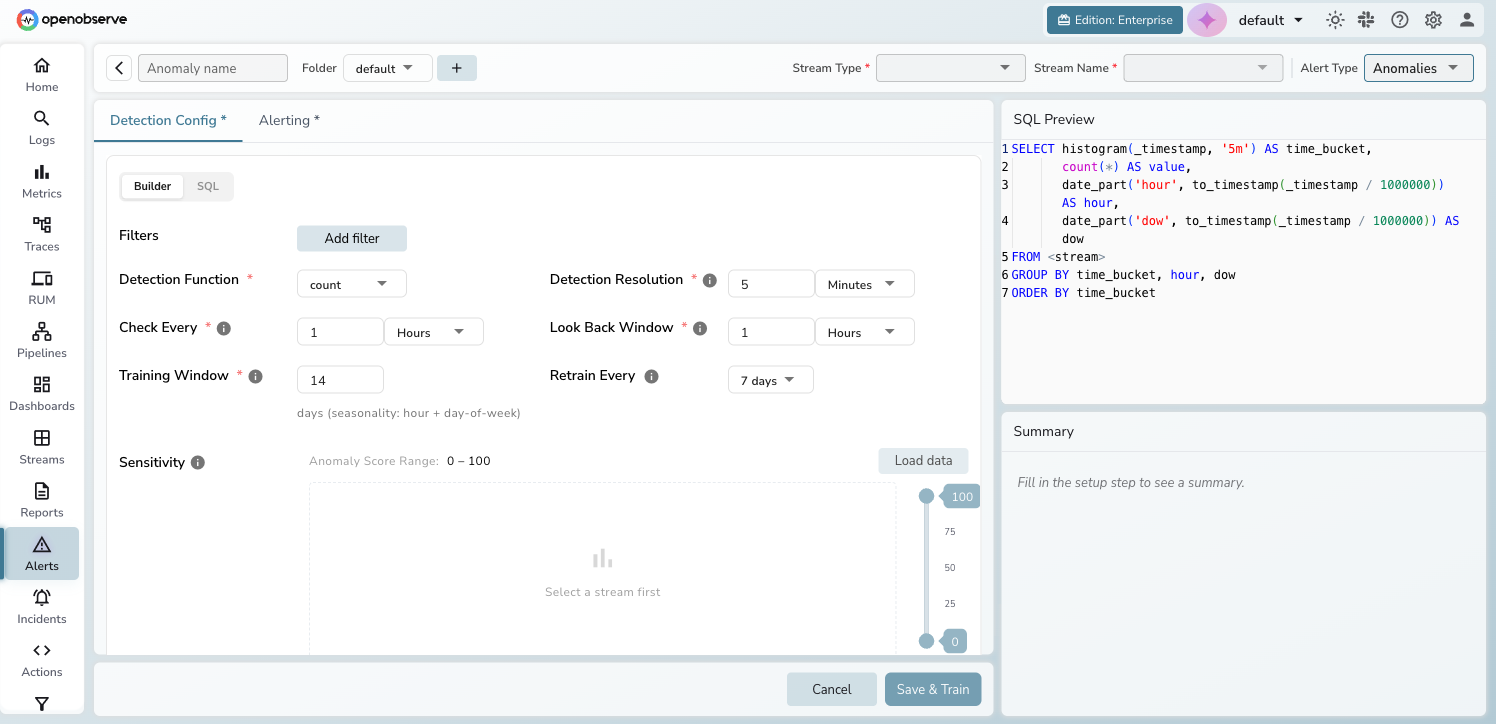
Detection configuration
The Detection Config tab provides a full configuration wizard:
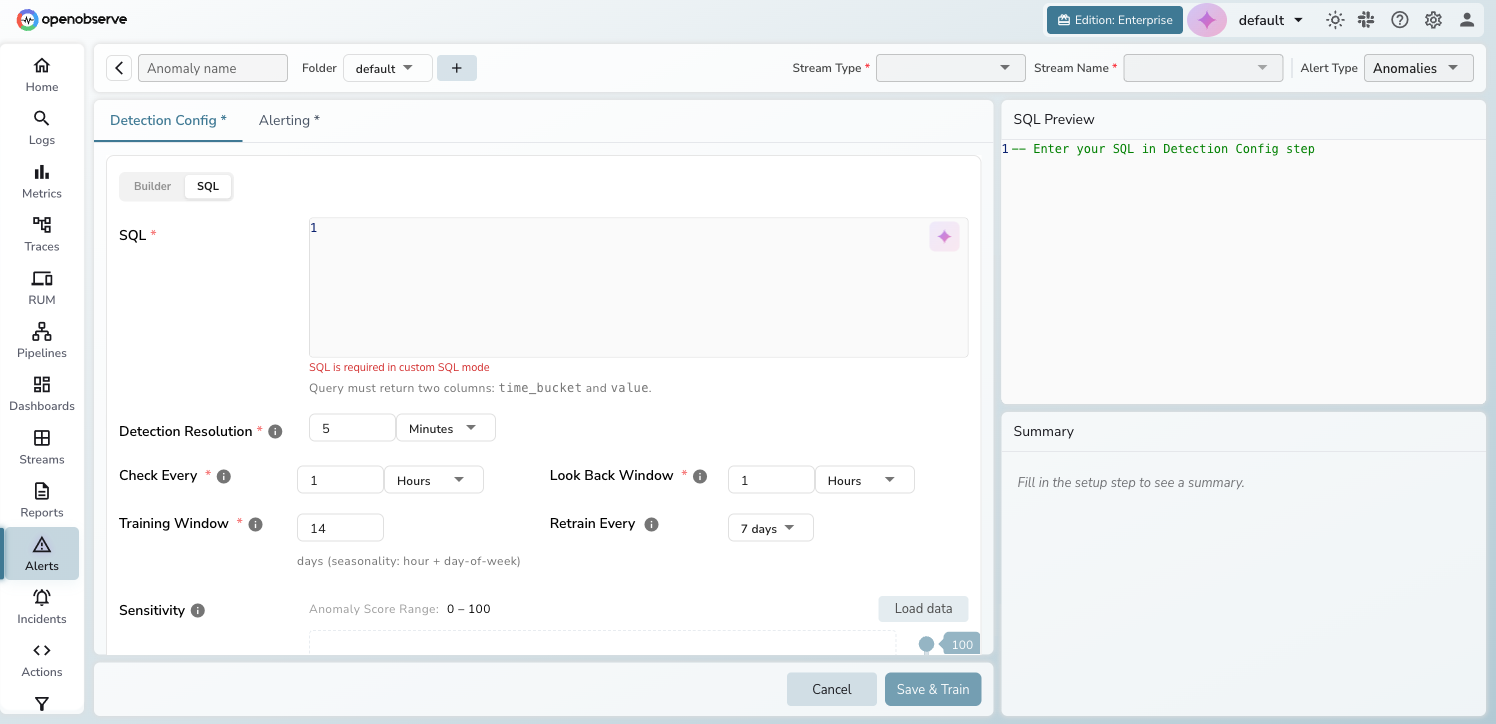
- Query mode — choose Builder (visual filter-based) or SQL (custom query returning
time_bucketandvaluecolumns) - Detection function — aggregate data using
count,avg,sum,min,max,p50,p95, orp99 - Detection resolution — granularity of data bucketing (e.g., 5 minutes)
- Check every — how often the detection job runs
- Look back window — how far back each detection run queries
In SQL mode, the query editor replaces the visual builder. Your query must return exactly two columns: time_bucket and value.
Sensitivity tuning
The sensitivity section displays a time series preview of your historical data. Use the Anomaly Score Range control, a chart with a dual-handle slider (0–100), to tune sensitivity. Points with anomaly scores outside the selected range do not trigger alerts. Narrow the range to flag only the most extreme outliers; widen it to flag more points.
Click Load Data to preview the time series and visually adjust the range. The Load Data button is only available after the rule is first saved (its tooltip reads "Available after saving").
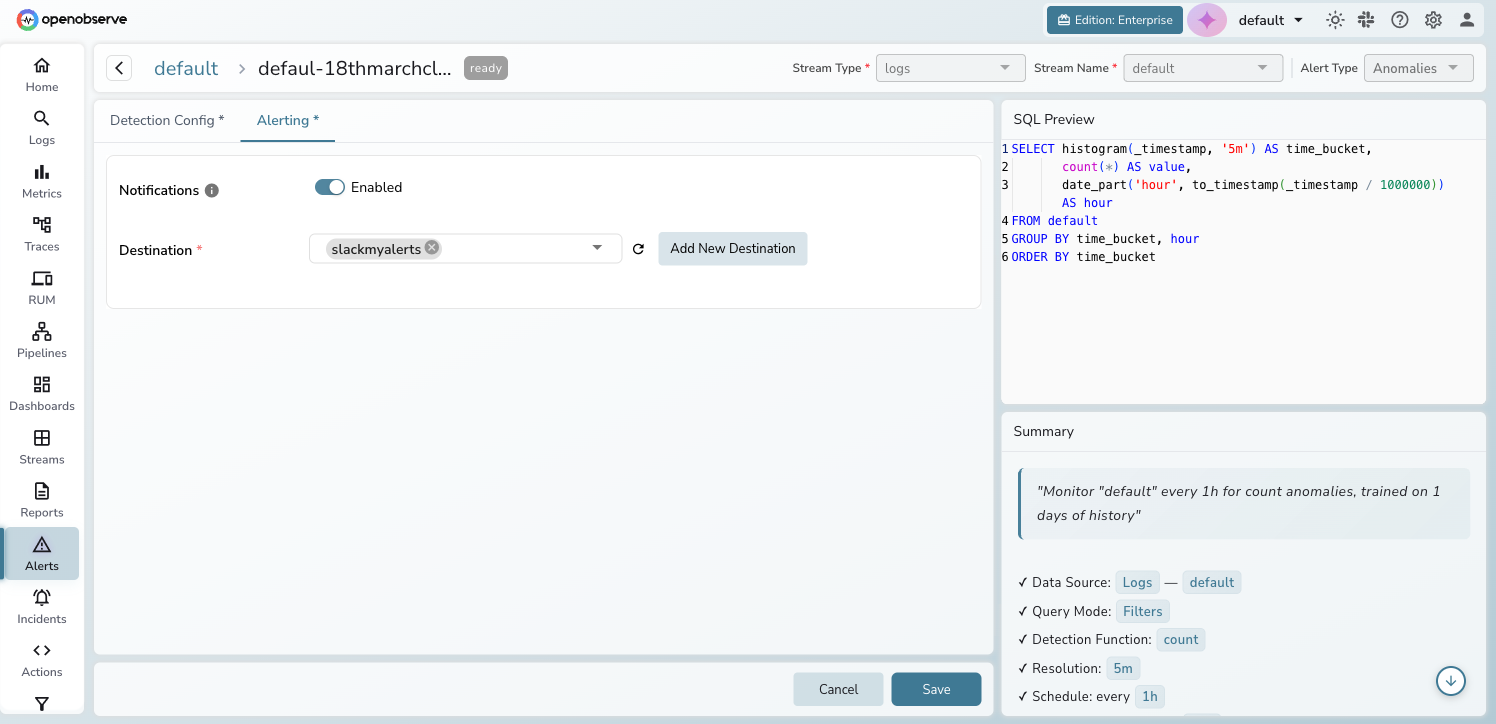
Alerting and notifications
The Alerting tab configures what happens when anomalies are detected:
- Notifications toggle — enable or disable alert notifications
- Destination selector — choose one or more destinations (Slack, email, webhook, etc.)
Info
Anomaly detection results are always written to the _anomalies stream, even when notifications are disabled. You can query this stream directly for analysis.
Status lifecycle
Each anomaly detection rule progresses through a status lifecycle:
| Status | Description |
|---|---|
| Waiting | Initial state — awaiting first training |
| Training | Model training in progress (spinner visible) |
| Ready | Model trained and detection running on schedule |
| Failed | Training failed — hover over the status badge to see the error |
Create an anomaly detection rule
-
Navigate to Alerts > Anomalies and click New alert.
-
Enter a name, select the Stream Type (Logs, Metrics, or Traces) and Stream Name.
-
On the Detection Config tab, configure your query:
- In Builder mode, add filters and select a detection function
- In SQL mode, write a query that returns
time_bucketandvaluecolumns
-
Set the Detection Resolution, Check Every interval, and Look Back Window.
-
Set the Training Window (days of historical data) and Retrain Every interval.
-
After saving the rule, click Load Data to preview the time series, then use the Anomaly Score Range slider (0–100) to tune which anomaly scores trigger alerts. (The Load Data button is only available after the rule is first saved.)
-
Switch to the Alerting tab to enable notifications and select destinations.
-
Click Save & Train to create the rule and start model training.
Tip
Start with a training window of 7–14 days for best seasonality detection. Use a shorter window (1–3 days) for fast-changing data patterns.
Manage anomaly detection rules
From the Anomalies list, use the three-dot action menu on each row:
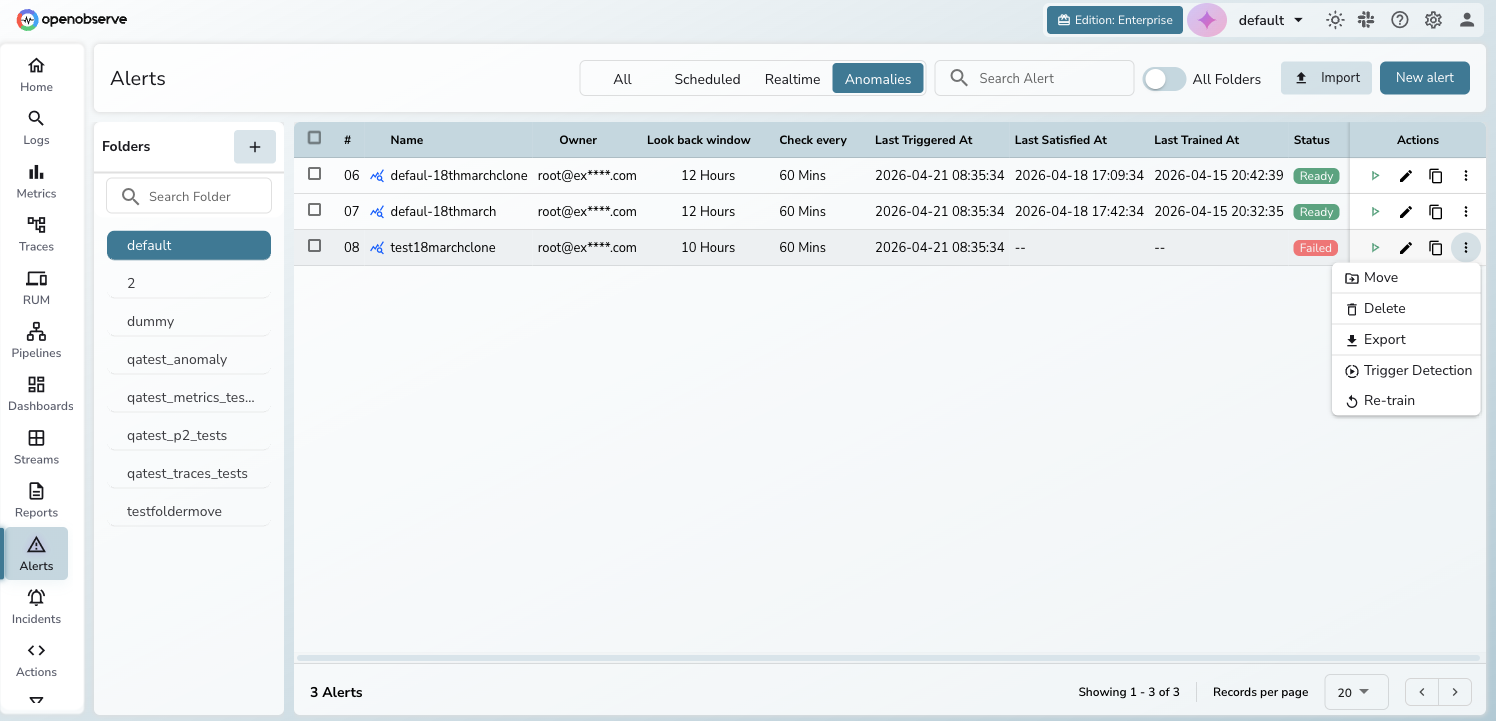
- Pause/Resume — temporarily stop or restart detection without deleting the model
- Retrain — trigger manual retraining (replaces the existing model once complete)
- Stop Training — cancel an in-progress training job
- Retry — retry training after a failure (the error message is shown in the dialog)
- Edit — modify the detection configuration, schedule, or alerting settings
- Clone: create a copy of the rule; the clone starts untrained with counters reset
- Delete — permanently remove the rule and its trained model