

Scheduled Alerts
Create a scheduled alert
Scheduled alerts evaluate your data at regular intervals and trigger when conditions are met. This is the most common alert type.
Prerequisites
- At least one data stream (logs, metrics, or traces) with ingested data
- At least one notification destination configured
- Appropriate permissions to create alerts
Step 1: Open the alert form
- Go to Alerts in the left sidebar.
- Click New alert in the top-right corner.
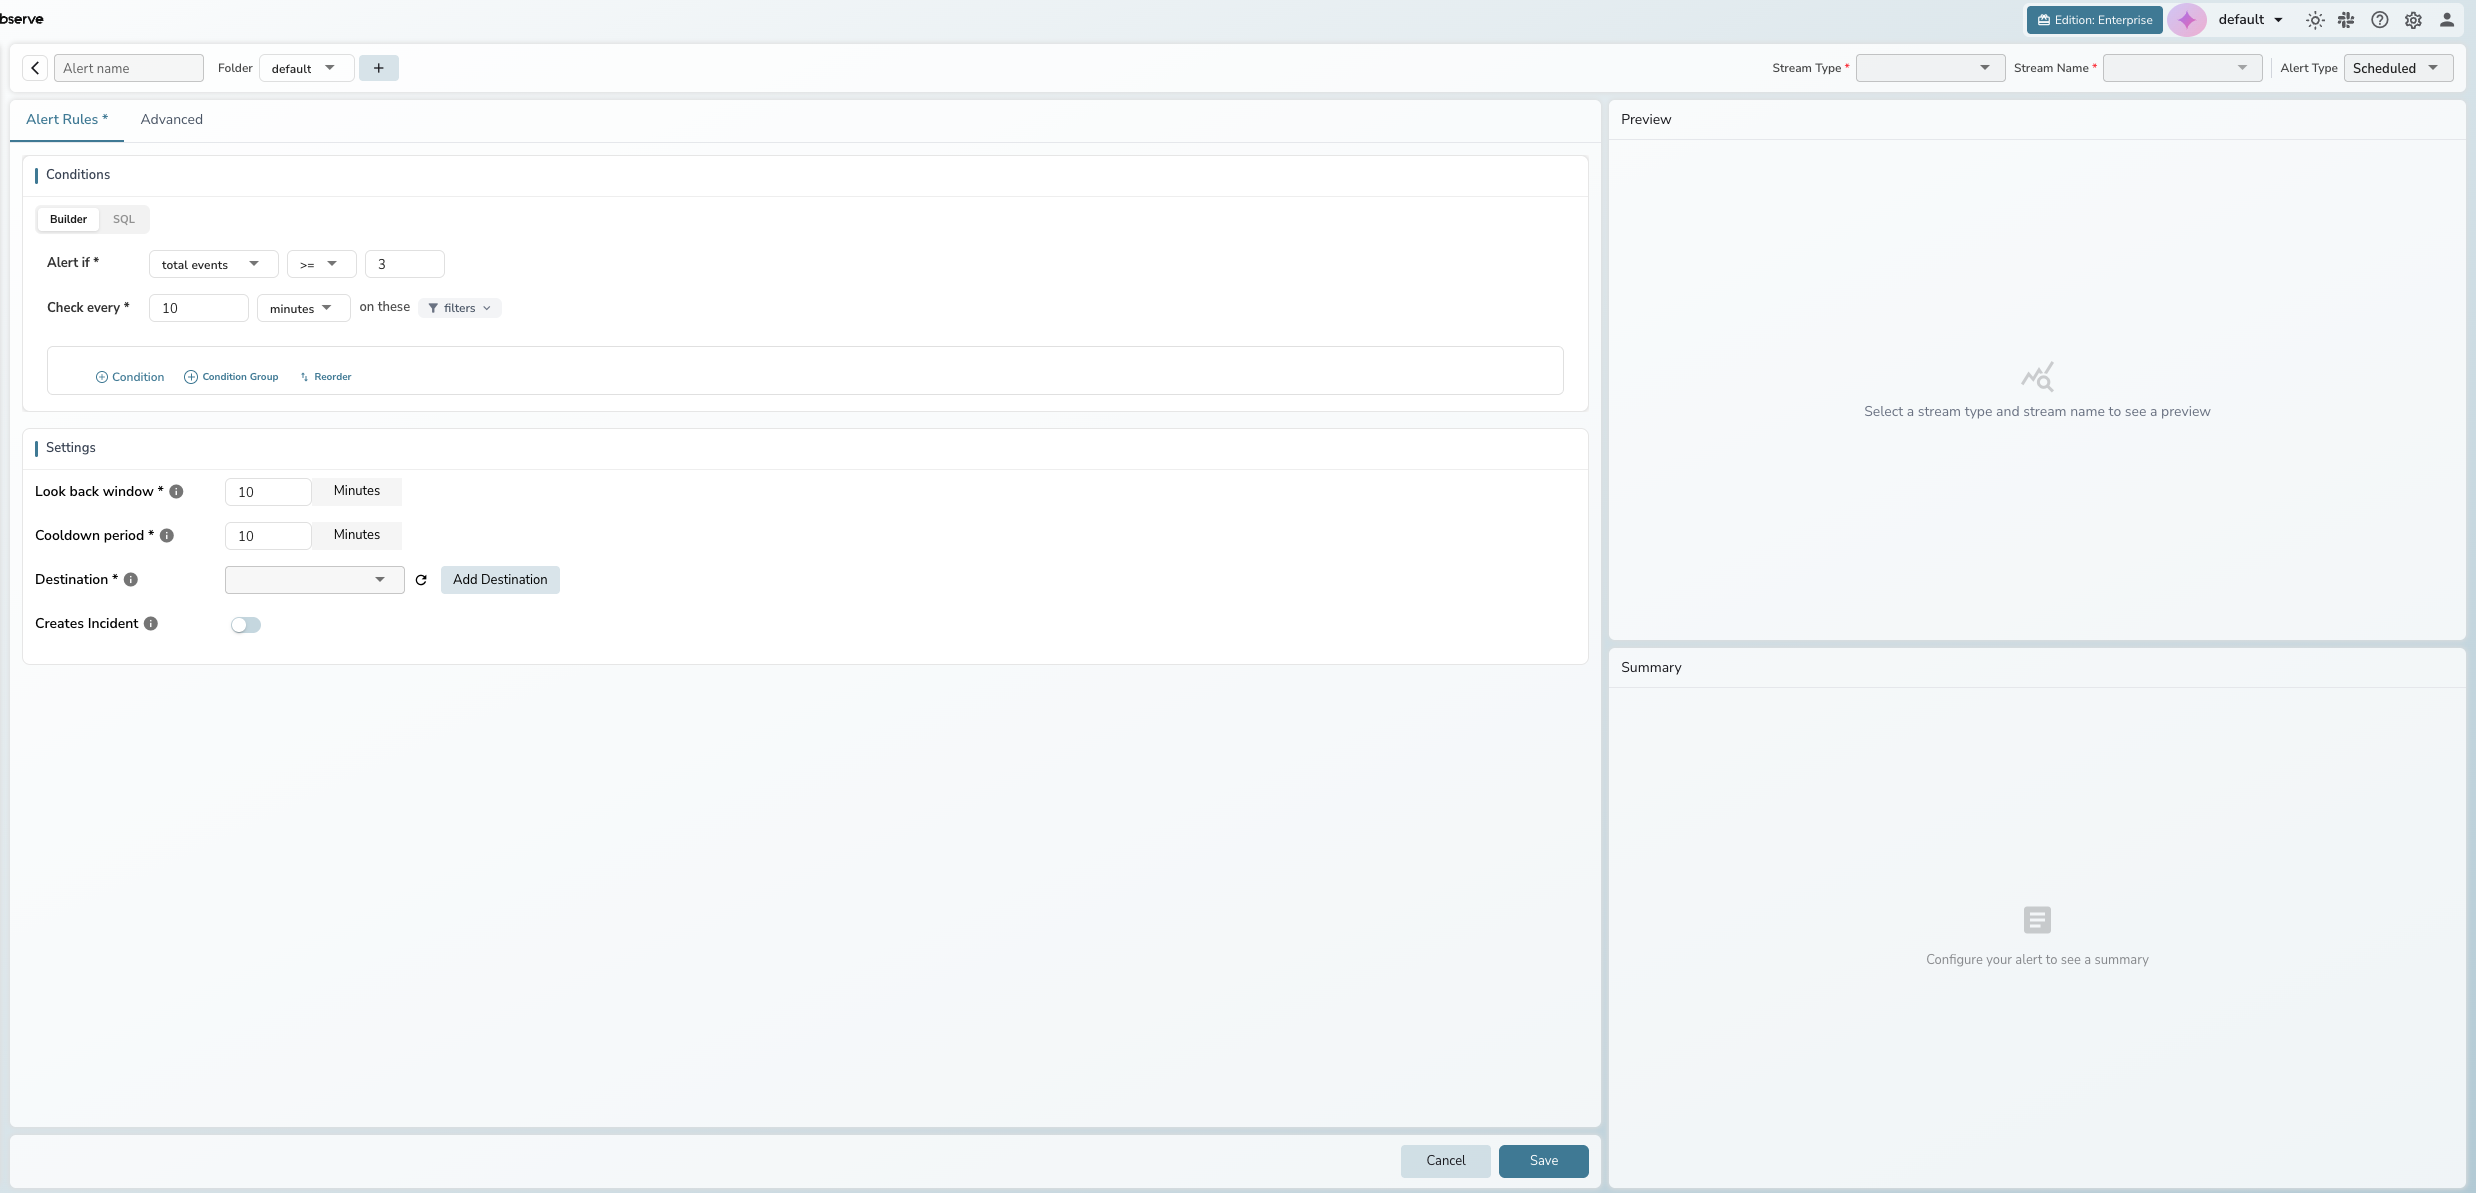
Step 2: Configure the top bar
Fill in the required fields across the top bar:
- Alert name: Enter a descriptive name (e.g., "High Error Rate - Production"). Alert names cannot contain spaces or the characters
: # ? ' " % & /. Use underscores (_) instead. - Folder: Select a folder to organize the alert, or click + to create a new one
- Stream Type: Select logs, metrics, or traces
- Stream Name: Select the data stream to monitor
- Alert Type: Leave as Scheduled (default)
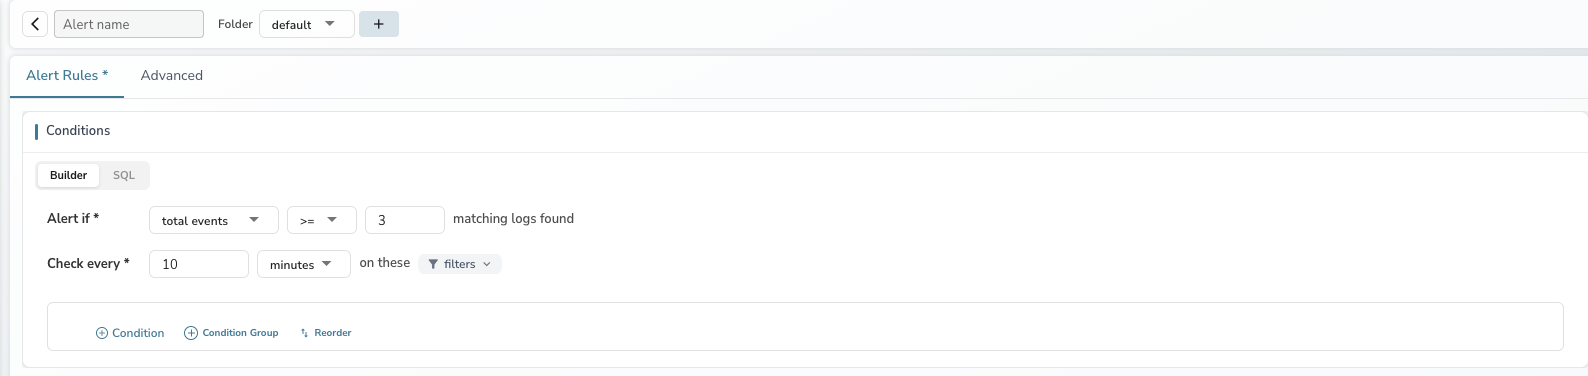
Step 3: Define the condition
The Conditions section on the Alert Rules tab shows the condition sentence. By default, it uses count mode:
"Alert if total events >= 3 matching logs found"
Configure the condition:
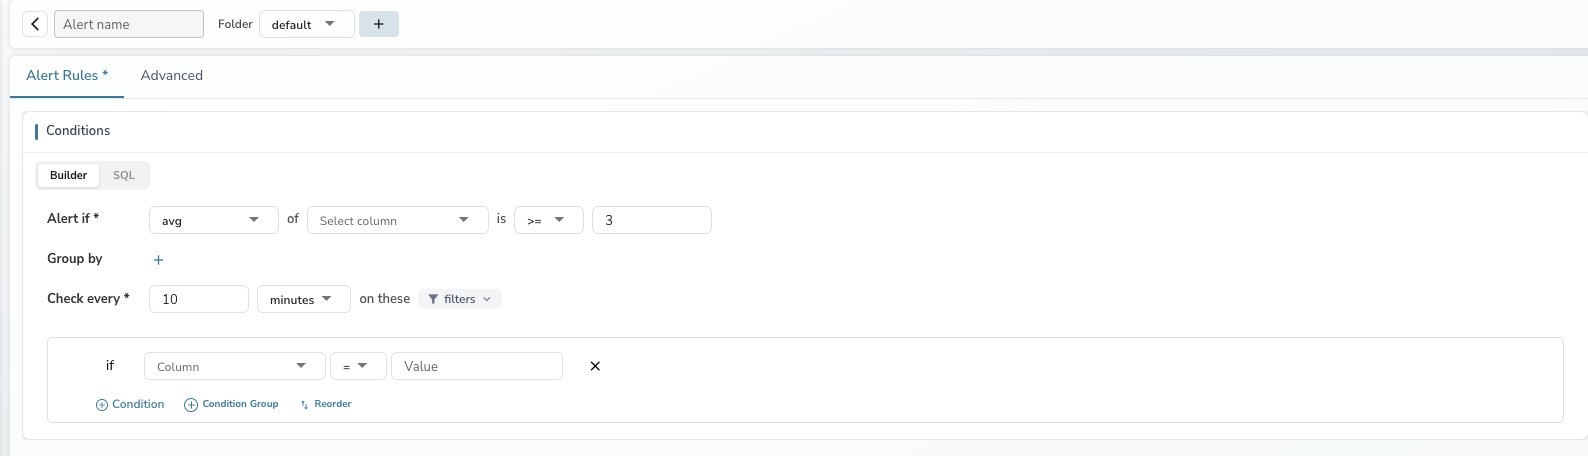
- Function: Select from the dropdown — total events for count mode, or an aggregation (avg, min, max, sum, median, p50–p99) for measure mode
- Operator: Choose the comparison operator (>=, >, <=, <, =, !=)
- Threshold: Set the value that triggers the alert
Tip: See Alert Conditions and Filters for a detailed explanation of count mode vs. measure mode and all available functions.
Step 4: Set the evaluation schedule
- Check every: Enter the frequency in minutes (default: 10). You can switch to a cron expression for precise scheduling using the dropdown next to the minutes input.
Note
When a scheduled alert uses a cron expression, its first (and every subsequent) run is the next time that matches the cron schedule in the configured timezone. It no longer fires immediately when you create, update, or enable the alert. With a non-cron Check every N minutes schedule, the alert still starts at the next interval boundary.
Step 5: Add filters (optional)
Click the filters dropdown next to "on these" to expand the filter section. Use filters to narrow which data the alert evaluates.
- Click + Condition to add a filter row.
- Select a field, operator, and value (e.g.,
level = error). - Additional conditions are joined with AND logic.
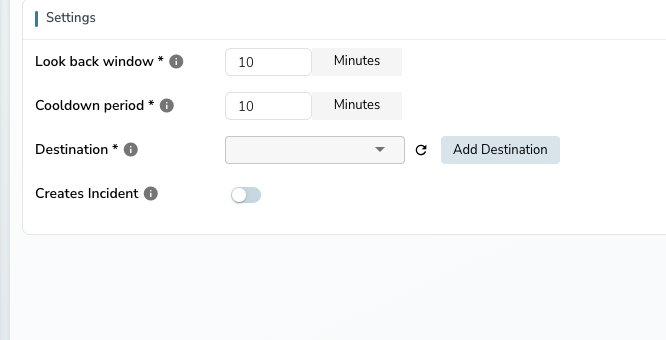
Step 6: Configure settings
Scroll down to the Settings section on the same Alert Rules tab:
- Look back window: Time range of data to evaluate each run (default: 10 minutes)
- Cooldown period: Minimum time between repeated notifications (default: 10 minutes)
- Destination: Select one or more notification destinations. Click the refresh icon to reload, or Add Destination to create a new one.
- Creates Incident: Toggle on to automatically create an incident when the alert triggers
Step 7: Save
Click Save at the bottom. OpenObserve validates all fields before saving. If validation fails, a red error indicator appears on the tab that contains the issue.
Tip: Check the Preview panel on the right before saving. It shows whether your current conditions would trigger based on recent data.
Create a SQL alert
For complex queries that go beyond the visual builder, use SQL mode.
Step 1: Switch to SQL mode
After configuring the top bar (steps 1–2 above), click the SQL tab in the Conditions section.
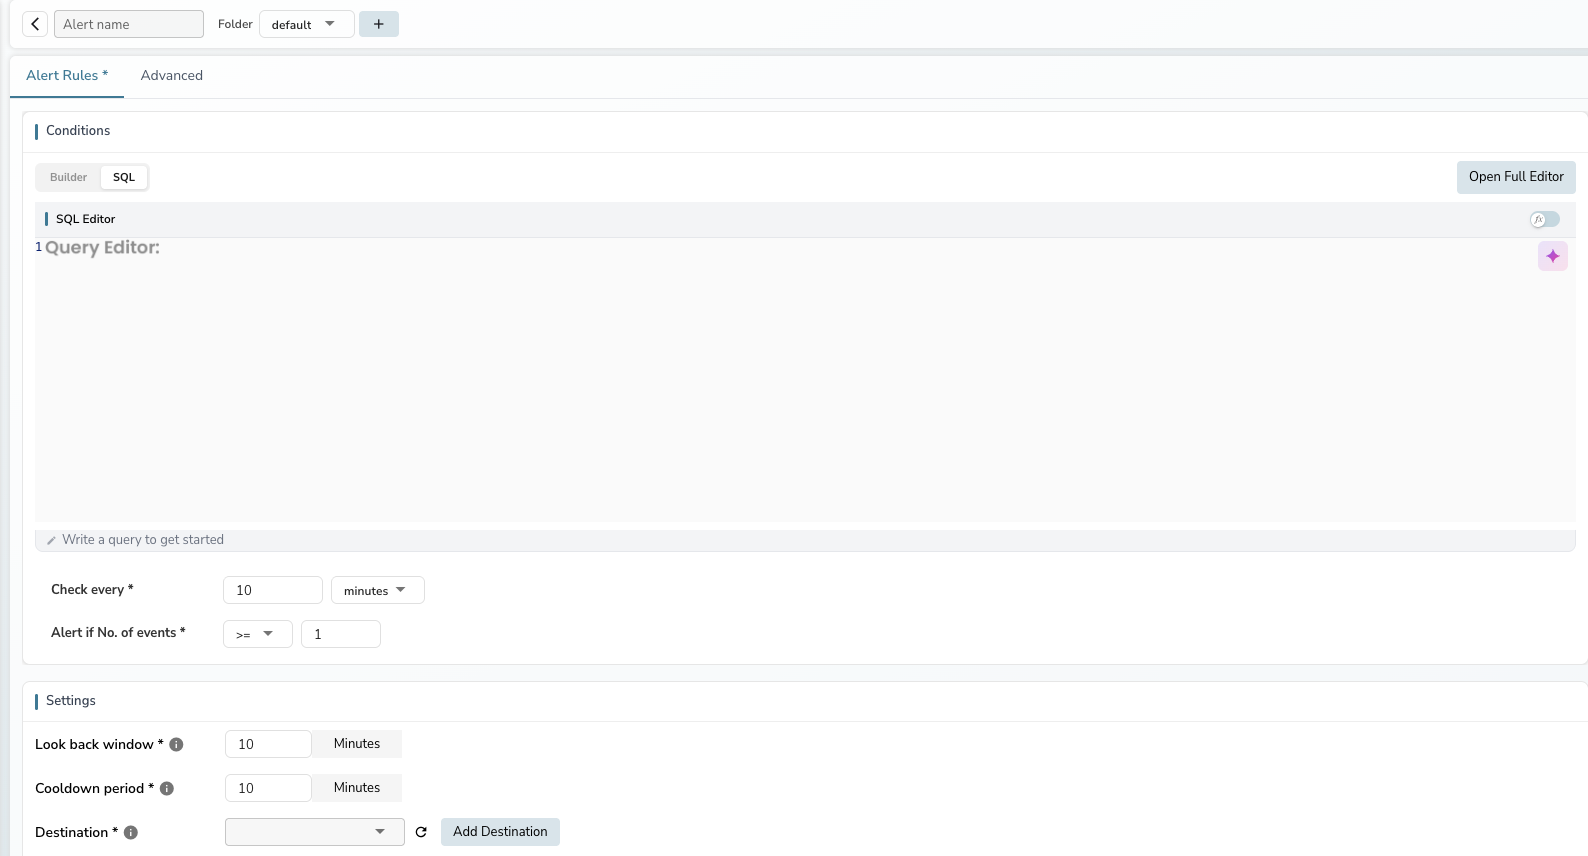
Step 2: Write the query
Enter a SQL query in the inline editor, or click Open Full Editor for a full-screen editing experience with:
- A field browser on the left for reference
- AI assistance for query suggestions
- Query results preview on the right
Warning
Queries using SELECT * are not allowed for scheduled alerts. Specify the columns you need.
Step 3: Set the threshold
Below the SQL editor, configure:
- Check every: Evaluation interval in minutes
- Alert if No. of events: Set the operator and threshold for the number of rows the query returns
Step 4: Complete settings and save
Scroll down to configure Settings (look back window, cooldown period, destinations) and click Save.
Configure advanced settings
The Advanced tab provides additional options for scheduled alerts. Click Advanced next to the Alert Rules tab.
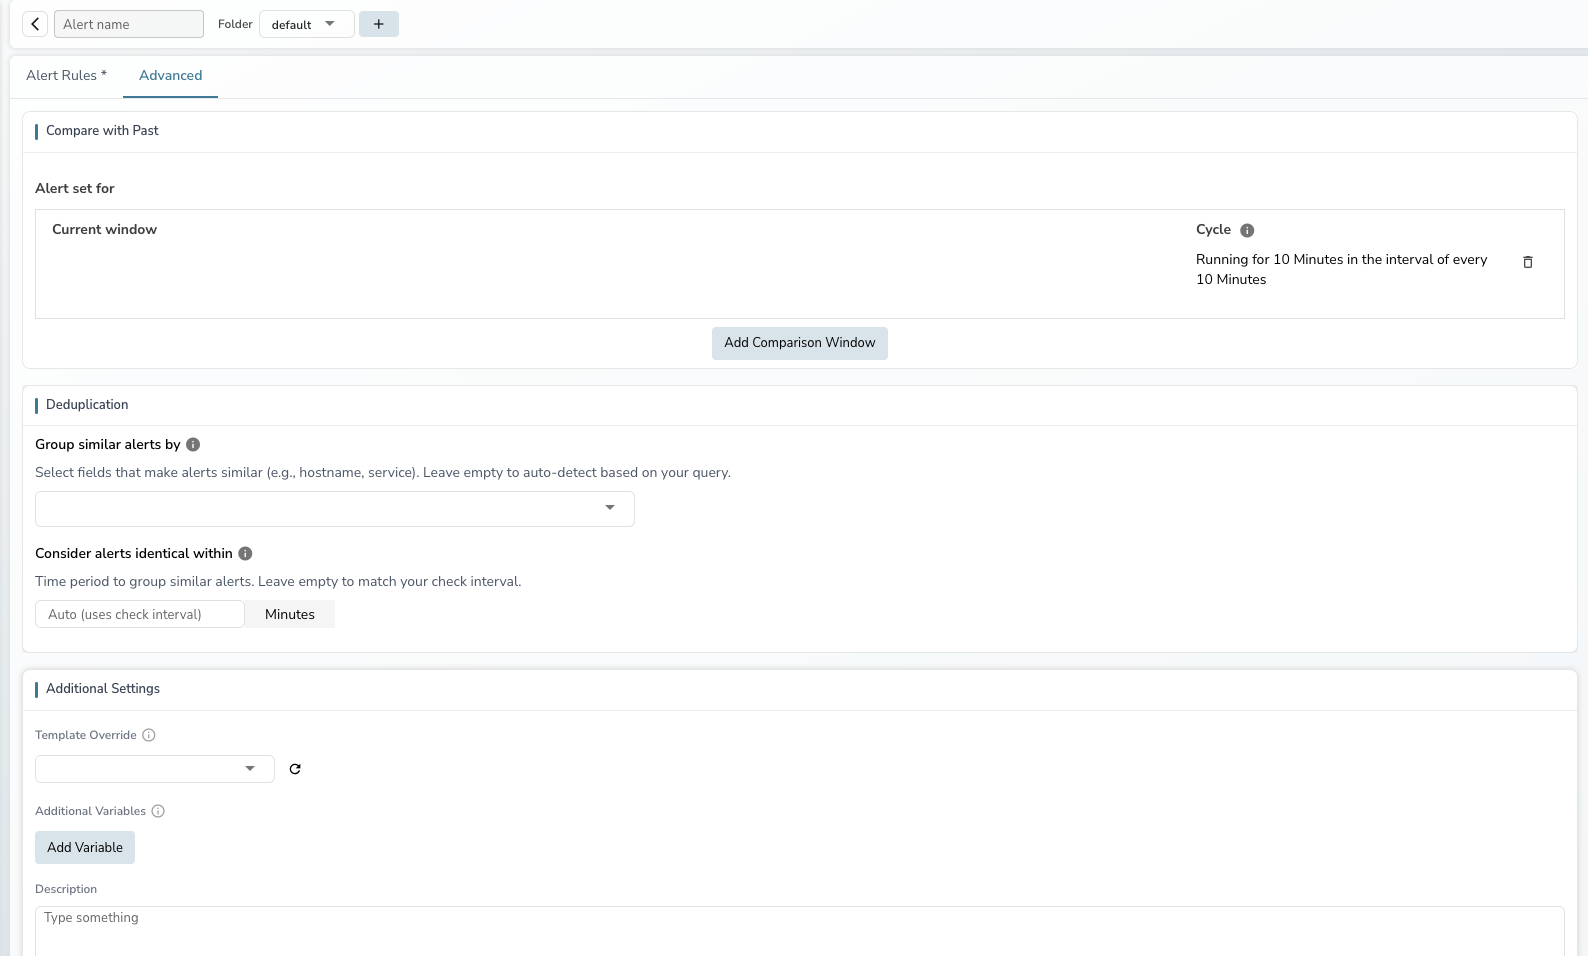
Compare with past
Compare current evaluations against historical data to detect relative changes rather than absolute thresholds.
The Multi-window Selector lets you compare current data with historical data in scheduled alerts. Instead of alerting on absolute thresholds, you can detect relative changes — like a 5% increase in errors compared to the same time yesterday.
Why use multi-window comparison
A single data point rarely tells you if something is wrong. If your system sees 200 checkout retries in the last 30 minutes, that could be normal or a serious spike — it depends on what the same period usually looks like.
The Multi-window Selector automates this comparison by:
- Defining the time window to monitor (e.g., last 30 minutes)
- Selecting one or more past windows to compare against (e.g., 1 day ago)
- Writing VRL logic that compares windows and detects meaningful changes
You can apply this to logs, metrics, or traces.
Key concepts
Period: The length of each window. If the period is 30 minutes, the alert evaluates 30 minutes of data each run.
Window: Applies the period at different points in time:
- Current window: The last 30 minutes
- Past window (1 day ago): The same 30-minute range from yesterday
Frequency: How often the alert runs. If frequency is 30 minutes with a 30-minute period and a 1-day-ago past window:
| Run time | Current window | Past window |
|---|---|---|
| 10:30 AM | 10:00–10:30 AM today | 10:00–10:30 AM yesterday |
| 11:00 AM | 10:30–11:00 AM today | 10:30–11:00 AM yesterday |
How it works
When a scheduled alert with Multi-window Selector runs:
- The alert manager executes your SQL query for each window (current + past windows)
- Results are passed to your VRL function for comparison
- The VRL output is checked against your threshold condition
- If the condition is met, a notification is sent
Step-by-step setup
Access the Multi-window Selector
For new alerts:
- Go to Alerts and click New alert
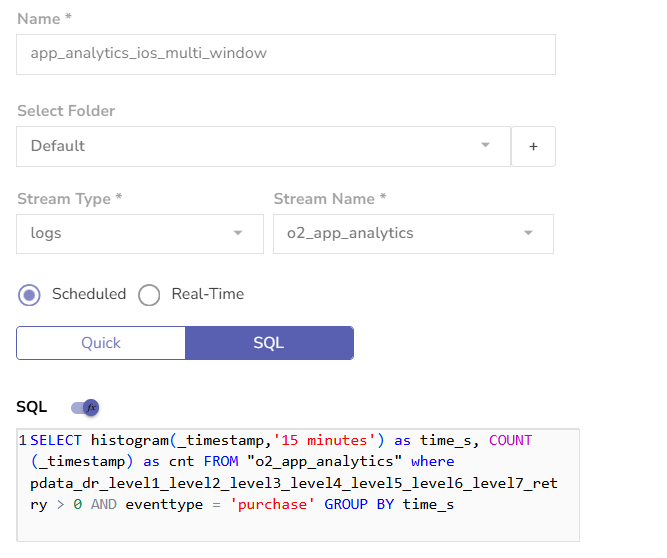
- Configure the top bar (stream type, stream name, alert type = Scheduled)
- Switch to SQL mode in the Conditions section
- Click the Advanced tab to find the Compare with Past section
For existing alerts, click the alert name in the alerts list, then navigate to the Advanced tab.
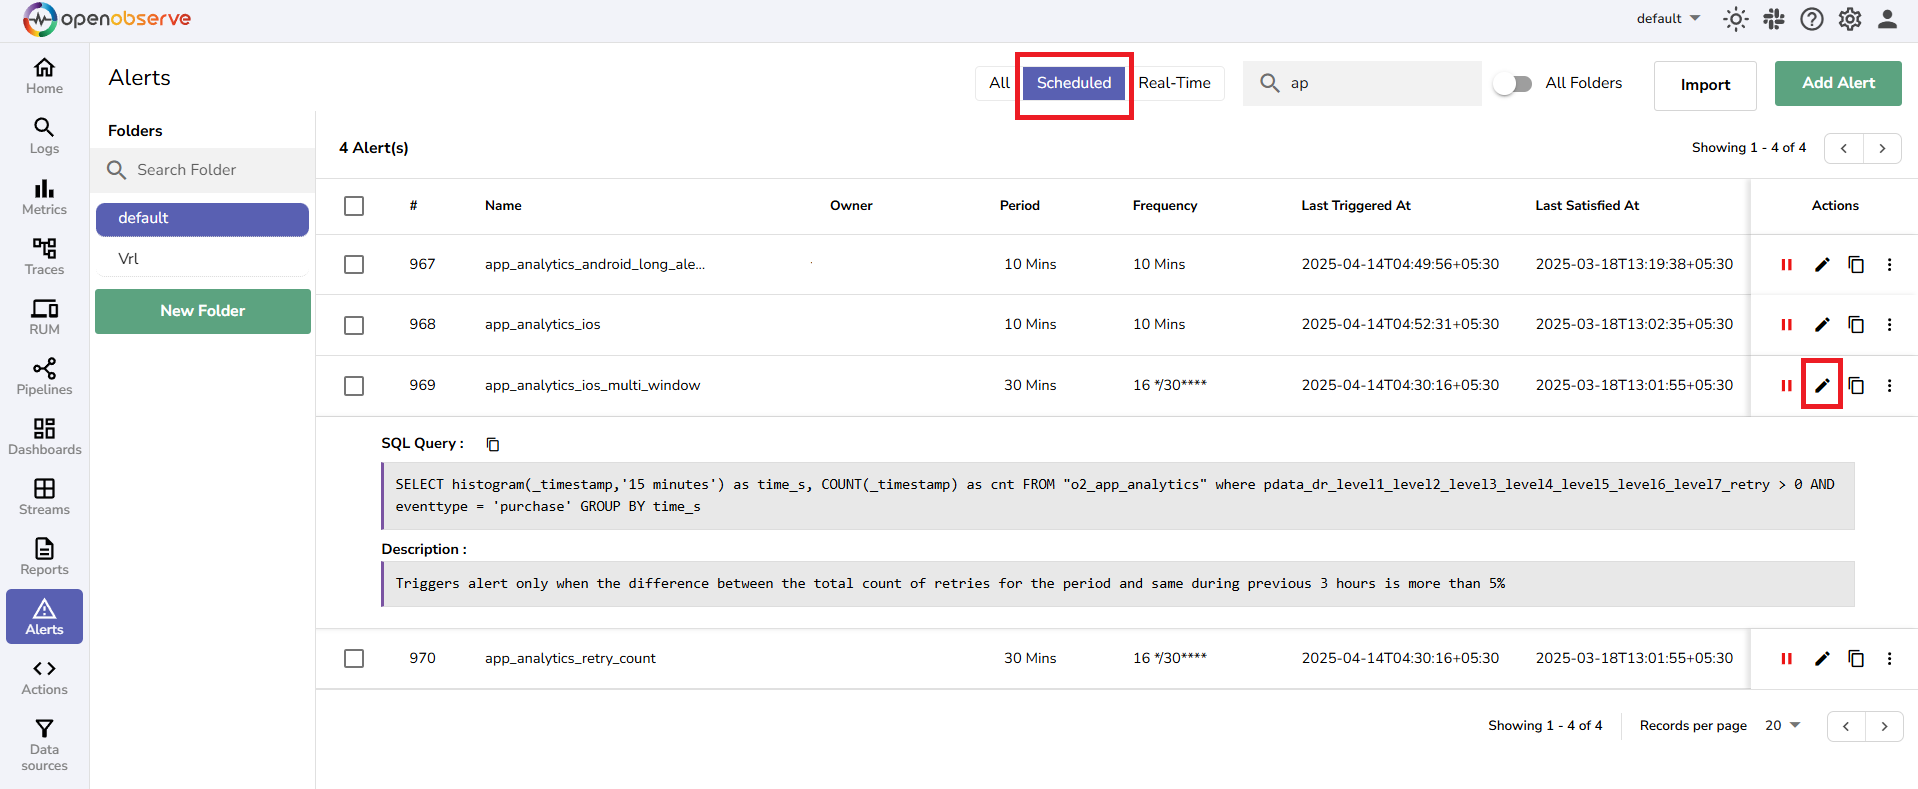
Step 1: Write the SQL query
Write a SQL query that returns the data you want to compare. Use the Logs page to test your query first.
SELECT
  histogram(_timestamp, '15 minutes') AS time_s,
  COUNT(_timestamp) AS cnt
FROM
  "openobserve_app_analytics_log_stream"
WHERE
  pdata_dr_level1_level2_level3_level4_level5_level6_level7_retry > 0
  AND eventtype = 'purchase'
GROUP BY
  time_s
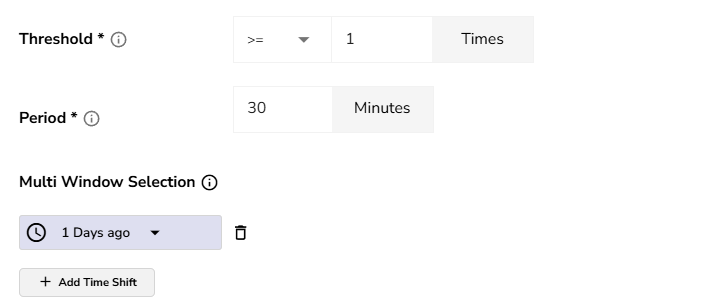
Step 2: Define the period
Set the time range to evaluate per run (e.g., last 30 minutes) in the Compare with Past section on the Advanced tab.
Step 3: Add a comparison window
Click Add Comparison Window and select the historical window to compare against (e.g., 1 day ago).
The alert manager will run two queries at runtime:
- Current window (e.g., 9:30–10:00 AM today)
- Past window (e.g., 9:30–10:00 AM yesterday)
Step 4: Write the VRL function
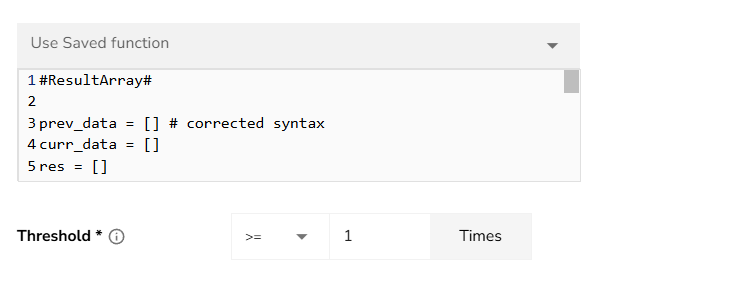
Click the function toggle in the SQL editor to write VRL logic that compares the windows.
Warning
Always start your VRL function with #ResultArray# when using Multi-window Selector. This ensures your function receives a multi-dimensional array where result[0] = current window and result[1] = past window.
VRL function example — alert if purchase retries increased by more than 5%:
#ResultArray#

prev_data = []
curr_data = []
res = []
result = array!(.)

if length(result) >= 2 {
    today_data = result[0]
    yesterday_data = result[1]

    cnt_yesterday = 0.0
    cnt_today = 0.0

    for_each(array!(yesterday_data)) -> |index, p_value| {
        cnt_yesterday, err = cnt_yesterday + p_value.cnt
    }

    for_each(array!(today_data)) -> |index, p_value| {
        cnt_today, err = cnt_today + p_value.cnt
    }

    if cnt_yesterday > 0.0 {
        diff = cnt_today - cnt_yesterday
        diff_percentage, err = (diff) * 100.0 / cnt_yesterday

        if diff_percentage > 5.0 {
            diff_data = {
                "diff": diff,
                "diff_percentage": diff_percentage
            }
            temp = []
            temp = push(temp, diff_data)
            res = push(res, temp)
        }
    }
}

. = res
.
The VRL function outputs an empty array if the increase is 5% or less, or a non-empty array with the diff data if it exceeds 5%.
Step 5: Set the threshold
Set Alert if No. of events >= 1. This triggers when the VRL output is non-empty (meaning the condition was met).
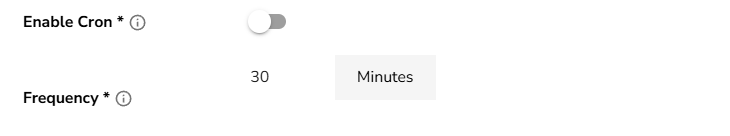
Step 6: Set the frequency
Define how often the alert runs (e.g., every 30 minutes).
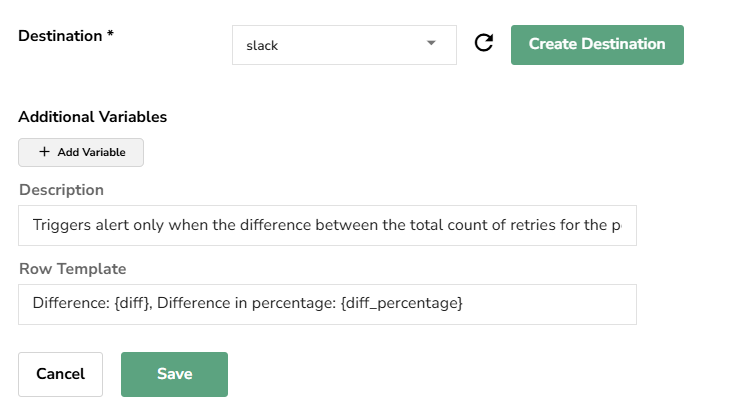
Step 7: Configure destination and save
Select a destination, optionally add a row template with fields from your VRL output (e.g., {{ diff_percentage }}), and click Save.
FAQ
Does the period control the window length?
Yes. Every window — current and past — uses the same duration defined by the period.
Does the alert manager run multiple queries within one window?
No. It runs one query per window. Frequency controls when the queries run; period controls what time range each query covers.
What happens without #ResultArray# in the VRL function?
The VRL function receives a flat array with all results mixed together. You cannot distinguish current from past window data.
Deduplication
Group similar alerts to reduce notification noise.
- Group similar alerts by: Select fields that identify similar alerts (e.g.,
hostname,service). Leave empty for auto-detection based on the query - Consider alerts identical within: Time window for grouping similar alerts (default: matches the check interval)
Additional settings
- Template Override: Select a custom notification template to override the default
- Additional Variables: Add key-value pairs available in notification templates via the Add Variable button
- Description: Free-text description for the alert
- Row Template: Customize the format of individual data rows in notifications. Toggle between String and JSON template types
Edit an existing alert
- Go to Alerts in the left sidebar.
- Click the alert name in the table to open it.
- Modify any fields. Note that Stream Type, Stream Name, and Alert Type are read-only for existing alerts.
- Click Save to apply changes.
Best practices
- Start with a generous threshold and tune it down once you understand your data patterns. This prevents alert fatigue from overly sensitive conditions.
- Use Group by fields in measure mode to create per-dimension alerts (e.g., per host) instead of creating separate alerts for each dimension.
- Set a Cooldown period of at least 10 minutes to avoid notification storms during sustained incidents.
- Use Deduplication in the Advanced tab to group related alerts and reduce noise.
- Add a meaningful Description so on-call engineers understand the alert's purpose without investigating the configuration.
- Use Compare with Past for alerts where relative change matters more than absolute values.
Troubleshooting
Alert not triggering
Problem: The alert does not fire when expected.
Solution:
- Check the Preview panel — it shows whether current data meets the condition.
- Verify the Stream Name has recent data within the look back window.
- Confirm the Look back window covers enough data.
- Check that the Threshold value is appropriate for your data volume.
- Ensure the alert is enabled in the alerts list (toggle in the Status column).
Too many notifications
Problem: The alert fires too frequently, causing notification fatigue.
Solution:
- Increase the Cooldown period to reduce notification frequency.
- Raise the Threshold value to only alert on more significant conditions.
- Enable Deduplication in the Advanced tab.
- Add more specific Filters to narrow the data the alert evaluates.
Validation errors when saving
Problem: Clicking Save shows errors or red indicators on tabs.
Solution:
- Check the tab with the red error indicator.
- Ensure all required fields are filled: alert name, stream type, stream name, and at least one destination.
- For SQL mode, verify the query does not use
SELECT *. - Ensure the threshold value is greater than 0.
Destination not appearing
Problem: A configured destination does not show in the dropdown.
Solution:
- Click the refresh icon next to the destination dropdown.
- Verify the destination exists in Alerts > Destinations.
- Click Add Destination to create one directly from the alert form.