Alert Calibration
Alert Calibration is a scheduled health check for your alerts. It reads how each alert behaved over a time window (how often it fired, failed, or delivered its notification) and lists the alerts that need attention, with a suggested fix for each. It only suggests: nothing is changed automatically, and it sends no notifications.
Note
Alert Calibration is available in OpenObserve Enterprise and Cloud editions. The feature is in beta.
To open it, go to Reliability > Alert Calibration.
Turn it on
Alert Calibration runs per organization. Until an organization has settings, the page says Alert calibration is not running for this organization.
- Go to Reliability > Alert Calibration and click Configure.
- Turn on Run alert calibration for this organization.
- Set Run every, between 1 hour and 30 days. The default is 1 day.
- Set Analysis window, how far back each run looks, between 1 minute and 90 days. The default is 30 days.
- Click Save.
The first run is due as soon as you save with it turned on. Click Run now to bring the next run forward at any time. If a run is already due or in progress, the request joins it rather than starting another.
The form warns you about two settings that waste runs:
- Run every longer than Analysis window: the time between windows is never analyzed.
- Analysis window shorter than a rule needs (see the table below): every run declines that rule for every alert.
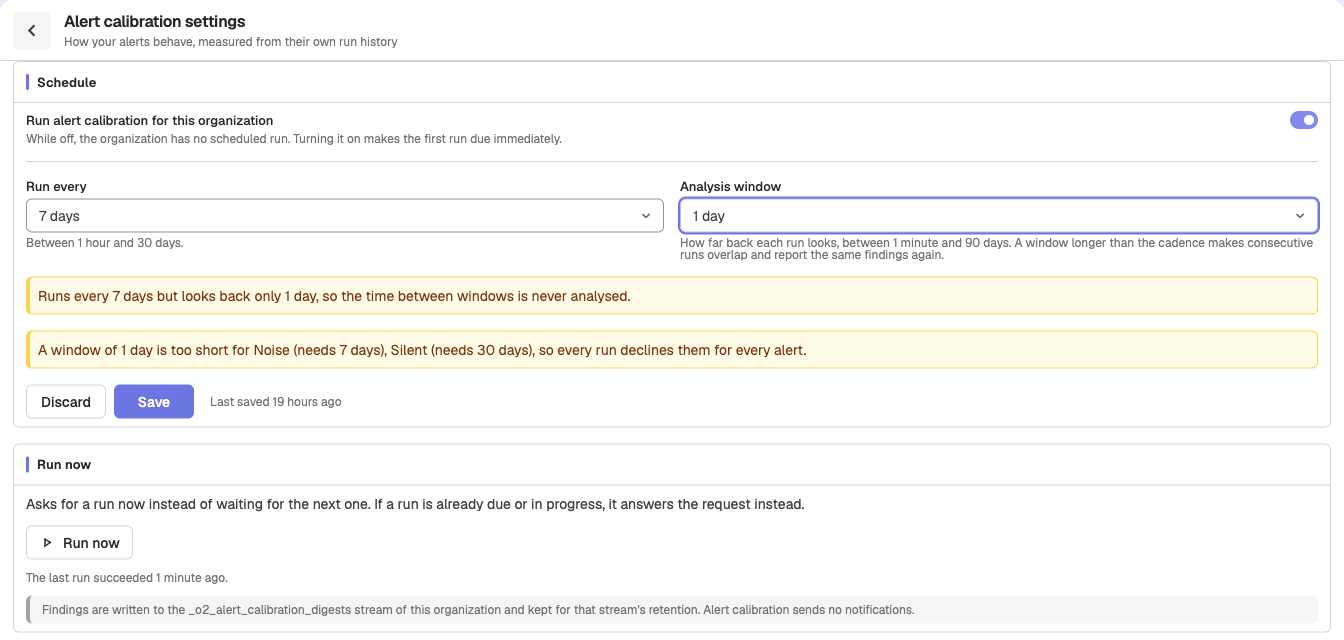
A window longer than the cadence is allowed, but consecutive runs overlap and report the same findings again.
What it checks
Each run applies these rules to every alert with run history in the window:
| Rule | Flags an alert that | Needs at least | Suggested fix |
|---|---|---|---|
| Failure | Fails to evaluate repeatedly: at least 5 errors and 10% of its evaluations | 1 day | Fix alert query |
| No destination | Fires but has no destination to notify | 1 hour | Attach destination |
| Noise | Fires often (20 or more times), returns to normal within about 5 minutes on average, and never led to an incident | 7 days | Raise threshold, Lengthen evaluation window, Enable deduplication |
| Notification failed | Fires, but its notifications keep failing to deliver: at least 3 failures and 5% of deliveries | 1 day | Repair destination |
| Silent | Evaluated at least 500 times, with errors in under 10% of them, and never fired, not even while muted by a downtime | 30 days | Review for deletion |
| Scheduler lag | (Cluster-wide) Alert evaluations started late or were skipped | none | Scale the alert scheduler: raise ZO_ALERT_SCHEDULE_CONCURRENCY, add alert nodes, or turn on ZO_SCHEDULER_PER_MODULE_PULLERS |
Scheduler lag looks at the whole cluster, so it is shown only in the _meta organization.
A rule also skips an alert with too few samples in the window. These skipped pairs are counted as Declined: a declined rule did not judge the alert, so it is not a clean result.
Read the results
The page has two tabs.
Dashboard
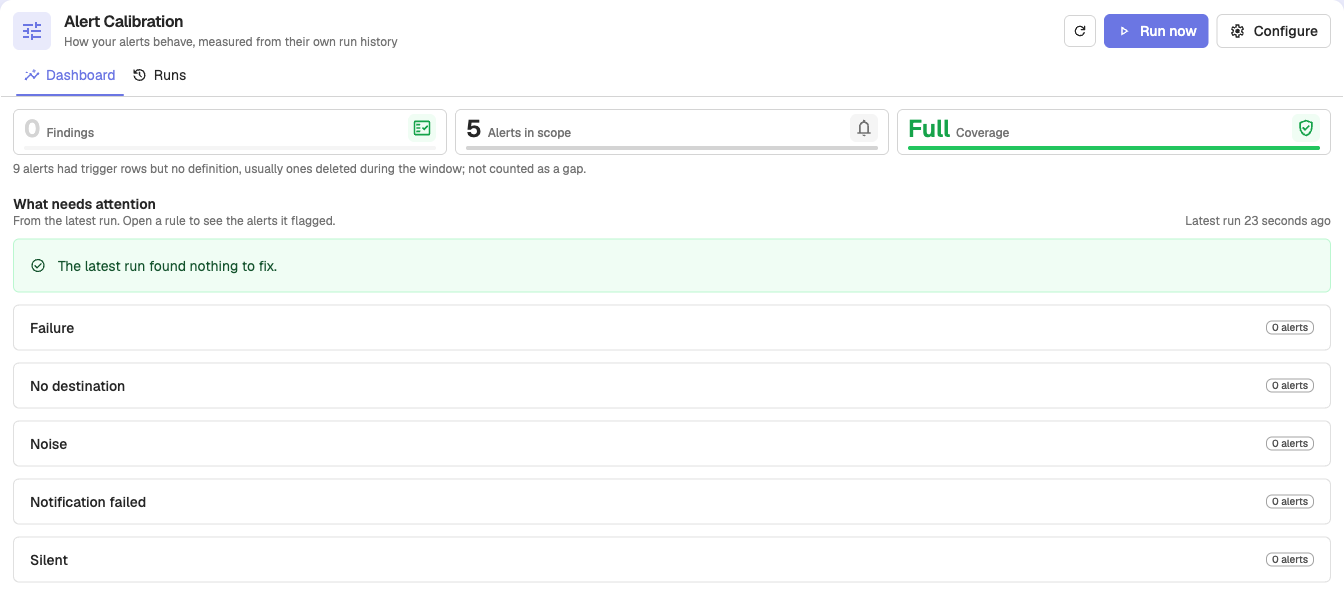
The Dashboard tab sums up the latest run: Findings, Alerts in scope, and Coverage. Under What needs attention, each rule lists the alerts it flagged. Click Open alert to edit an alert, or View evidence to open the run's details.
Runs
The Runs tab lists every run with its Findings and Coverage, and a Findings trend chart. Filter by All runs, With findings, or Coverage gaps, or search runs by alert name.
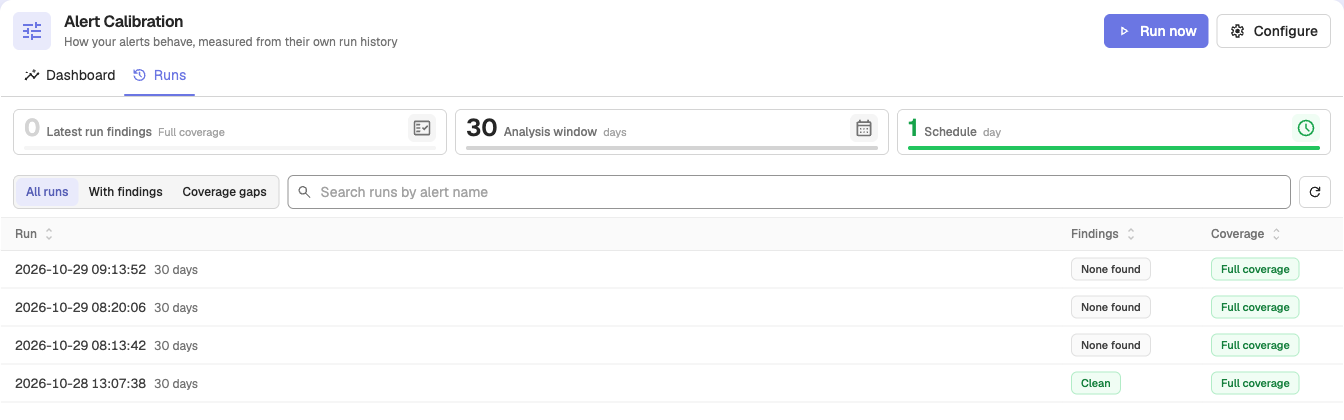
Click a run to open its digest:
- Findings: one card per flagged alert, with the rule, severity (High, Medium, Low), confidence, the Evidence (for example Firings, Mean time to normal, Error ratio, Top error), and Proposed actions.
- Alerts in scope, Declined, and Window.
- View in Logs opens the run's records in Logs.
Coverage
Each run reports how much of the window it could see:
| Coverage | What it means |
|---|---|
| Full coverage | The run read every alert's history for the window. |
| Coverage gap | Part of the data was missing or truncated. Counts are a minimum, and no finding does not mean the alert is fine. |
| Measured nothing | The organization has alerts, but no alert ran in the window. |
An alert deleted during the window, or one with no runs in it, is not counted as a gap.
Where the results are stored
Each run writes its findings to the _o2_alert_calibration_digests logs stream of the organization. The records follow that stream's retention, and you can query them in Logs like any other stream.
The findings are built from the alert run history in the triggers stream, described in Alert History.
Configuration
| Environment variable | Default | Description |
|---|---|---|
O2_ALERT_CALIBRATION_ENABLED | true | Turns Alert Calibration on for the deployment. When false, no organization runs it, the menu item is hidden, and its API answers 404, whatever each organization's settings say. |
ZO_SCHEDULER_ALERT_CALIBRATION_INTERVAL | 0 | Poll interval in seconds for the Alert Calibration scheduler. Used only when ZO_SCHEDULER_PER_MODULE_PULLERS=true. 0 uses ZO_ALERT_SCHEDULE_INTERVAL. |
In Enterprise with role-based access control, access is granted through the alert_calibration permission resource.
Next steps
- Alert History: the run history Alert Calibration reads.
- Alerts overview: edit an alert to apply a suggested fix.
- Alert Library: add ready-made alerts.
Need some help?
- Join our Community Slack
- Or Contact support
Alert Library
Browse ready-made alerts in the OpenObserve Alert Library, check which ones match the data you ingest, preview them, and add one or many at once.
Notification Dependencies
See where alert templates and destinations are used with the Used by view, then open or delete related alerts, destinations, and templates in place.