Getting Started with Jaeger Tracing: A Guide

Introduction to Jaeger Tracing
Want to ditch the guesswork and pinpoint performance issues in your distributed systems? Dive into Jaeger, an open-source tracing tool that sheds light on how requests flow across your services.
Jaeger is an open-source, end-to-end distributed tracing system designed to monitor and troubleshoot complex distributed systems. It provides you with a comprehensive view of their application’s performance by tracing requests across multiple services. Jaeger uses the OpenTelemetry API to instrument code and collect trace data, and it provides a web interface for visualizing trace data, allowing you to quickly identify performance bottlenecks and other issues.

Jaeger’s Role in Monitoring and Troubleshooting
Jaeger improves monitoring and troubleshooting by providing detailed information on the performance of distributed systems. Jaeger’s tracing capabilities allow developers to see the flow of requests and data as they traverse a distributed system, making it easier to identify issues and optimize system performance.
Role of Tracing in Understanding Application Behavior
Tracing plays a crucial role in understanding application behavior by providing a detailed view of how requests flow through a system. Tracing helps developers identify performance bottlenecks, troubleshoot errors, and optimize system performance. It also helps in root cause analysis, which is essential for identifying the source of a problem and making necessary changes to improve system performance.
In the next section, we will focus on understanding the significance of instrumentation.
About Us | Open Source Observability Platform
Get started for FREE with OpenObserve
Importance of Instrumentation
Application instrumentation is the process of adding observability code to an application to generate, collect, and export telemetry data. This data includes logs, metrics, and traces, which help developers understand the performance and behavior of their application.
Instrumentation is necessary because it allows developers to monitor and troubleshoot issues in their application, identify performance bottlenecks, and optimize system performance.
Use OpenTelemetry for Instrumentation
OpenTelemetry is a widely used and well-maintained framework for application instrumentation. It provides a vendor-agnostic implementation for generating, collecting, and exporting telemetry data.
OpenTelemetry supports various programming languages and can be used with various backends, including Jaeger. It is recommended to use OpenTelemetry for instrumentation because it provides a comprehensive solution for telemetry data collection and analysis.
Historic support for Jaeger SDKs
Jaeger is a distributed tracing system that provides a comprehensive view of application performance. It supports various programming languages and can be used with various backends, including OpenTelemetry. Jaeger SDKs are available for several programming languages, including Java, Python, and Go. Historic support for Jaeger SDKs ensures that developers can use Jaeger with their existing applications and integrate it with other tools and services.
Now that you are familiar with Jaeger tracing, let’s dive into the technicality of getting started with jaeger.
Get started for FREE with OpenObserve
Getting Started with Jaeger
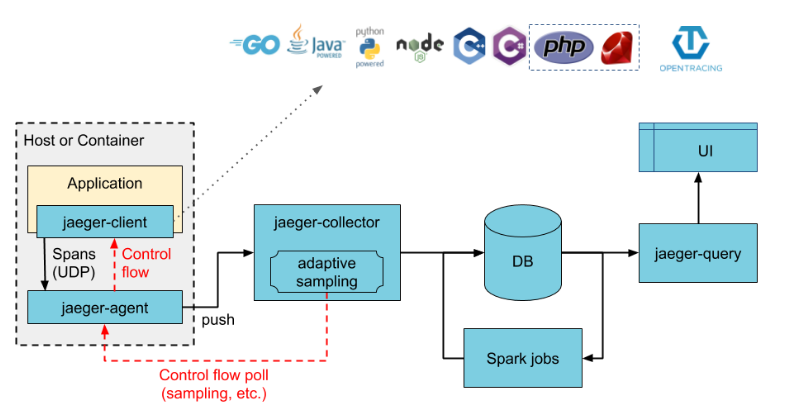
The Jaeger All-in-One executable is designed for quick local testing and includes the Jaeger UI, collector, query, and agent, with an in-memory storage component. It can be run using the following command:
docker run --rm --name jaeger \
  -e COLLECTOR_ZIPKIN_HOST_PORT=:9411 \
  -p 6831:6831/udp \
  -p 6832:6832/udp \
  -p 5778:5778 \
  -p 16686:16686 \
  -p 4317:4317 \
  -p 4318:4318 \
  -p 14250:14250 \
  -p 14268:14268 \
  -p 9411:9411 \
  jaegertracing/all-in-one:1.57
Steps to Start Jaeger Using Docker
To start Jaeger using Docker, follow these steps:
- Pull the Jaeger All-in-One image:
docker pull jaegertracing/all-in-one:1.57
- Run the container:
docker run --rm --name jaeger \
  -e COLLECTOR_ZIPKIN_HOST_PORT=:9411 \
  -p 6831:6831/udp \
  -p 6832:6832/udp \
  -p 5778:5778 \
  -p 16686:16686 \
  -p 4317:4317 \
  -p 4318:4318 \
  -p 14250:14250 \
  -p 14268:14268 \
  -p 9411:9411 \
  jaegertracing/all-in-one:1.57
Jaeger User Interface
To access the Jaeger UI, navigate to http://localhost:16686 in your web browser. The UI provides a comprehensive view of the tracing data, including:
- Service Map: A visual representation of the services and their interactions.
- Tracing: A detailed view of individual traces, including the request and response data.
- Span: A detailed view of individual spans, including the request and response data.
- Query: A search interface for querying tracing data.
Ports Exposed by the Jaeger Docker Container
The Jaeger Docker container exposes the following ports:
- 6831: UDP port for sending tracing data.
- 6832: UDP port for sending tracing data.
- 5778: HTTP port for the Jaeger UI.
- 16686: HTTP port for the Jaeger UI.
- 4317: HTTP port for the Jaeger UI.
- 4318: HTTP port for the Jaeger UI.
- 14250: HTTP port for the Jaeger UI.
- 14268: HTTP port for the Jaeger UI.
- 9411: HTTP port for the Jaeger UI.
These ports are used to communicate between the Jaeger components and access the Jaeger UI.
Now, in next section, we will cover the details of SPM with Jaeger.
Service Performance Monitoring (SPM) with Jaeger
Service Performance Monitoring (SPM) is a feature in Jaeger that provides service-level and operation-level aggregation of key metrics like request rates, error rates, and durations (latencies). It helps identify interesting traces (e.g. high QPS, slow or erroneous requests) without needing to know the service or operation names up-front.
How does SPM work?
SPM works by aggregating span data from Jaeger to produce RED (Request, Error, Duration) metrics. The OpenTelemetry Collector's Span Metrics Processor is used to generate these metrics from the incoming traces.
Key features of SPM
- Service-level and operation-level aggregation of request rates, error rates, and latencies (P95, P75, P50)
- "Impact" metric computed as the product of latency and request rate to highlight high-impact operations
- Pre-populated Trace search with relevant service, operation and lookback period for interesting traces
Accessing SPM in Jaeger
- The SPM feature can be accessed from the "Monitor" tab in the Jaeger UI. It requires Jaeger 1.57 or later.
Limitations
- SPM is still an experimental feature and may have further changes in the future
- Requires OpenTelemetry Collector 0.63.1 or later with the Span Metrics Processor enabled
By providing aggregated RED metrics and highlighting high-impact traces, SPM makes it easier to monitor service performance and identify issues in complex distributed systems using Jaeger.
In the next section, you will learn the steps and codes required to set up Jaeger with Kubernetes.
Setting Up Jaeger on Kubernetes
The Jaeger Kubernetes Operator is an implementation of a Kubernetes Operator that simplifies deploying and managing Jaeger, a distributed tracing system. It provides a set of APIs and tools to manage Jaeger instances and their components, such as the collector, query, and agent.
Installing the Jaeger Operator on Kubernetes
To install the Jaeger Operator on Kubernetes, follow these steps:
- Create a Namespace: Create a namespace for the Jaeger Operator, such as observability.
- Install the Jaeger Operator using the following command:
bash
kubectl create namespace observability
kubectl create -f https://raw.githubusercontent.com/jaegertracing/jaeger-operator/main/deploy/crds/jaegertracing.io_jaegers_crd.yaml
- Create a Jaeger instance using the following command:
bash
kubectl apply -n observability -f - <<EOF
apiVersion: jaegertracing.io/v1
kind: Jaeger
metadata:
  name: simplest
EOF
Installing the Jaeger Operator on OKD/OpenShift
To install the Jaeger Operator on OKD/OpenShift, follow these steps:
- Create a Project: Create a project for the Jaeger Operator, such as observability.
- Install the Jaeger Operator using the following command:
bash
oc login -u <privileged user>
oc new-project observability
oc create -f https://raw.githubusercontent.com/jaegertracing/jaeger-operator/main/deploy/crds/jaegertracing.io_jaegers_crd.yaml -n observability
- Create a Jaeger instance using the following command:
bash
oc create -n observability -f - <<EOF
apiVersion: jaegertracing.io/v1
kind: Jaeger
metadata:
  name: simplest
EOF
The Jaeger Kubernetes Operator provides a simple and scalable way to deploy and manage Jaeger, a distributed tracing system. It simplifies the deployment and management of Jaeger instances and provides a set of APIs and tools to monitor and troubleshoot Jaeger instances.
In the next section, you will learn briefly about HotROD, a demo application.
Using the Sample App: HotROD
HotROD is a demo application that consists of several microservices and illustrates the use of the OpenTracing API. It provides features like:
- HotROD's architecture can be discovered by viewing the data-driven dependency diagram, which shows the relationships between the different microservices that make up the application.
- HotROD allows you to view request timelines and errors, which can help you understand how the application works and identify performance bottlenecks and troubleshoot issues.
- HotROD demonstrates the use of baggage propagation, which allows you to pass arbitrary key-value pairs to all downstream requests.
- HotROD can be run using Docker, Docker Compose, or by building from source or binary. The instructions for running HotROD are available in the README file of the Jaeger repository.
By using HotROD, you can learn how to use the OpenTracing API to instrument your application and gain insights into its performance and behavior.
Moving on, now you will learn how to migrate from ZIpkin to Jaeger.
Migrating from Zipkin to Jaeger
Here is a technical overview of Jaeger's compatibility with Zipkin:
Compatibility of Jaeger with Zipkin
Jaeger supports Zipkin compatibility in the following ways:
- Jaeger tracers for Java and Go support the B3 propagation format, which allows joining traces with other Zipkin (B3) instrumented services.
- Jaeger accepts Zipkin spans in Thrift format over HTTP. The default endpoint is http://localhost:14268/api/traces?format=zipkin.thrift.
- Zipkin's default span submission endpoint is http://localhost:9411/api/v1/spans with Content-Type of thrift or json, and optional gzip encoding.
Zipkin-compatible API in Jaeger
To enable the Zipkin-compatible API in Jaeger, you can use the following configuration:
yaml
receivers:
  zipkin:
    endpoint: 0.0.0.0:9411
    format: proto
This configures the Zipkin receiver to listen on 0.0.0.0:9411 and accept spans in Protobuf format.
References to files for migration
- Jaeger's Thrift IDL file: https://github.com/jaegertracing/jaeger/blob/master/thrift-gen/jaeger/jaeger.thrift
- Zipkin's Thrift IDL file: https://github.com/openzipkin/zipkin-api/blob/master/thrift/zipkinCore.thrift
- Zipkin's Proto IDL file: https://github.com/openzipkin/zipkin-api/blob/master/proto3/zipkin.proto
These IDL files can be used as references when migrating from Zipkin to Jaeger or when integrating Jaeger with Zipkin-instrumented services.
By supporting Zipkin's B3 propagation format and providing a Zipkin-compatible API, Jaeger makes it easier to migrate from Zipkin and join traces across different instrumentation systems.
About Us | Open Source Observability Platform
Conclusion
This guide provides a comprehensive introduction to Jaeger, a distributed tracing system for monitoring and troubleshooting complex applications. It covers key concepts like Jaeger's role in performance analysis, instrumentation using OpenTelemetry, and getting started with Jaeger using Docker. The guide also explores advanced topics like Service Performance Monitoring (SPM) and deploying Jaeger on Kubernetes. Finally, it details compatibility with Zipkin and resources for migration.
In essence, this guide empowers developers to leverage Jaeger's tracing capabilities to gain deep insights into application behavior and optimize performance within distributed systems.
Why OpenObserve is the Right Choice!
OpenObserve is the right choice for several reasons:
- Vendor-Neutral Instrumentation: OpenObserve provides vendor-neutral instrumentation using OpenTelemetry, which allows you to use the same instrumentation across different backends, including Jaeger.
- Easy Integration: OpenObserve integrates seamlessly with Jaeger, allowing you to use the same instrumentation and tracing data across both platforms.
- Advanced Features: OpenObserve provides advanced features like distributed context propagation, distributed transaction monitoring, root cause analysis, and service dependency analysis, which are essential for monitoring and troubleshooting microservices-based distributed systems.
- Scalability: OpenObserve is designed to scale with your business needs, providing high scalability and no single points of failure.
- Backwards Compatibility: OpenObserve supports backwards compatibility with Zipkin, allowing you to switch from Zipkin to Jaeger without rewriting your instrumentation code.
Overall, OpenObserve provides a comprehensive solution for monitoring and troubleshooting microservices-based distributed systems, making it the right choice for your needs.
Get started for FREE with OpenObserve
About Us | Open Source Observability Platform
References
Getting started — Jaeger documentation
Jaeger Tracing Tutorial: Get Going From Scratch
Jaeger Tracing: The Ultimate Guide
https://github.com/topics/jaeger
https://github.com/jaegertracing/jaeger
https://github.com/jaegertracing/jaeger-client-go
YouTube Videos
Jaeger Tracing Quick Example Implementation
Getting Started with Jaeger - Joe Elliott
Author:

The OpenObserve Team comprises dedicated professionals committed to revolutionizing system observability through their innovative platform, OpenObserve. Dedicated to streamlining data observation and system monitoring, offering high performance and cost-effective solutions for diverse use cases.
