
Synthetics
Synthetics runs scripted checks against your applications and infrastructure on a schedule, from locations around the world, so you find outages and slowdowns before your users report them.
Overview
Real user monitoring tells you what happened to the people who visited your site. Synthetic monitoring tells you what would happen if someone visited right now. OpenObserve Synthetics runs checks continuously from probe locations you choose, records every run, and keeps the evidence needed to explain a failure after the fact.
Synthetics serves two audiences. Site reliability and operations teams use protocol checks to confirm that endpoints answer, ports accept connections, and certificates have not expired. Product and QA teams use browser tests to confirm that a real user journey (sign in, search, add to cart, check out) still works end to end in a real browser.
Every check produces a run history you can slice by location, browser, and device, with pass rate, latency percentiles, retry and flakiness rates, and per-step timing. When a run fails, the run detail page names the step that broke, shows the screenshot taken at that moment, and reports which locator matched and what the page was doing at the time.
Note: Synthetics is in Beta. It is available on OpenObserve Cloud and on self-hosted deployments. For a self-hosted deployment, follow Self-hosted setup first.
Check types
OpenObserve offers five check types, in two families.
| Type | Family | Verifies |
|---|---|---|
| Browser Test | Browser | A multi-step user journey in a real browser |
| HTTP / API | Protocol | Endpoints, status codes, and response bodies |
| TCP Port | Protocol | A host and port are reachable |
| SSL / TLS Certificate | Protocol | Certificate validity and expiry |
| SSH | Protocol | SSH connectivity to a server |
Browser tests have their own authoring flow, covered in Browser tests. The four protocol types share a single configuration page, covered in Protocol checks. Both families share the same configuration options, results surfaces, and probe locations.
Key capabilities
Journeys that verify outcomes, not only clicks
A browser test replays a recorded journey and asserts what the application should show, so a journey that clicks its way through a broken page still fails. See Assertions.
Resilient element locators
Each step carries an ordered list of ways to find its element. The first that matches is used, so a cosmetic markup change does not break an otherwise healthy check. See Locators.
Failure evidence
Failed runs keep the failing step, its error and stack trace, the screenshot taken at that moment, and the console, page, and network events captured around it. See Diagnosing a failure.
Public and private probe locations
Checks run from OpenObserve-operated public locations, from agents inside your own network, or both. See Private locations.
Getting started
Prerequisites
- An OpenObserve Cloud organization with Synthetics enabled, or a self-hosted deployment set up as in Self-hosted setup
- Permission to create checks in at least one folder
- For browser test recording: Google Chrome with the OpenObserve Synthetics Recorder extension
- For private locations: a host in your network that can run Docker, Kubernetes, or a native binary
Accessing Synthetics
- Open Experience in the left sidebar.
- Select Synthetics.
The page opens on the Checks tab. Use the Private Locations tab to manage your own probe locations.
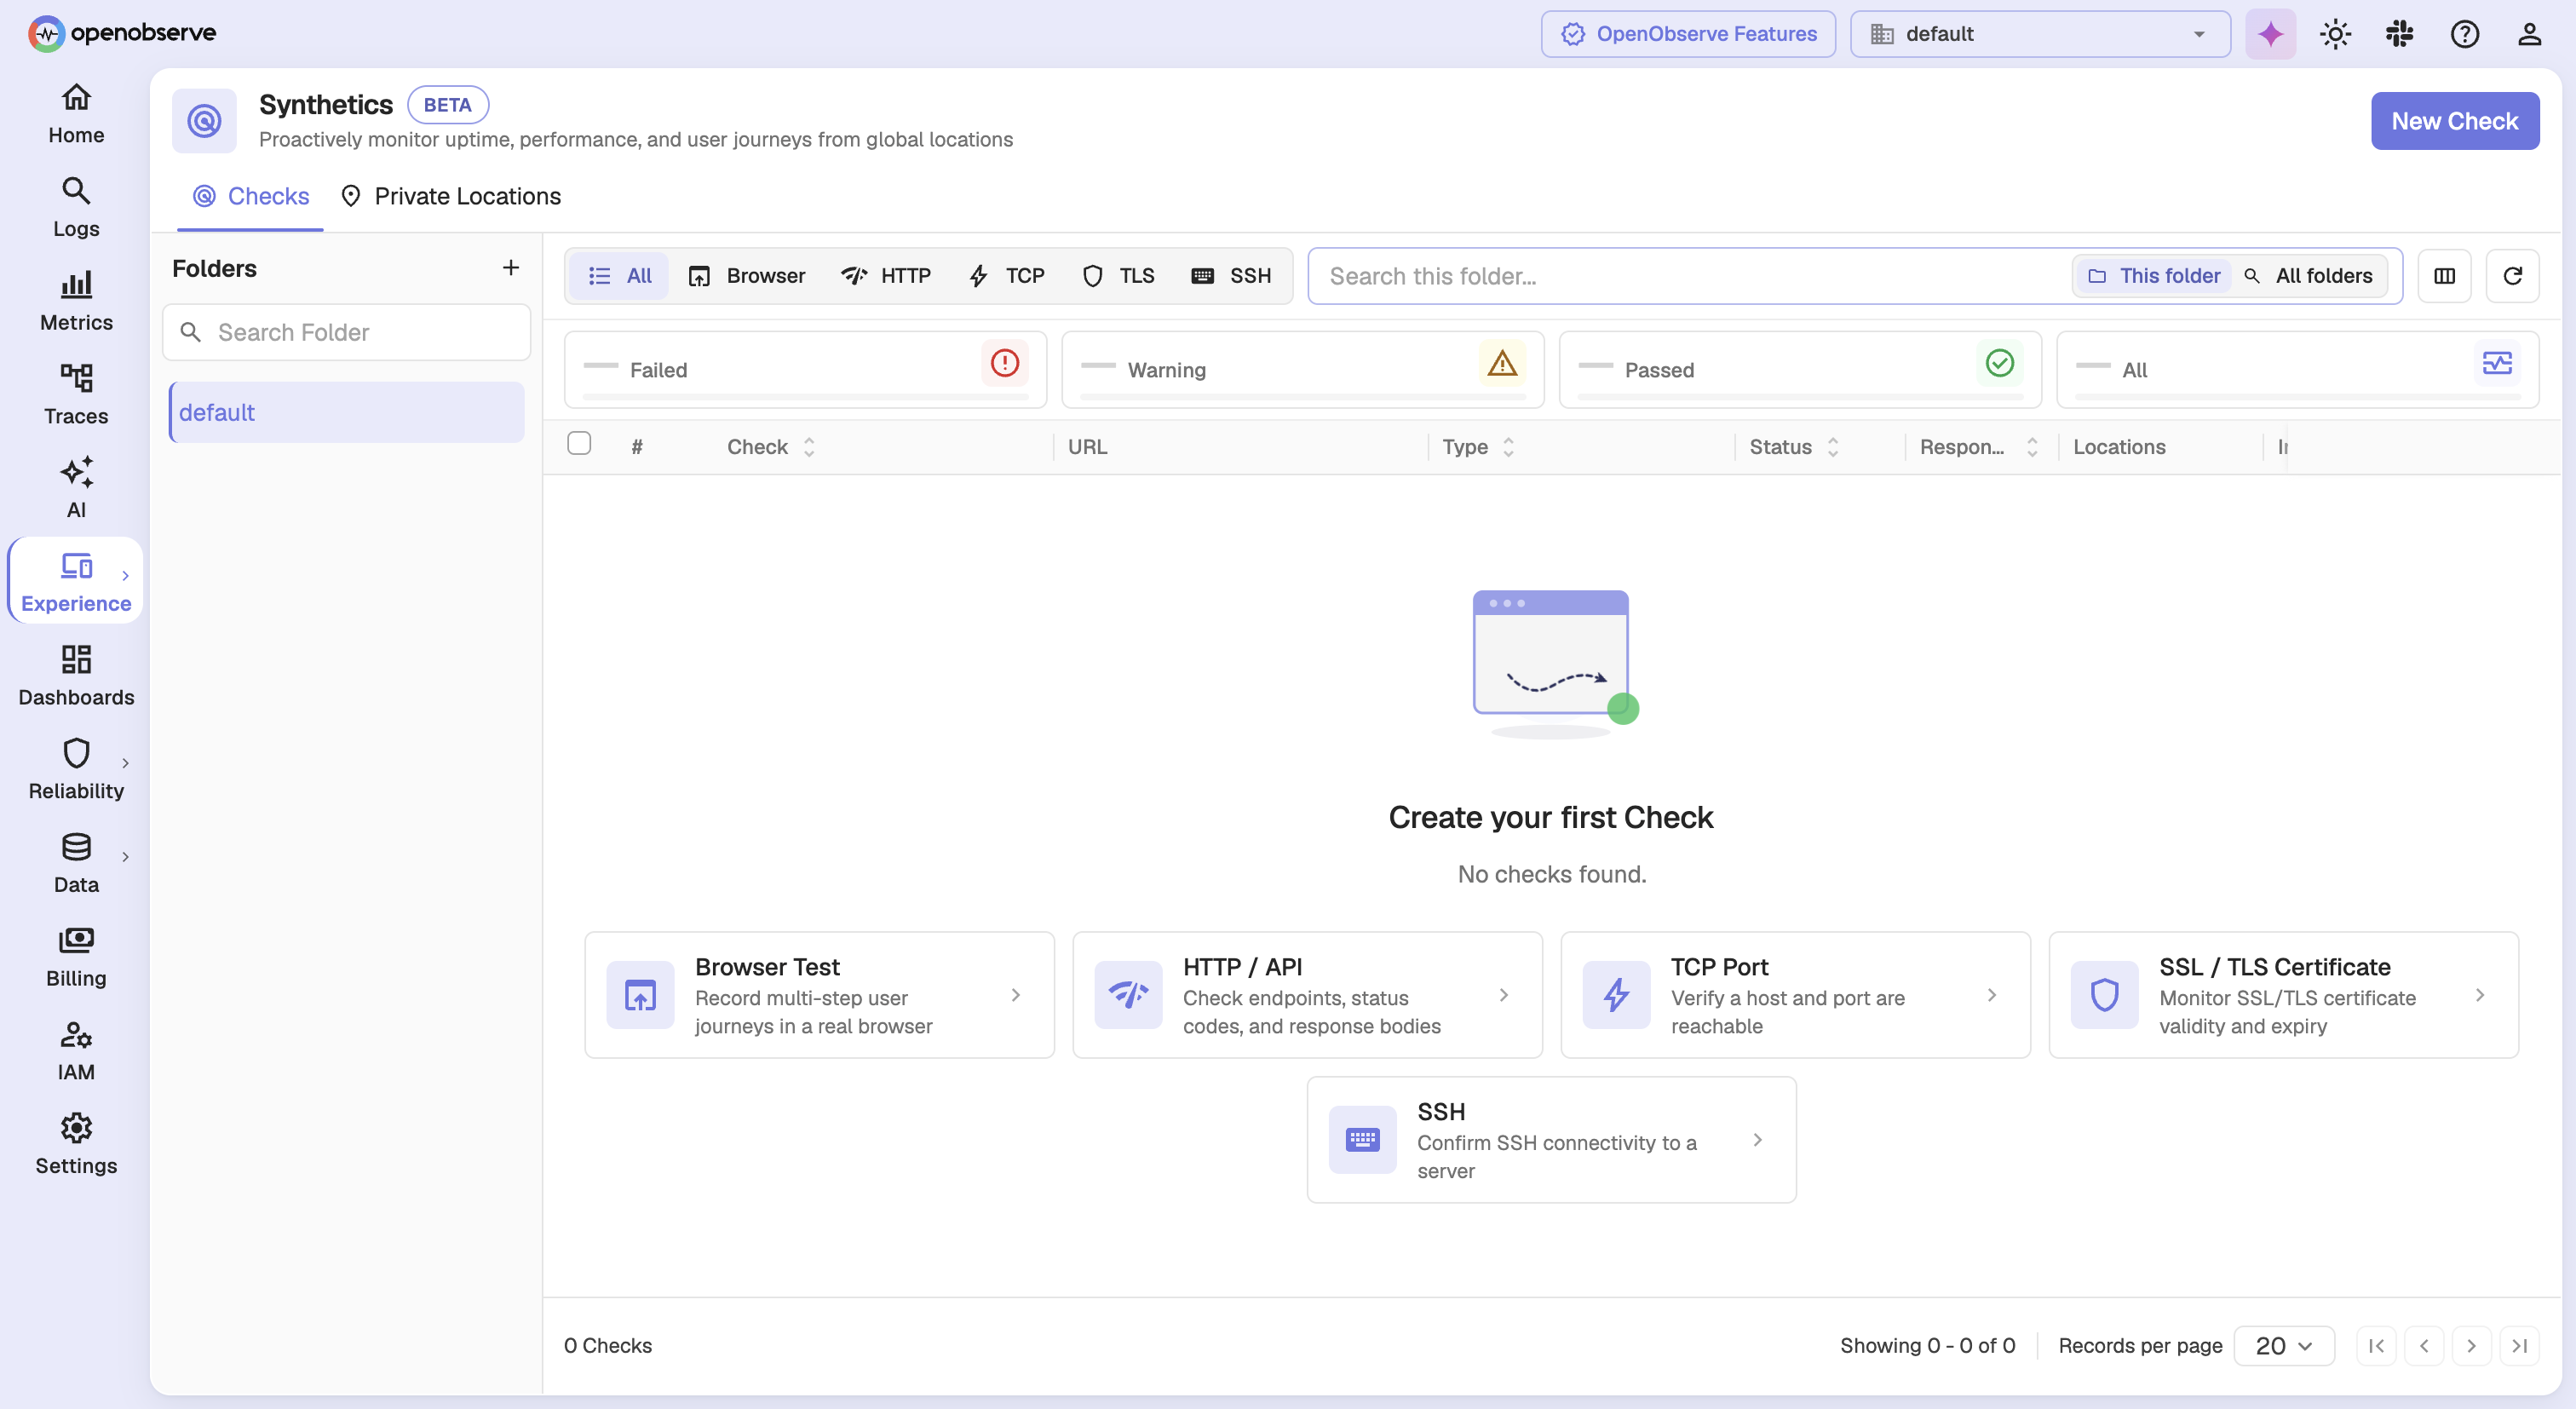
Before you create anything, the Checks tab offers a shortcut into each check type.
Creating your first check
Click New Check and pick a type. For a first check, an HTTP / API check against a health endpoint is the quickest way to see results, since it needs no recording and no browser.
Managing checks
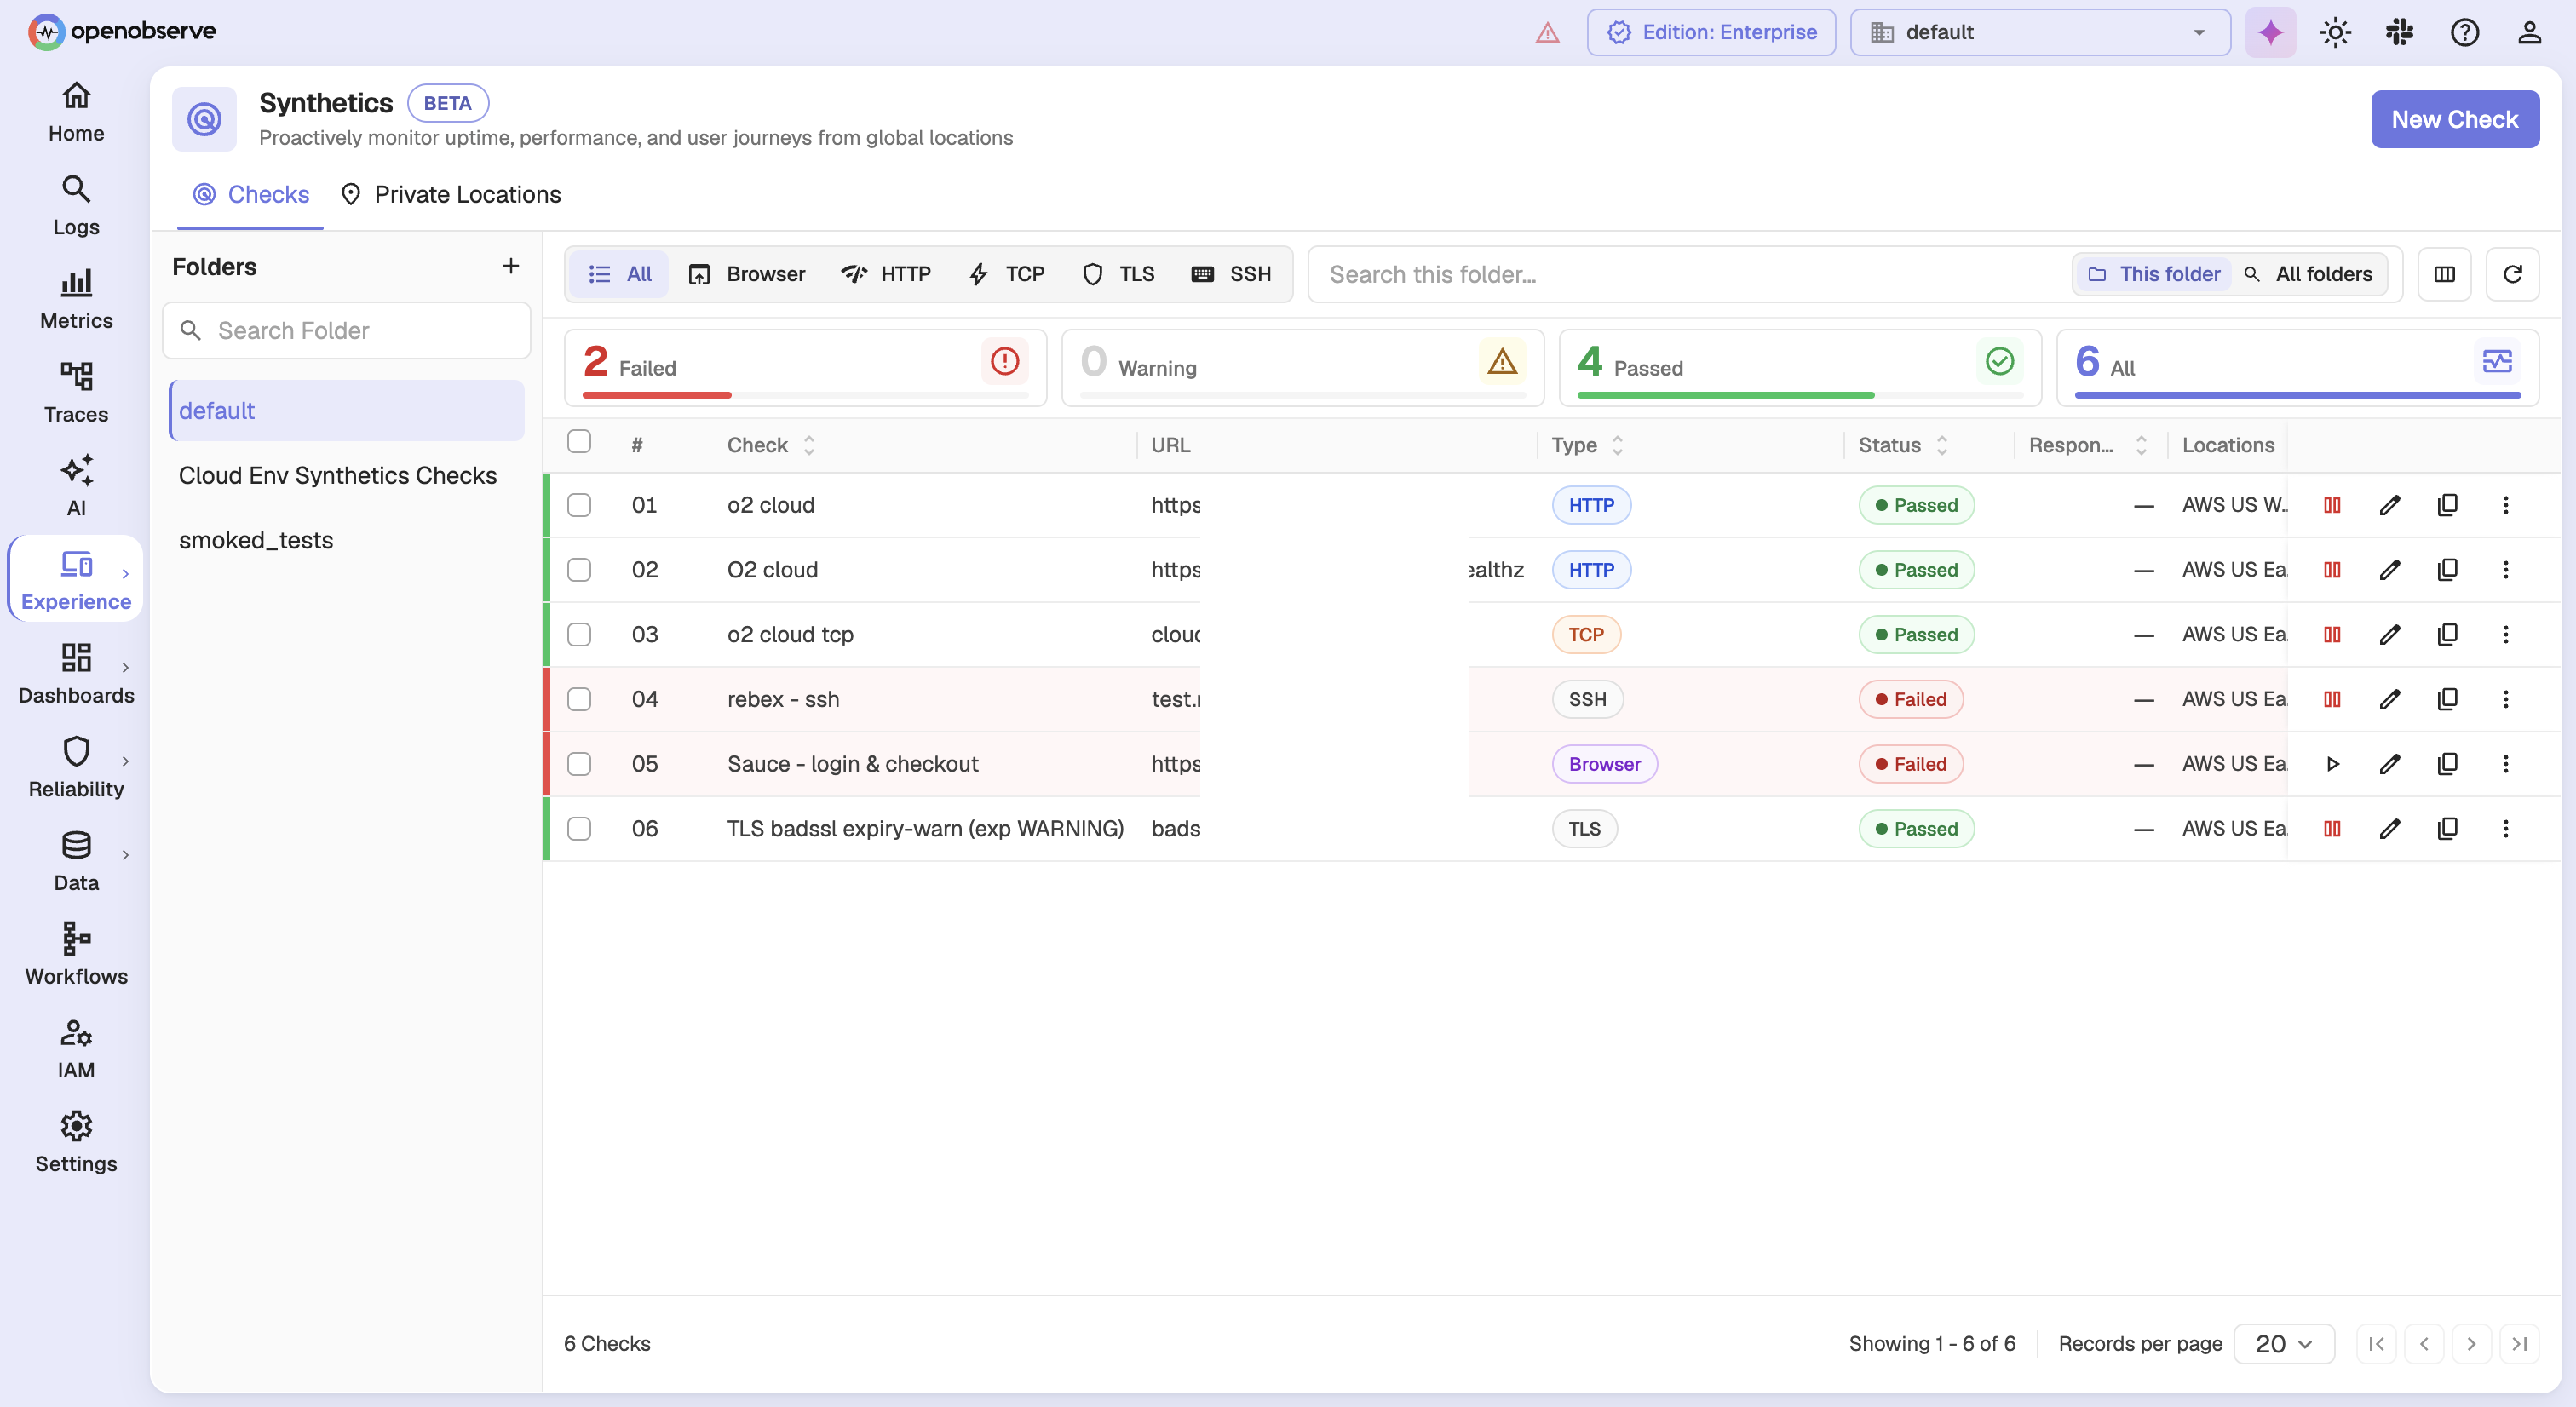
From the checks table you can:
- Filter by folder using the left sidebar, or search across all folders
- Filter by type using the All / Browser / HTTP / TCP / TLS / SSH toggle
- Filter by status by clicking a tile in the health summary
- Edit, Trigger, Pause, Duplicate, Move, or Delete a single check from its row
- Select multiple checks to pause, enable, trigger, move, or delete them together
Tip: A paused check cannot be triggered. Enable it first.
Best practices
- Assert something on every journey. A journey with no assertions only proves the steps could be performed, not that your application worked.
- Prefer test attributes over CSS and text locators. Attributes such as
data-testsurvive redesigns; text and generated class names do not. - Keep more than one locator per step. A step with a single locator and no fallback has nothing to try when the markup changes.
- Mark genuinely optional steps as Optional. Cookie banners and one-time popups appear inconsistently and will otherwise fail runs at random.
- Set step timeouts to match your application, not to make runs fast. A timeout shorter than the real response time is the most common cause of false failures.
- Set Screenshot to Always while building a check, then move it to On fail once it is stable, to keep storage in check.
- Name steps for their purpose. Run results show step names, so "Sign in with valid credentials" is far more useful than "Click".
- Use folders and tags to scope access and reporting as the number of checks grows.
- Use a separate token per region for private agents, so revoking one does not take down every location.
Troubleshooting
The Synthetics entry is missing from the sidebar
Problem: You cannot find Synthetics under Experience.
Solution:
- On a self-hosted deployment, ask your administrator to set
ZO_SYNTHETICS_ENABLED=trueand restart OpenObserve. See Self-hosted setup. - On OpenObserve Cloud, make sure that Synthetics is enabled for your organization.
- Reload the page. Navigating directly to the URL while the feature is off redirects you home.
Need help:
Last updated on
Troubleshooting
Troubleshoot common RUM problems such as no data appearing, session replay not recording, missing errors, high data volume, and browser compatibility issues.
Self-Hosted Setup
Enable Synthetics on self-hosted OpenObserve, deploy the AWS Lambda probes, register a location, and run your first check. Open Source and Enterprise.