
Results
Every check keeps a history of its runs. The results surfaces answer three questions, at three levels of detail: is this check healthy, which step is the problem, and what exactly happened on this run.
Open the results page
Click any row in the checks table. The results page opens on the Overview tab, scoped to the last 15 minutes by default.
Use Run now to trigger a manual execution, Edit Check to change the configuration, and the time range picker to widen the window.
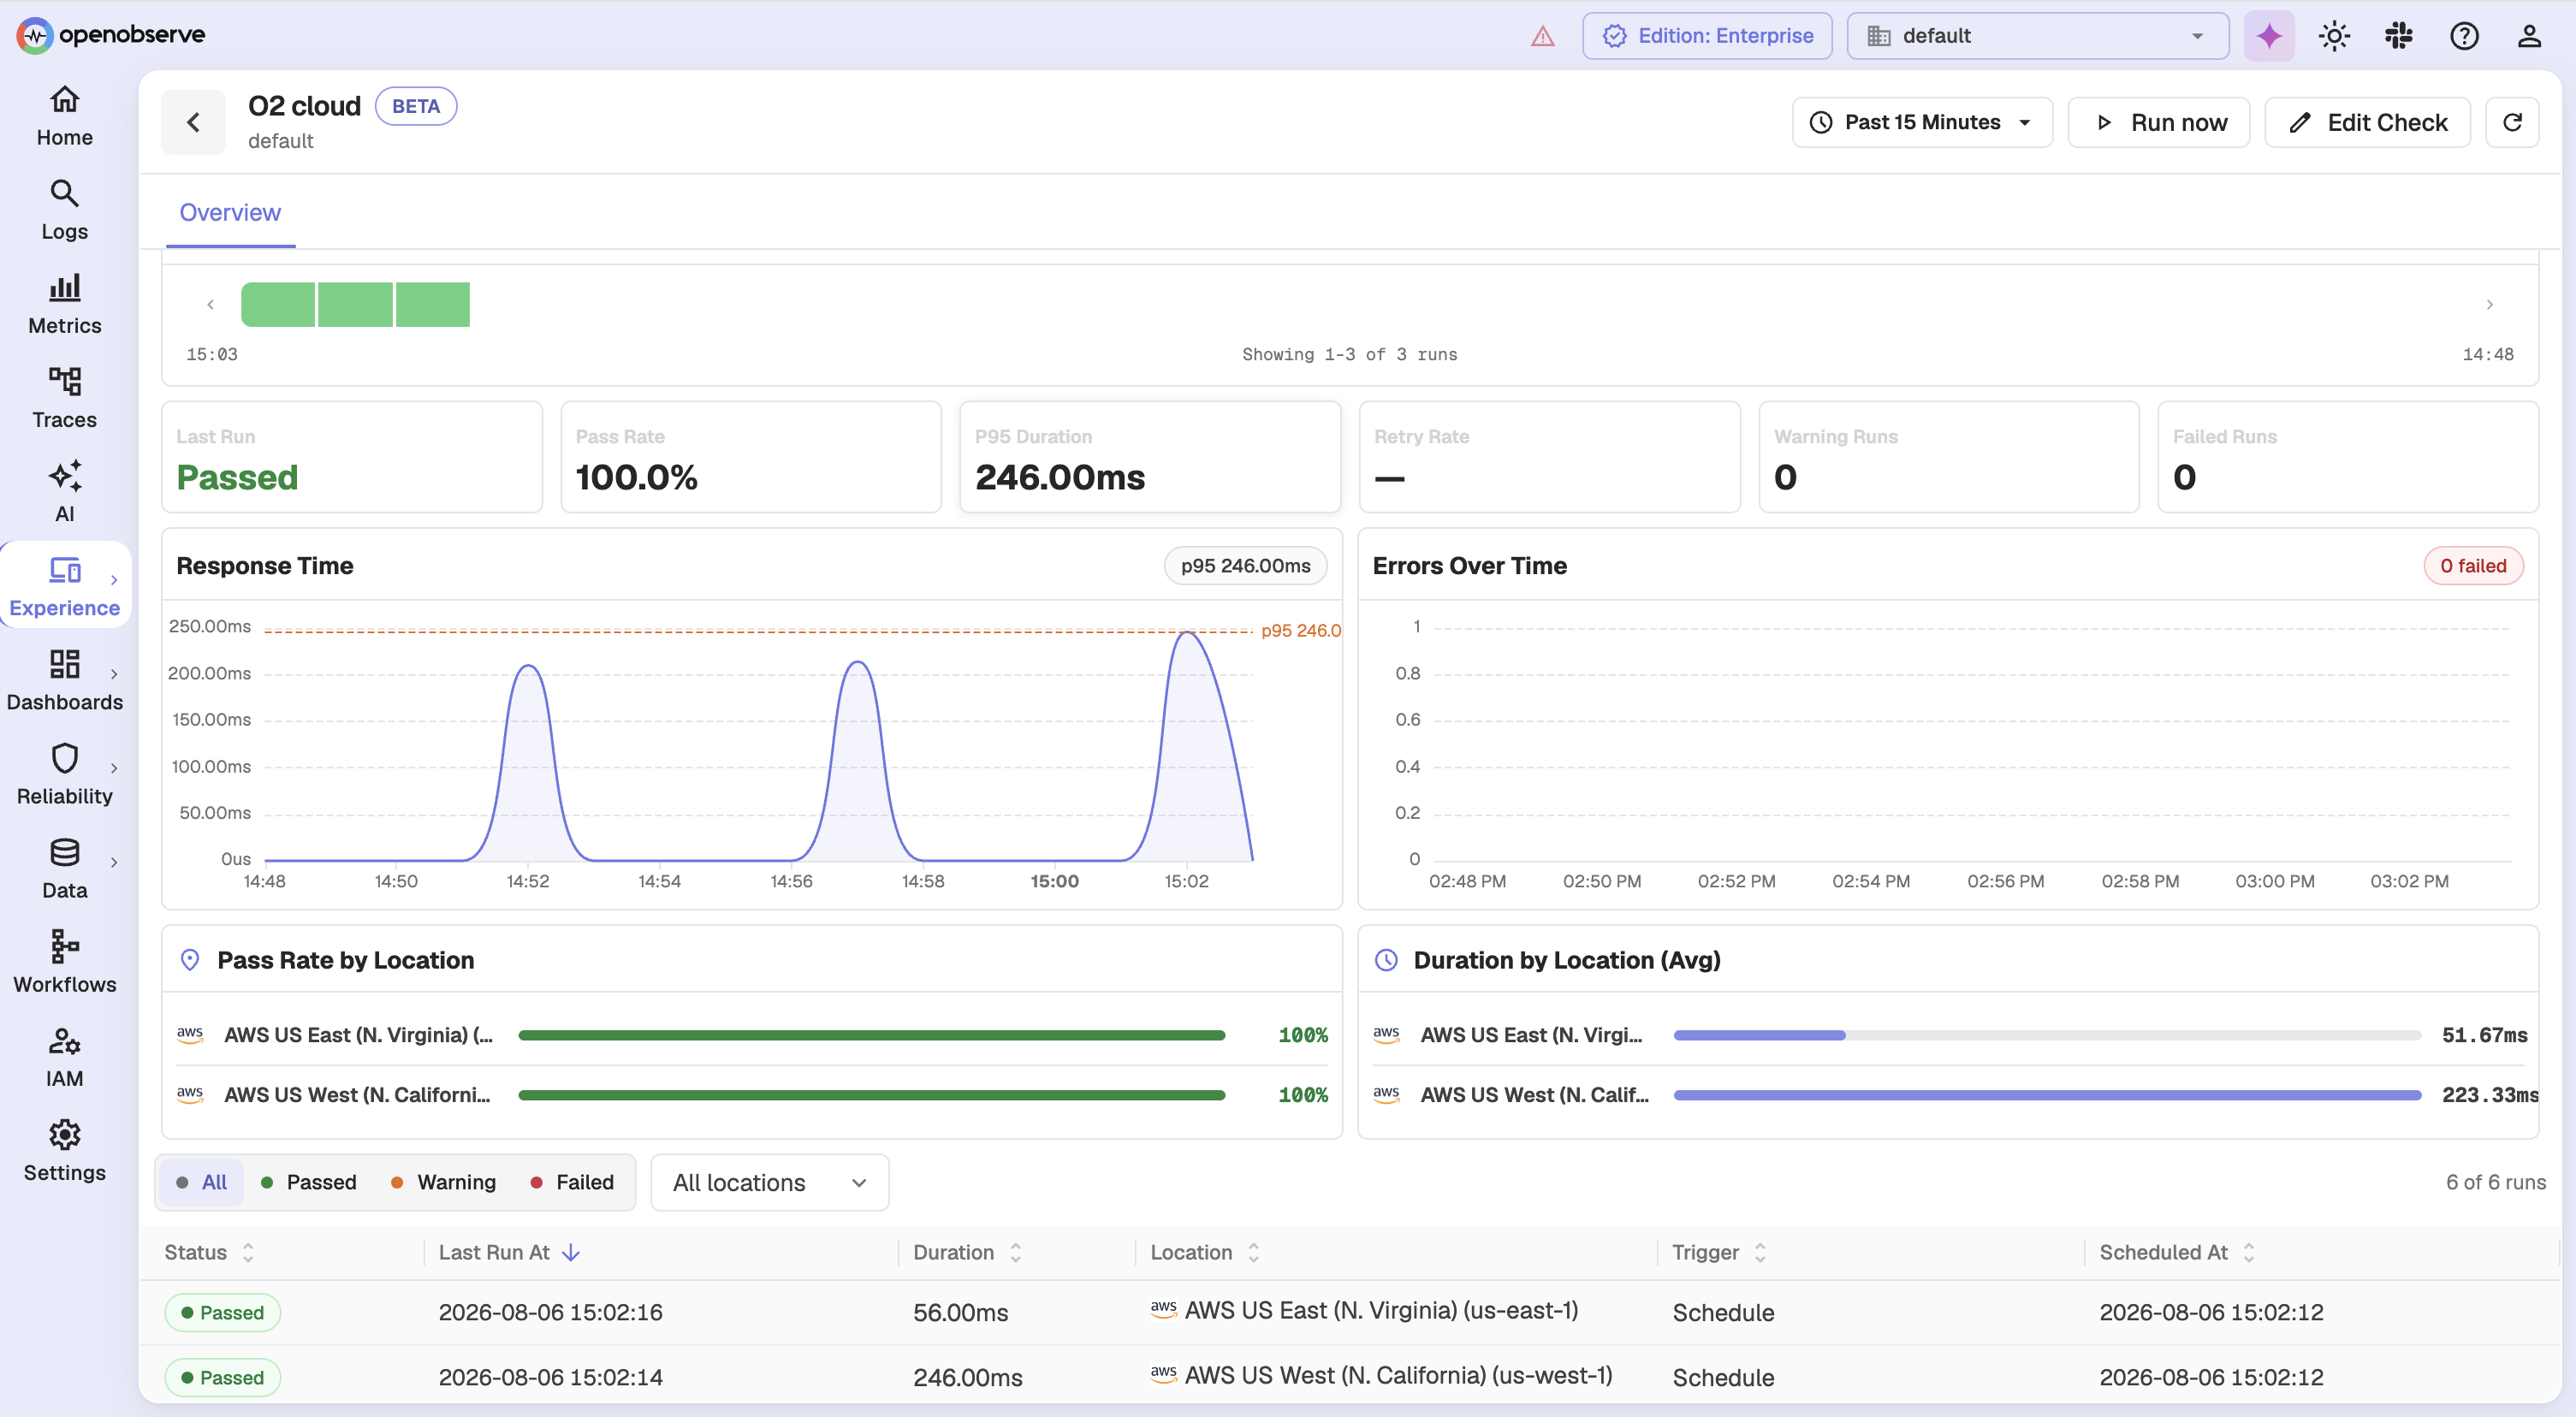
The Overview tab reports:
- Status Timeline, showing every run in the window as a pass, warning, or fail band
- KPI tiles, covering Last Run, Pass Rate, P95 Duration, Retry Rate, Flaky Rate, and Failed Runs
- Response Time and Errors Over Time charts
- Pass Rate by Browser, by Location, and by Device
- The runs table, filterable by status, browser, device, and location
Reading the tiles
| Tile | Means |
|---|---|
| Pass Rate | Share of runs in the window that passed |
| P95 Duration | 95th percentile run duration, the slow tail, not the average |
| Retry Rate | Share of runs where at least one attempt failed and was retried |
| Flaky Rate | Share of runs that passed only after a retry |
| Failed Runs | Count of runs that failed after all attempts |
Note: Flaky Rate is only meaningful when retries are configured. With retries set to 0, nothing can ever be observed as flaky and the tile has no answer to give.
Protocol checks differ
Protocol checks show a slightly different Overview. They have no Steps tab, they report Warning Runs in place of Flaky Rate, and they show Duration by Location instead of the browser and device panels.
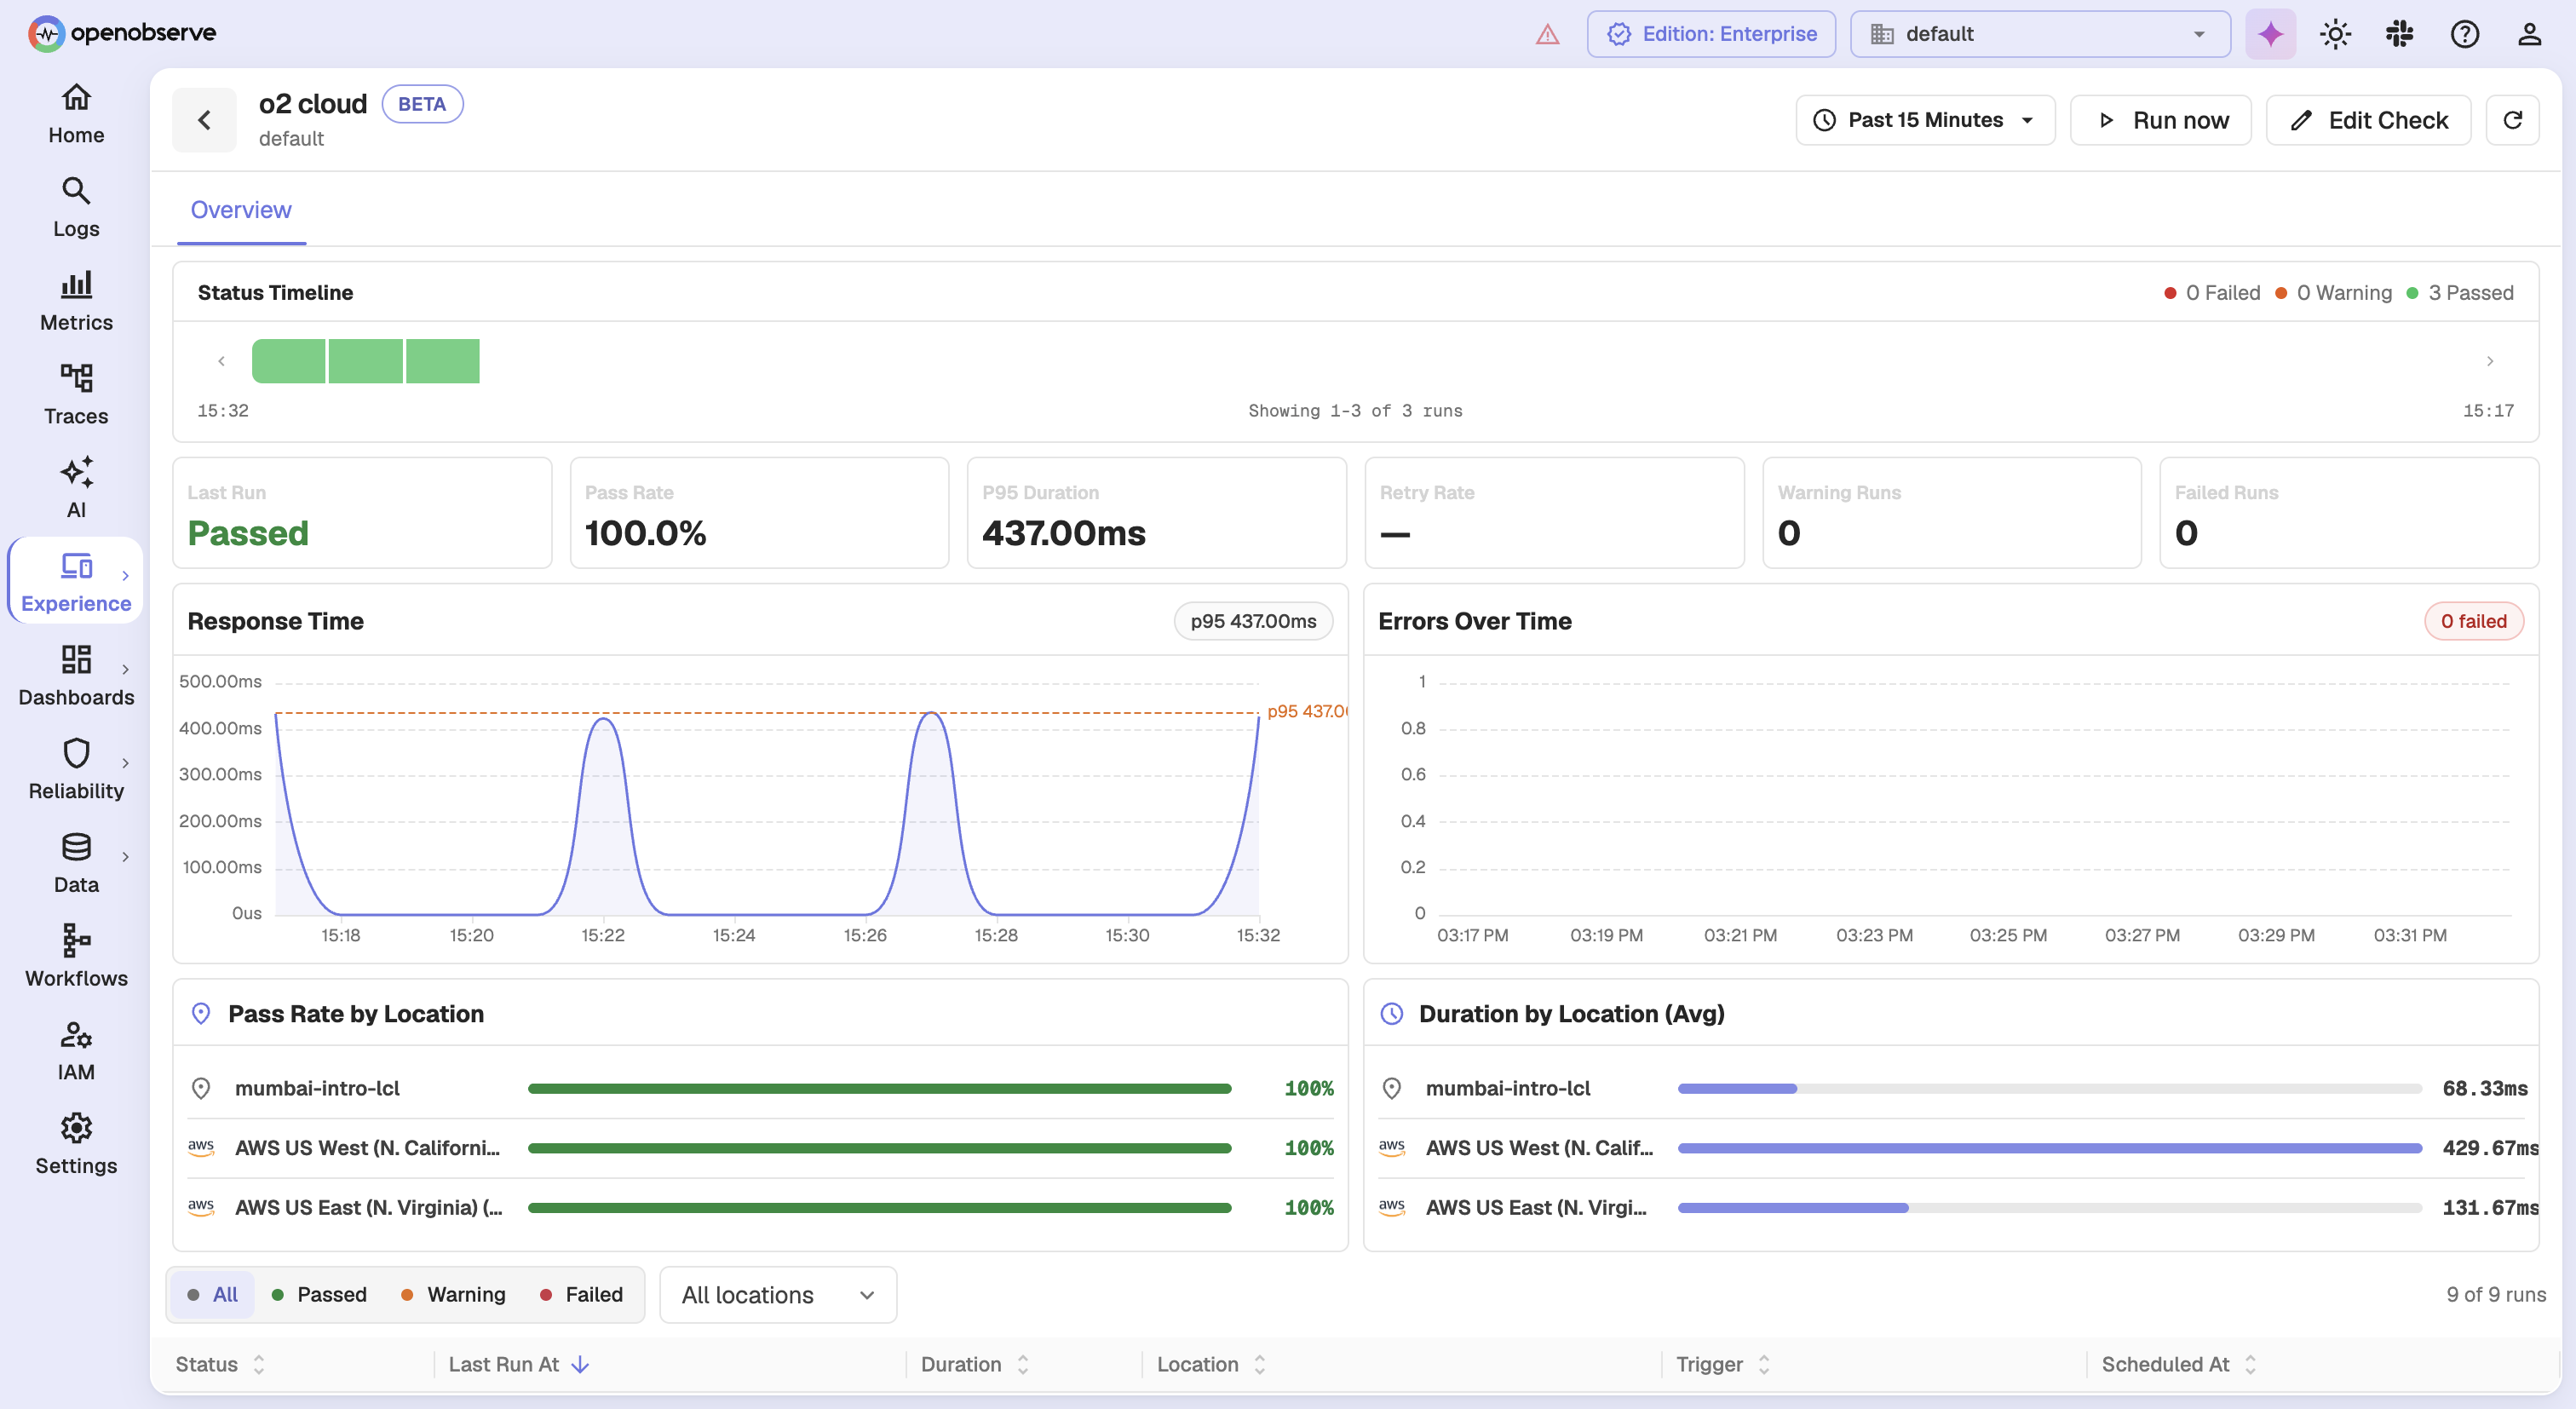
Error patterns
Below the runs table, Error patterns groups failures by normalized error message across locations. Clicking a row filters the runs table to that error, which is the fastest way to tell one widespread failure from several unrelated ones.
Find the step that is failing
Open the Steps tab on a browser check to compare steps across every run in the window. It ranks steps by fail rate, flaky rate, and duration, which is how you find both the step that breaks most often and the step that is slowing the journey down.
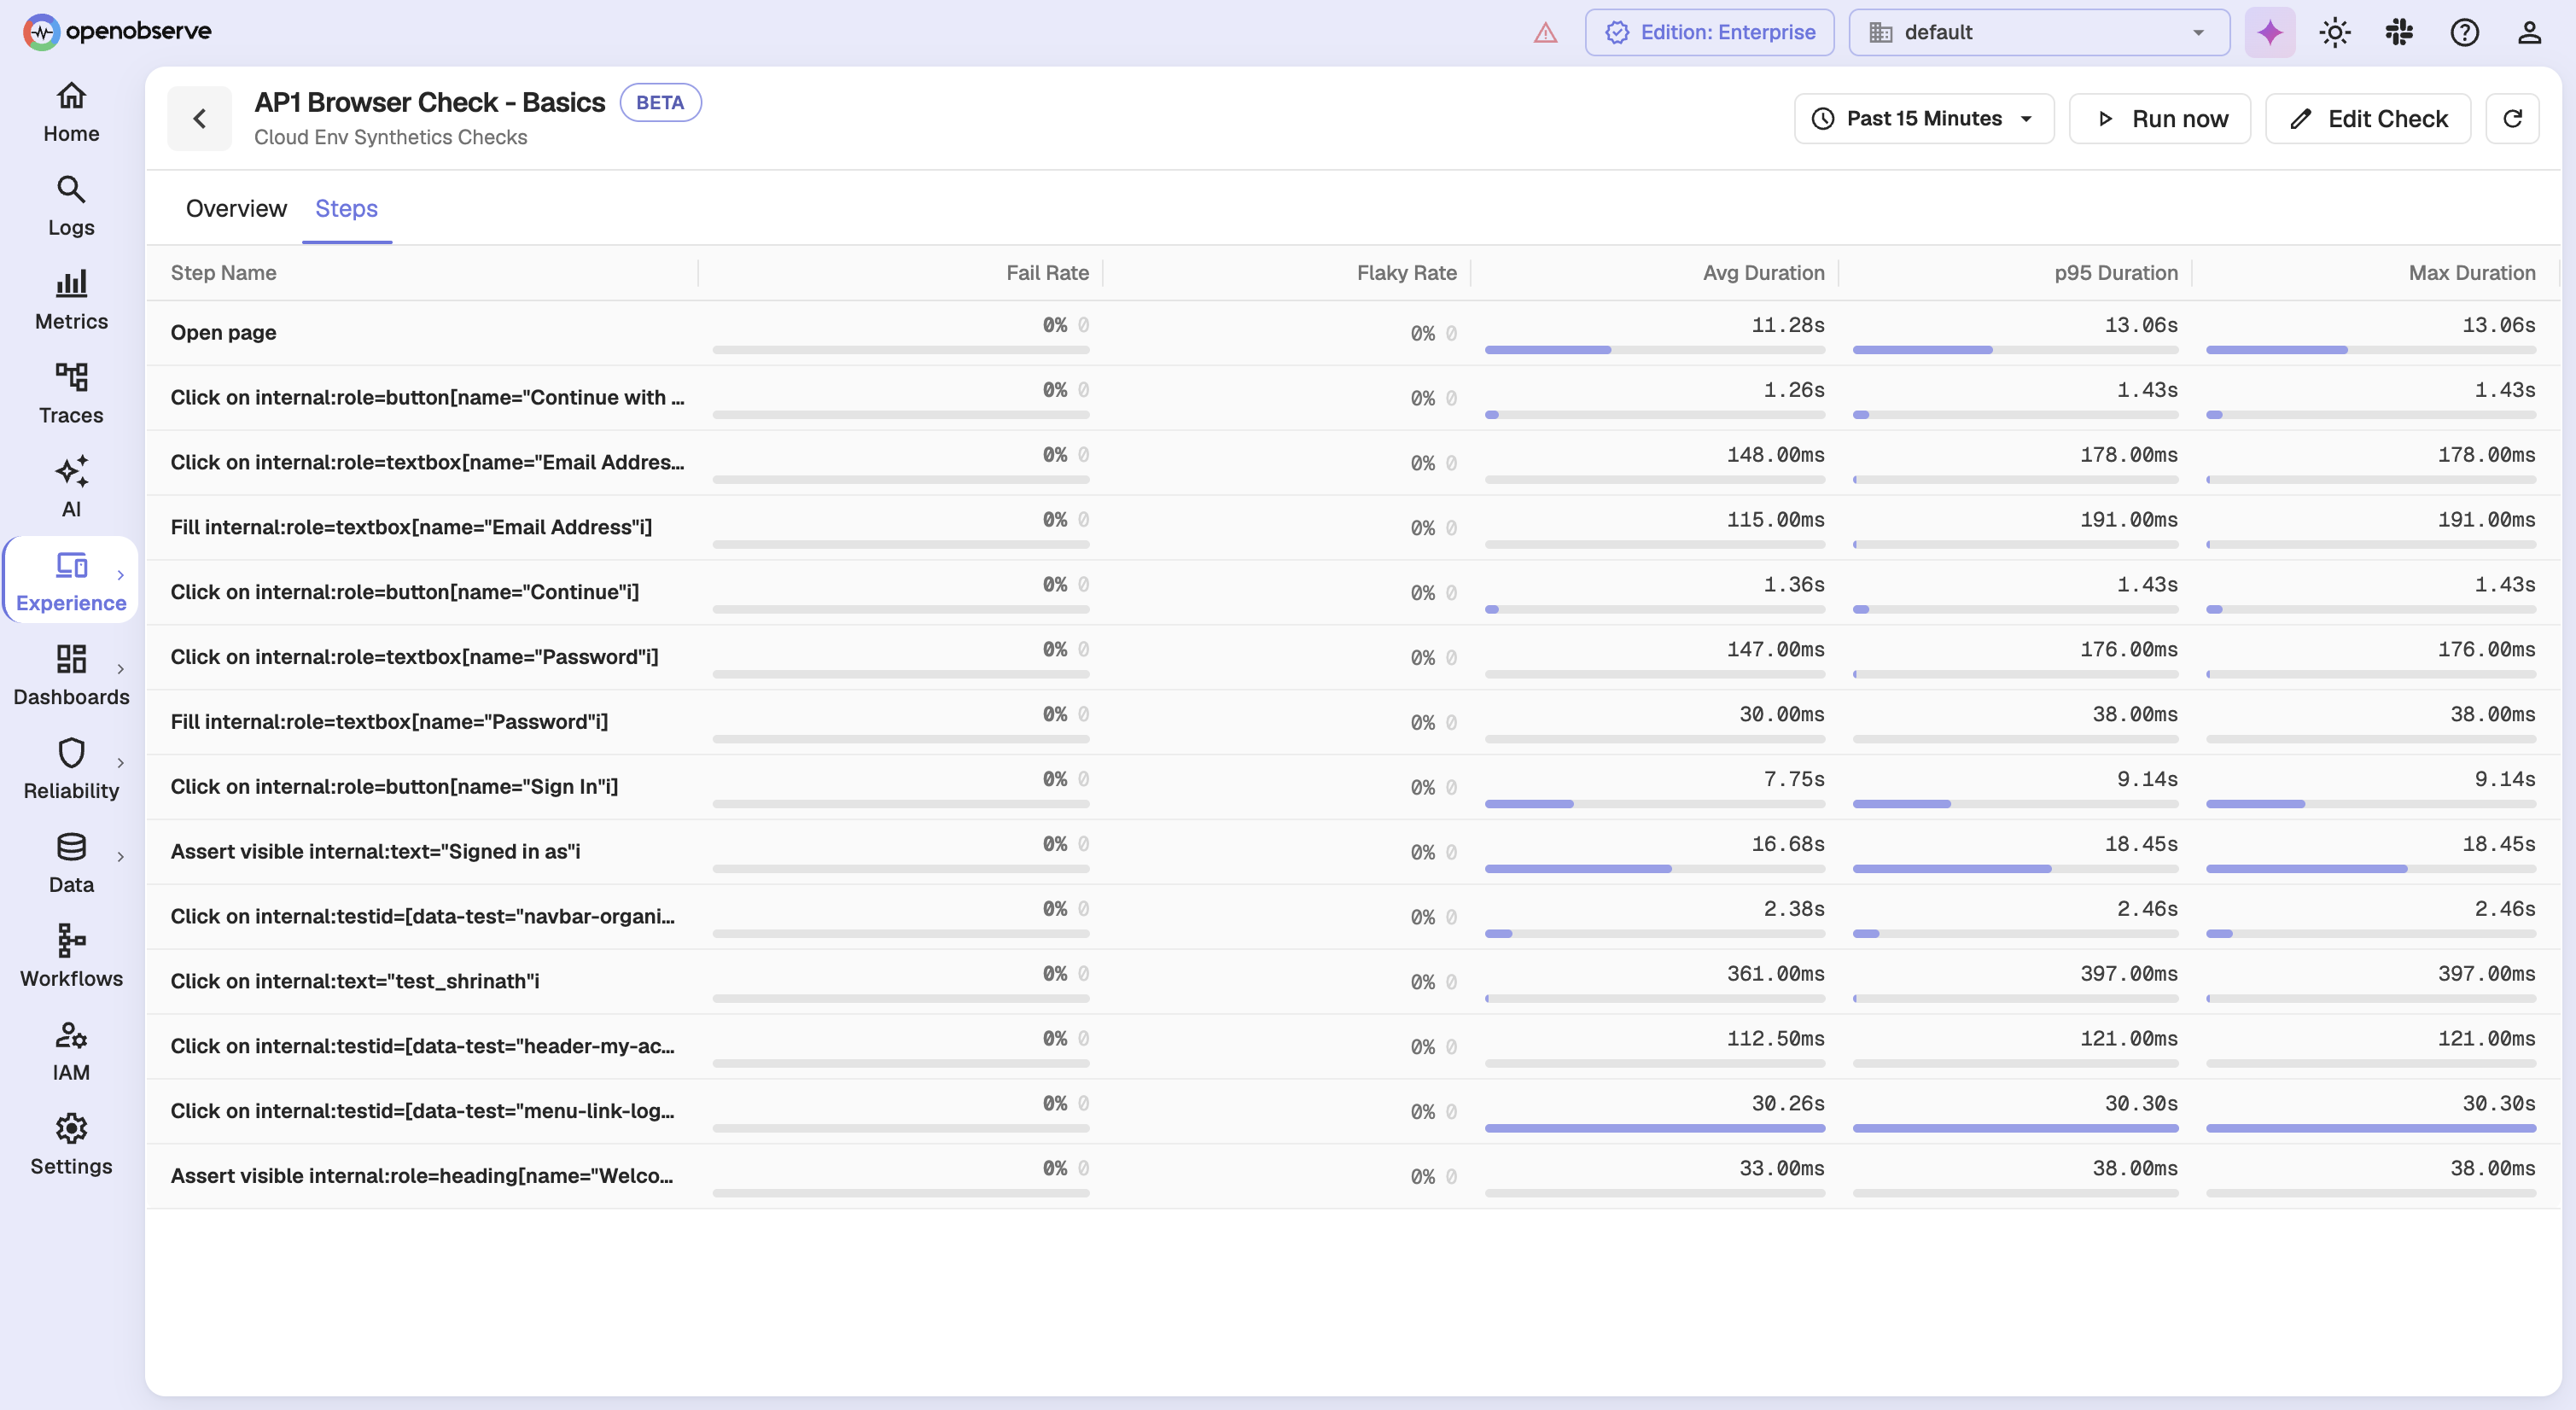
A step with a high Fail Rate is a correctness problem. A step with a high Max Duration but a low average is usually a timing problem, since the step occasionally waits much longer than normal, which is what eventually trips its timeout.
Inspect a single run
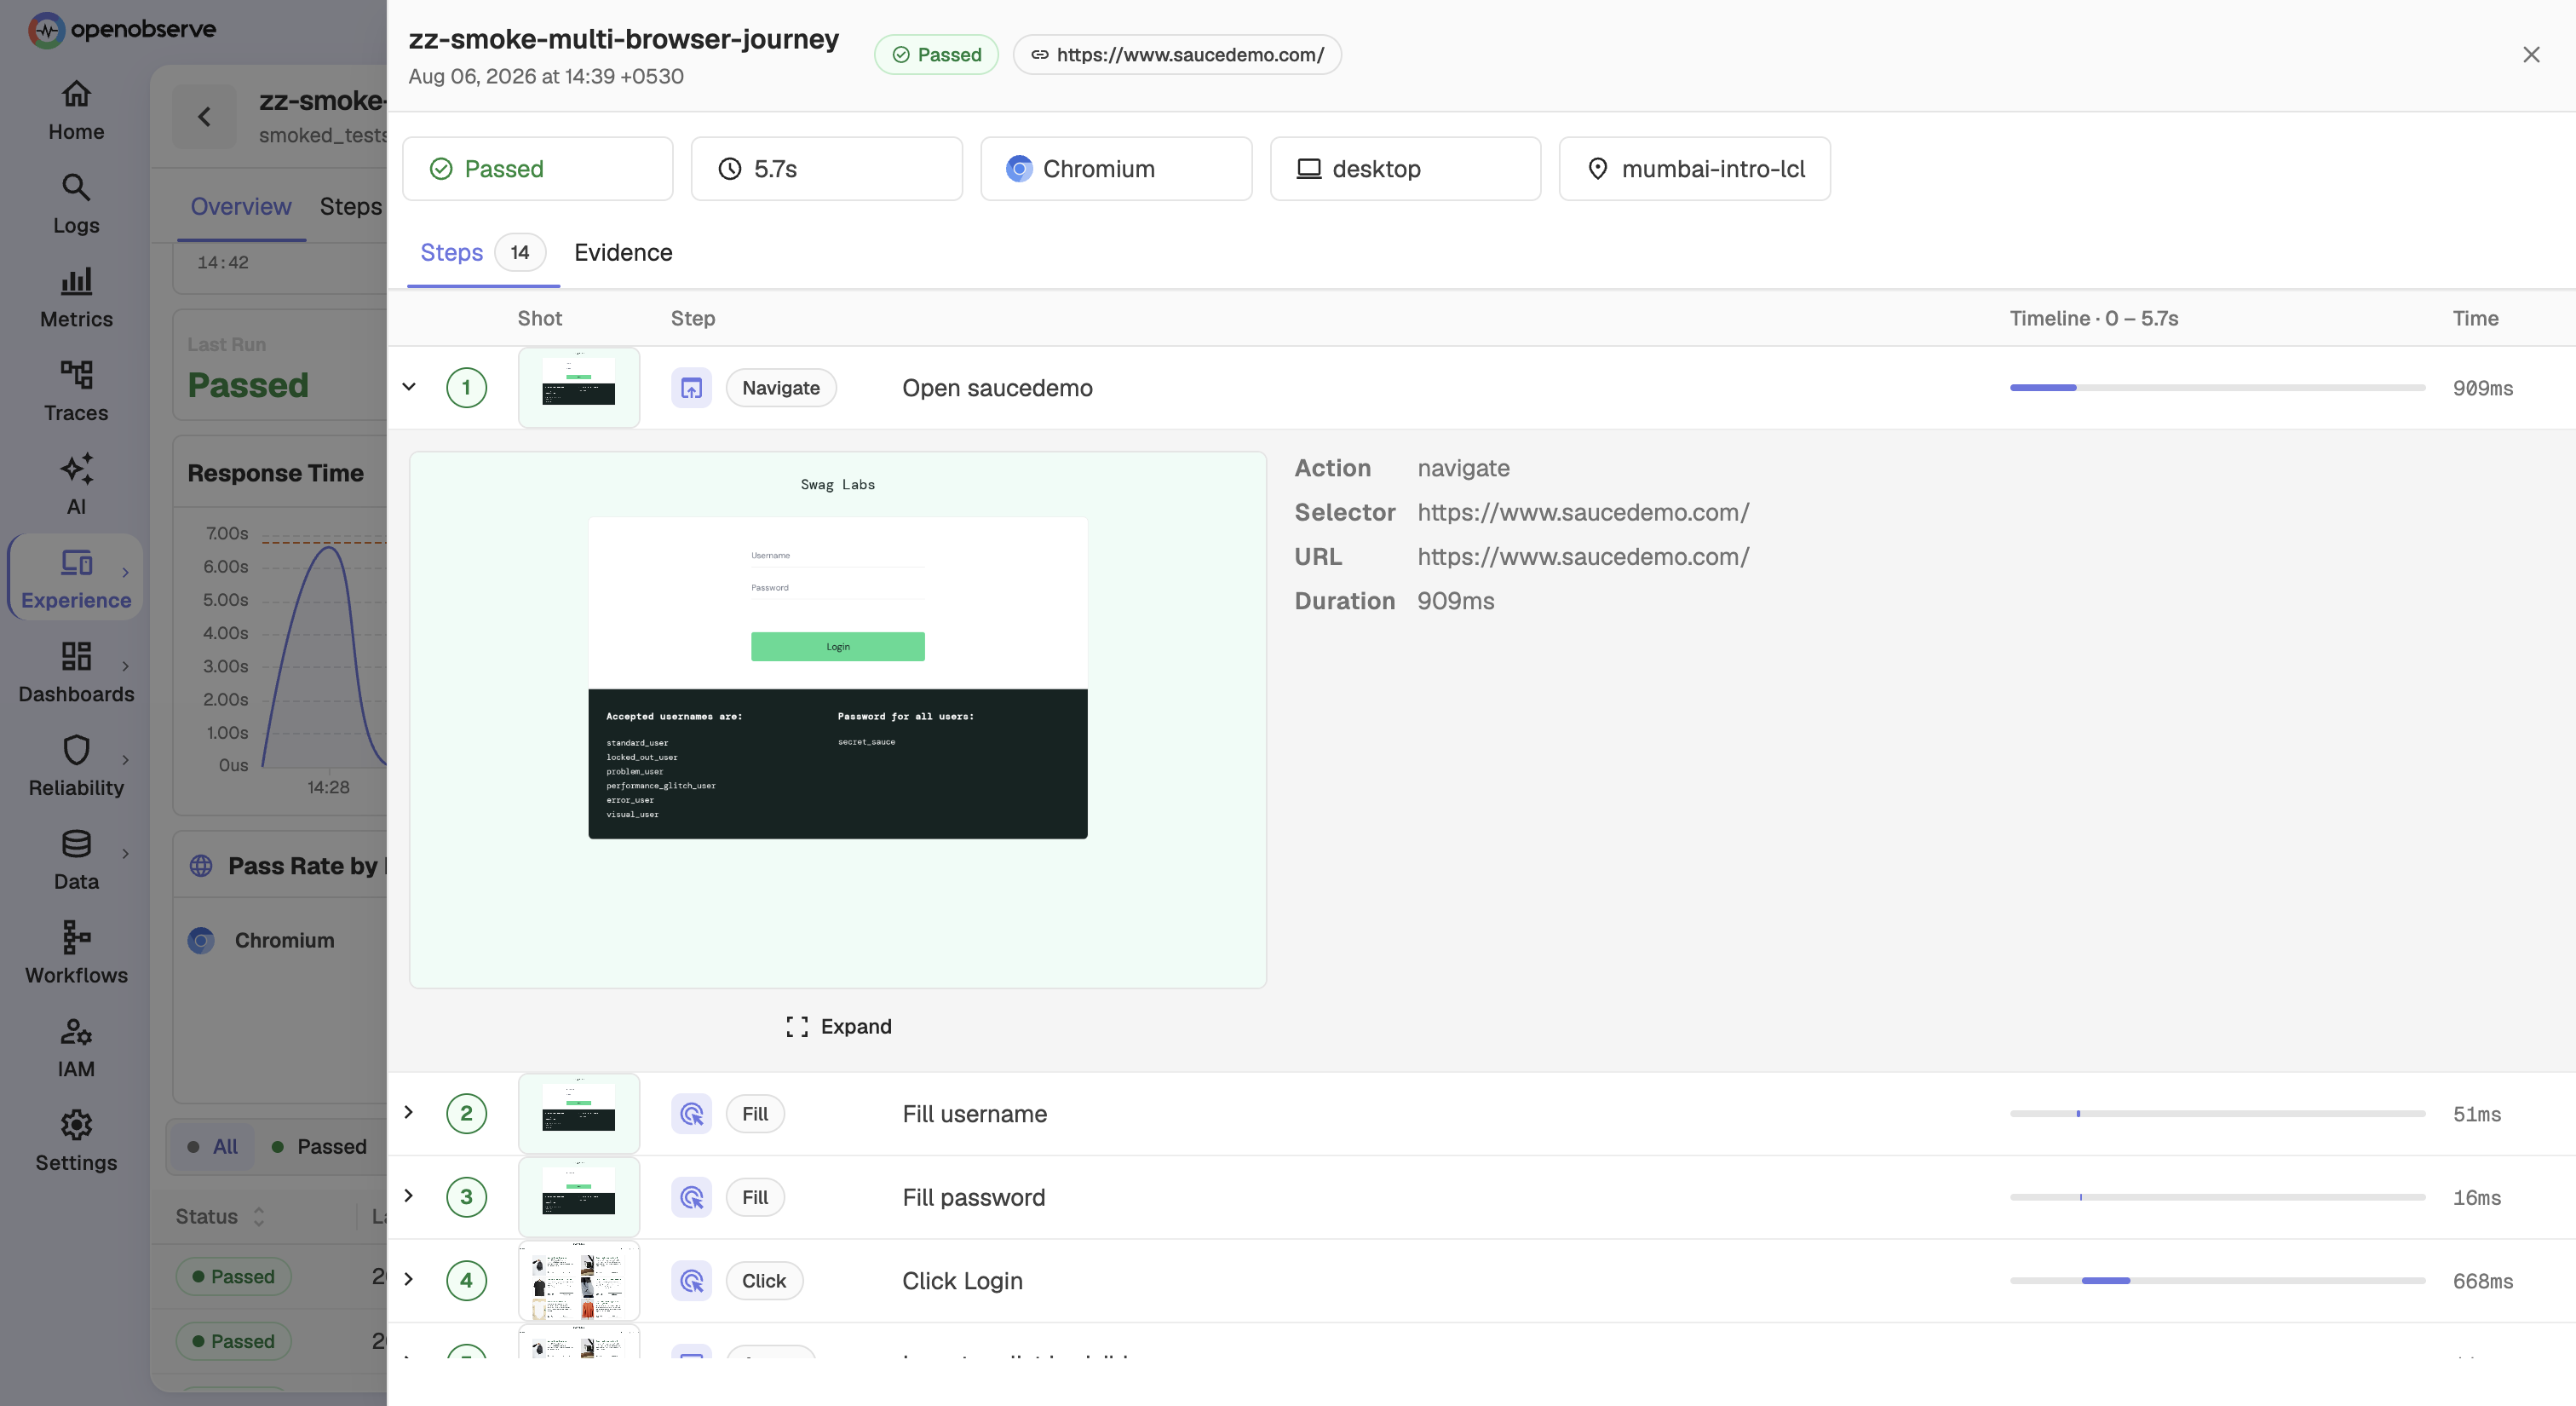
Click a run to open the run detail drawer. The Steps tab shows the journey as a timeline with a screenshot, action, and duration per step.
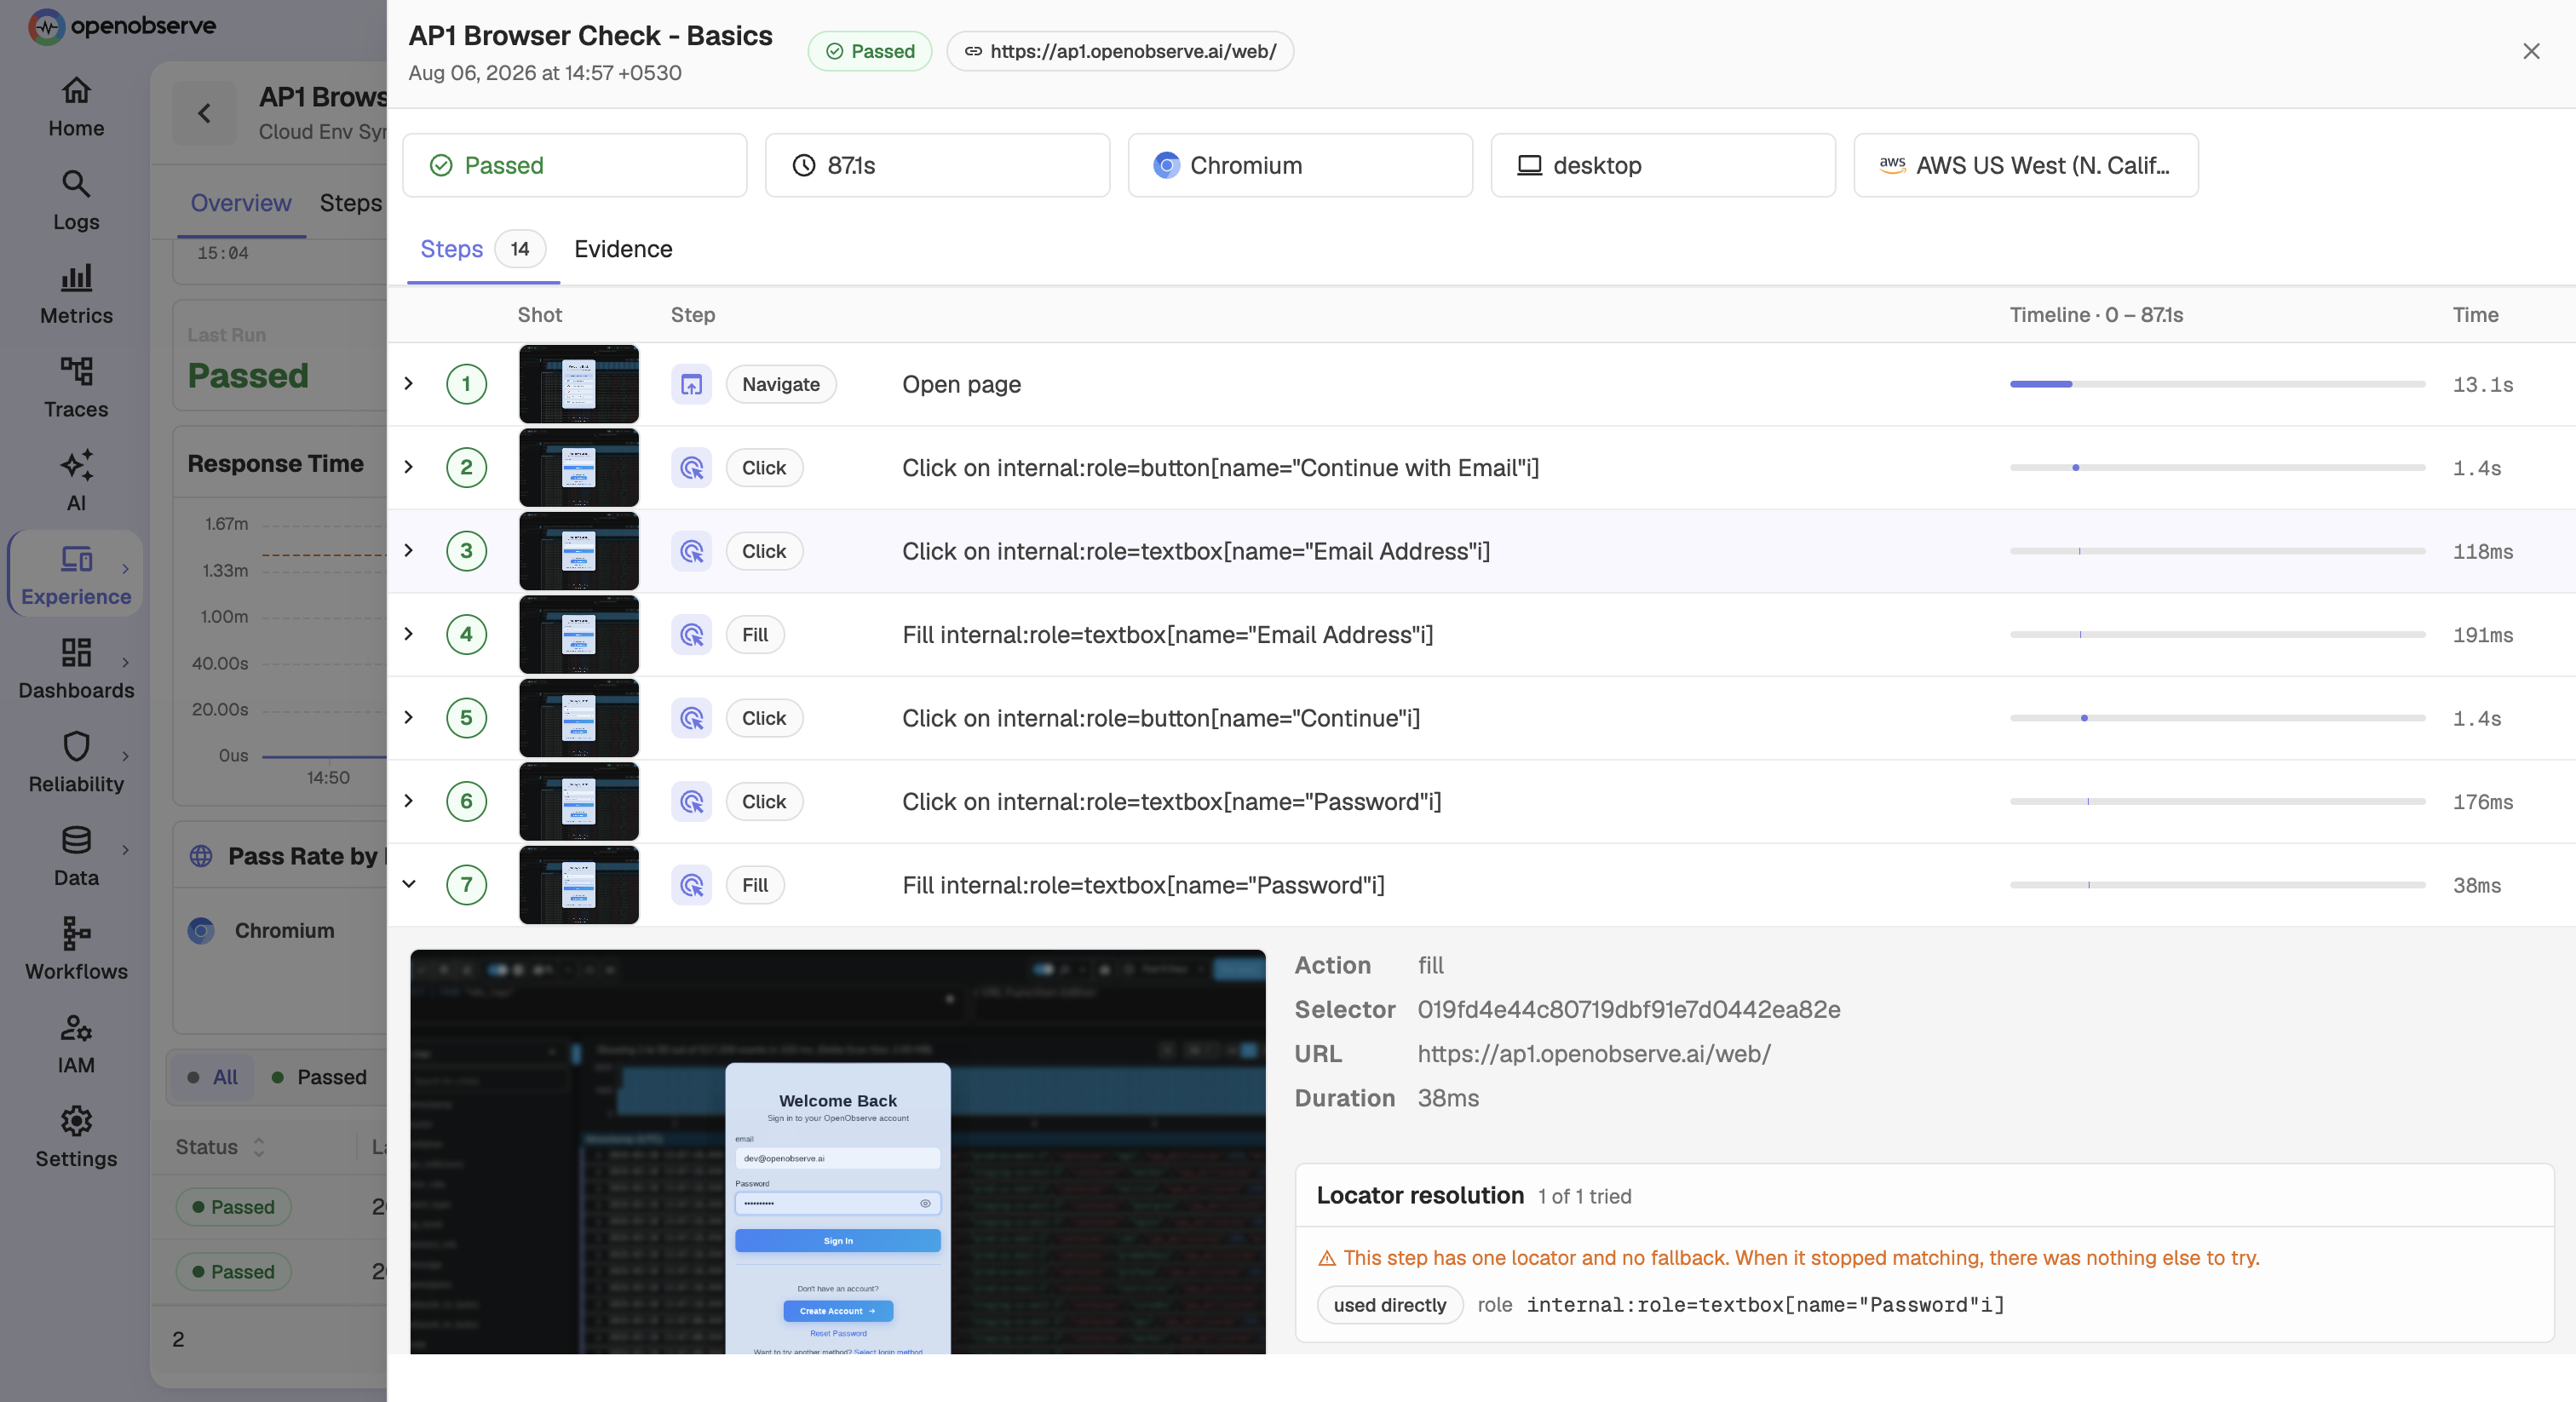
Expand any step for its full detail: the screenshot captured at that moment, the action, the selector used, the resolved URL, and the duration.
Diagnose a failure
On a failed run, the header names the failing step and the attempt that decided the run. The failed step carries its error message and the screenshot taken at that moment.
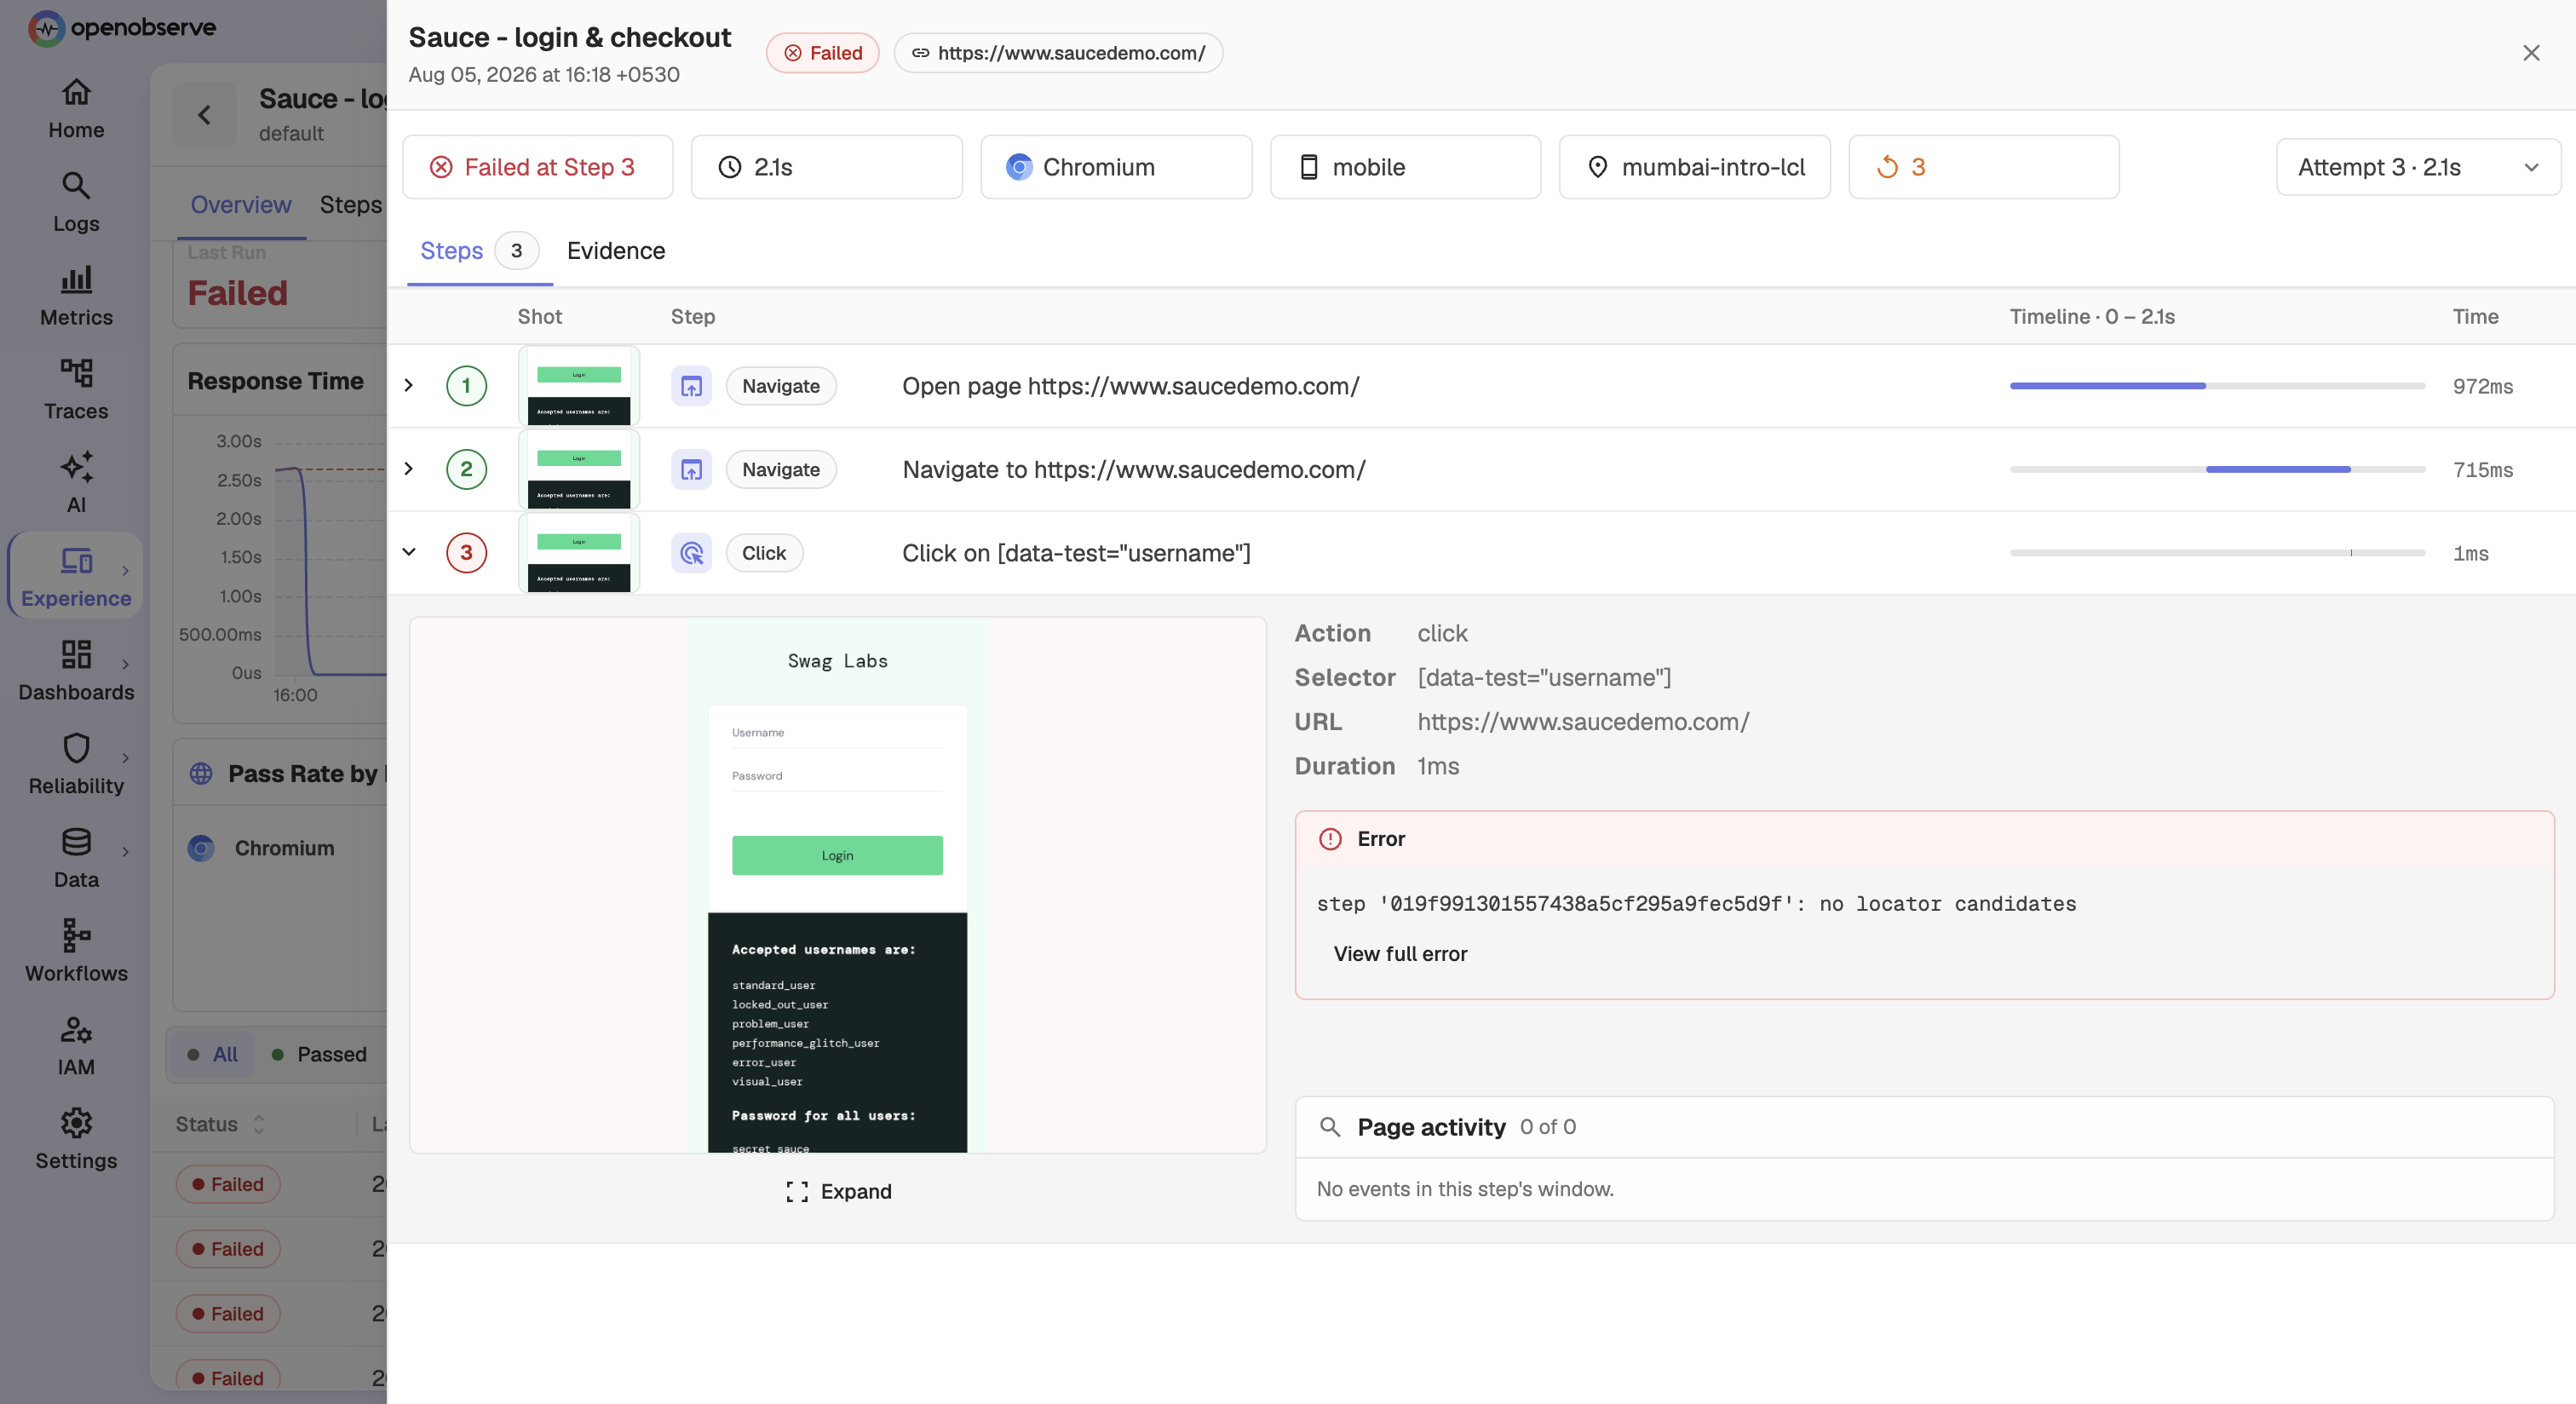
Three things on this view do most of the diagnostic work:
- Failed at Step N, which step broke, not merely that the run broke
- The attempt selector, since each retry is kept separately, so you can compare the attempt that failed with the one that decided the run
- The error message, stating what was expected and what was actually found
Two further sections appear when they have something to report. Locator resolution shows which candidate matched; if a fallback matched rather than the primary, the markup has changed under that step even though the run may have passed. Settle signals flags a recorded signal that never arrived, which is often the real cause of a later step timing out.
Tip: A failing assertion consumes its full timeout before reporting. A run that normally takes a second and suddenly takes a minute has usually not got slower. It has failed a wait.
Evidence
Open the Evidence tab for what the application was doing: console errors, page errors, failed requests, and non-2xx responses, each attributed to the step whose window it fell in.
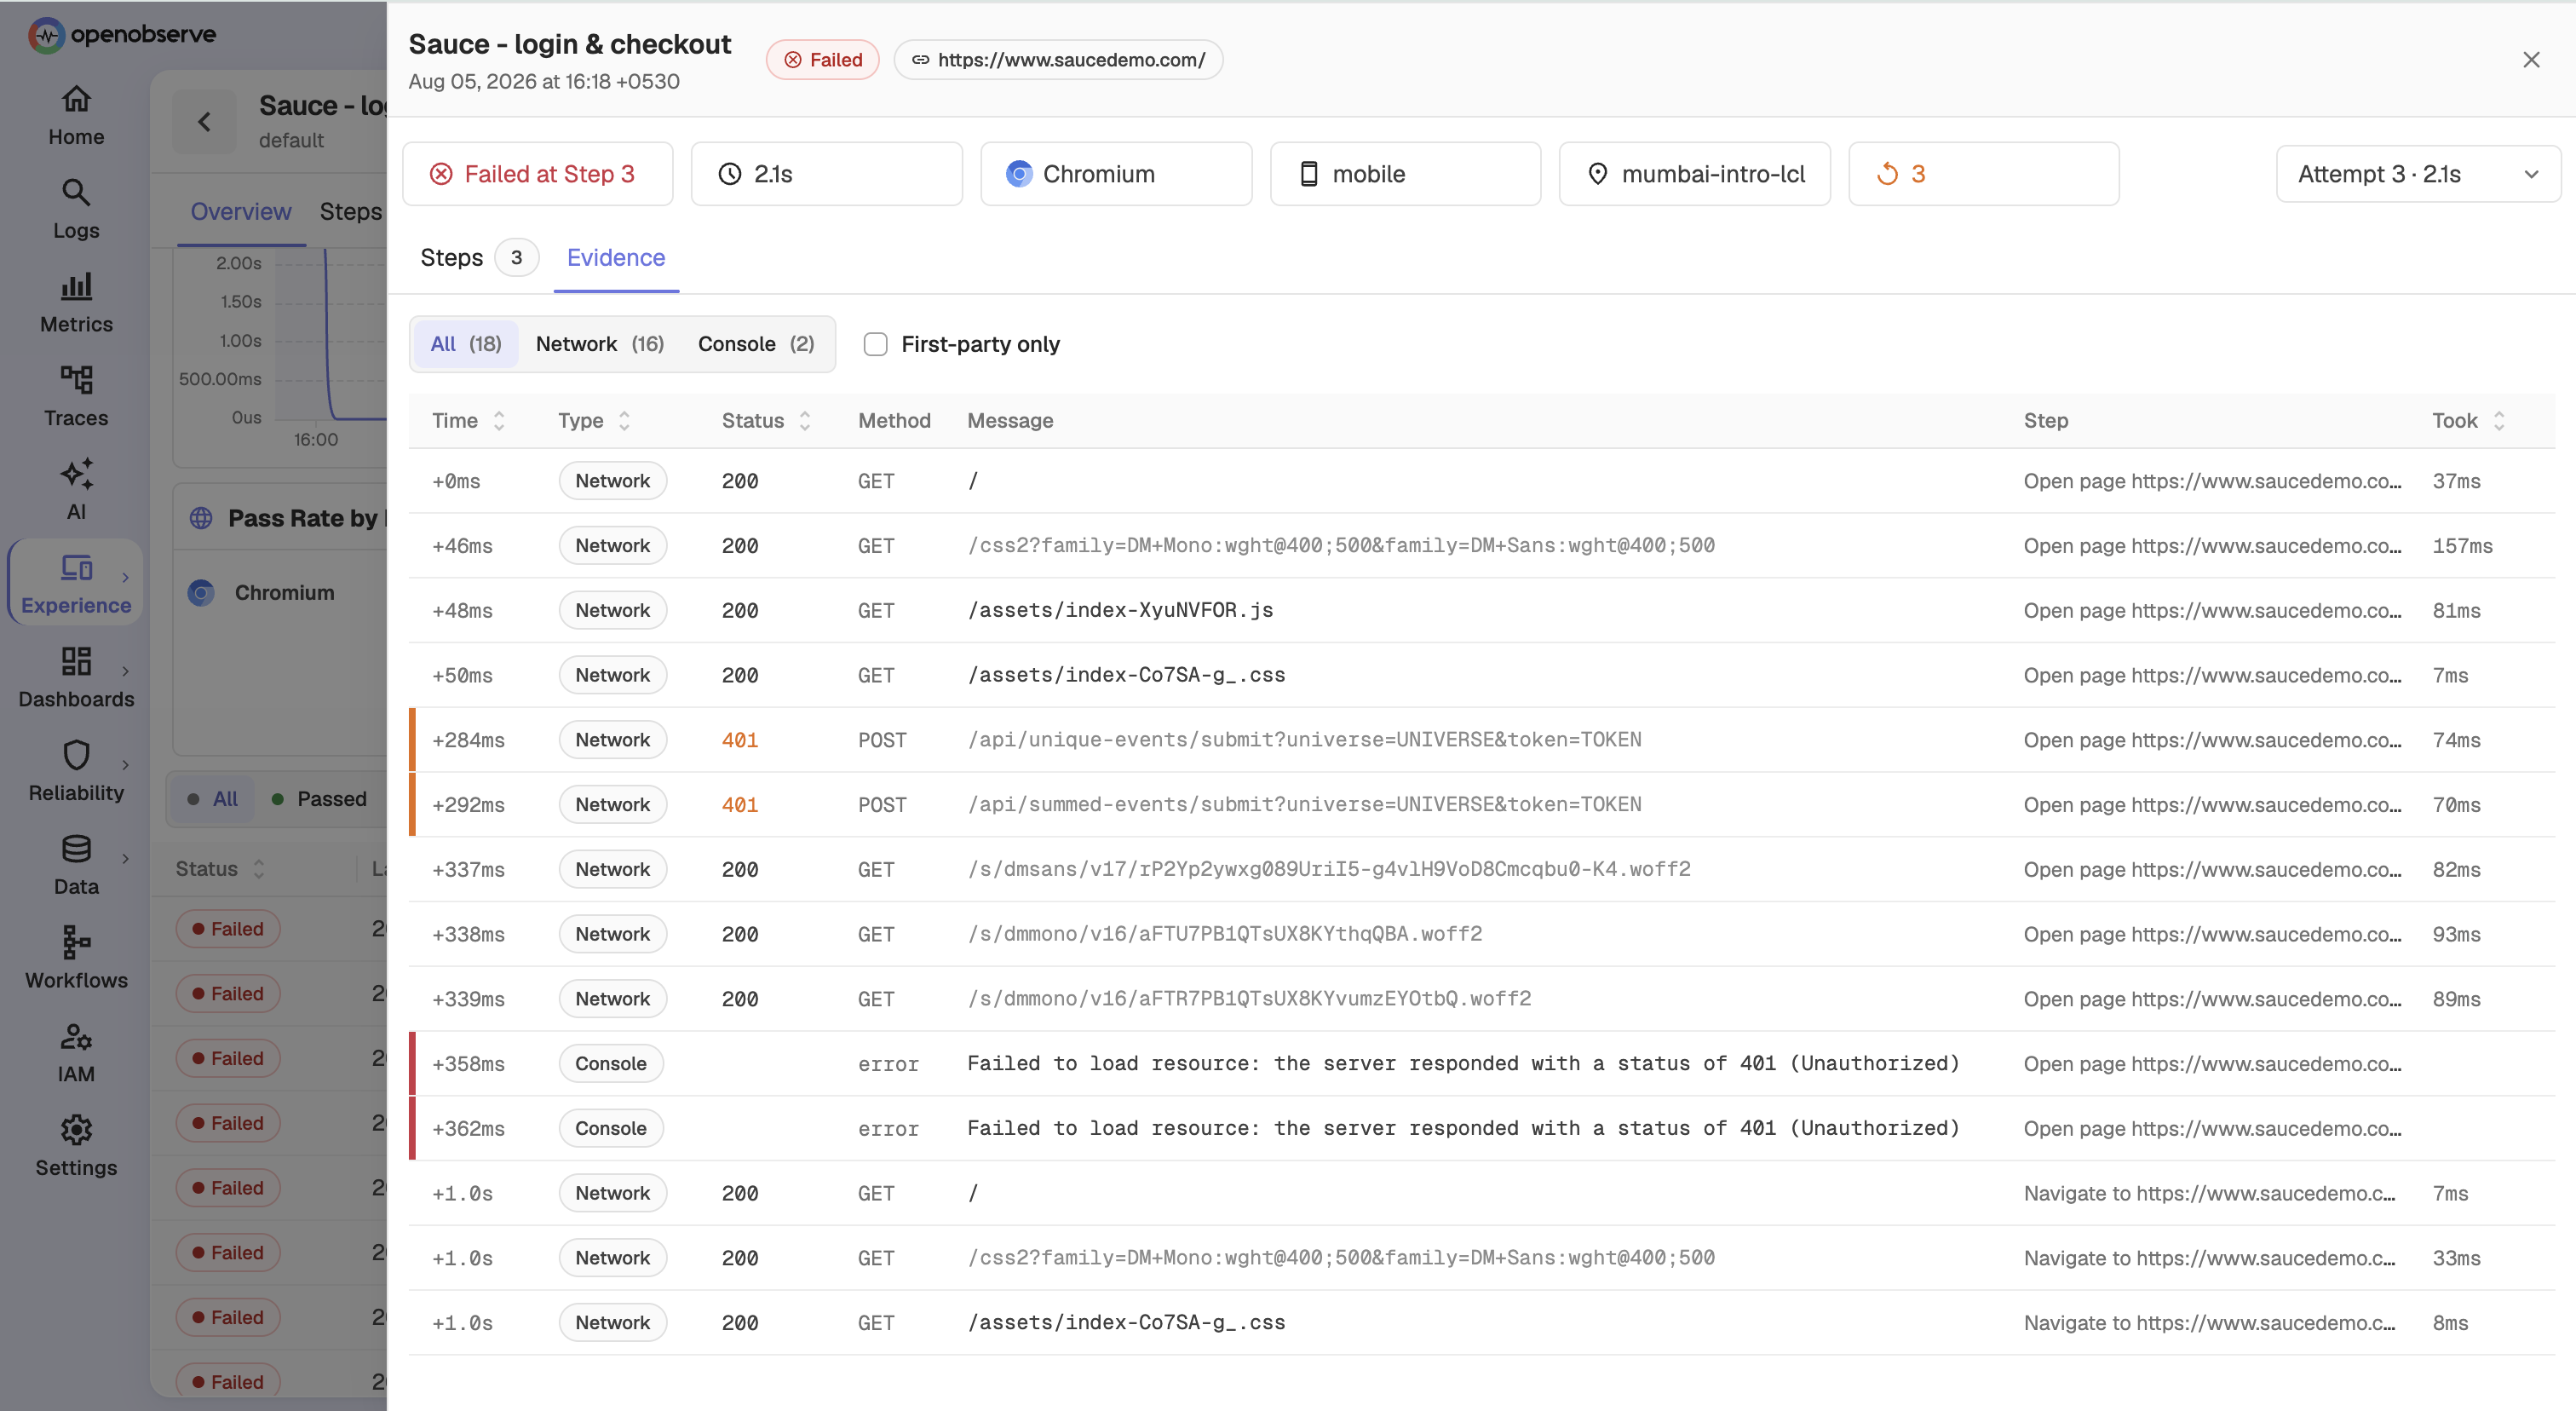
Filter by Console errors, Page errors, Non-2xx, or Failed requests, and use First-party only to hide third-party noise such as analytics and ad scripts.
Note: Evidence is retained for failed runs only. On a passing run the Evidence tab explains this rather than showing an empty table.
Read a protocol run
Protocol runs report a timing breakdown instead of a step timeline, so you can see whether latency came from DNS, connection setup, the TLS handshake, or the server itself.
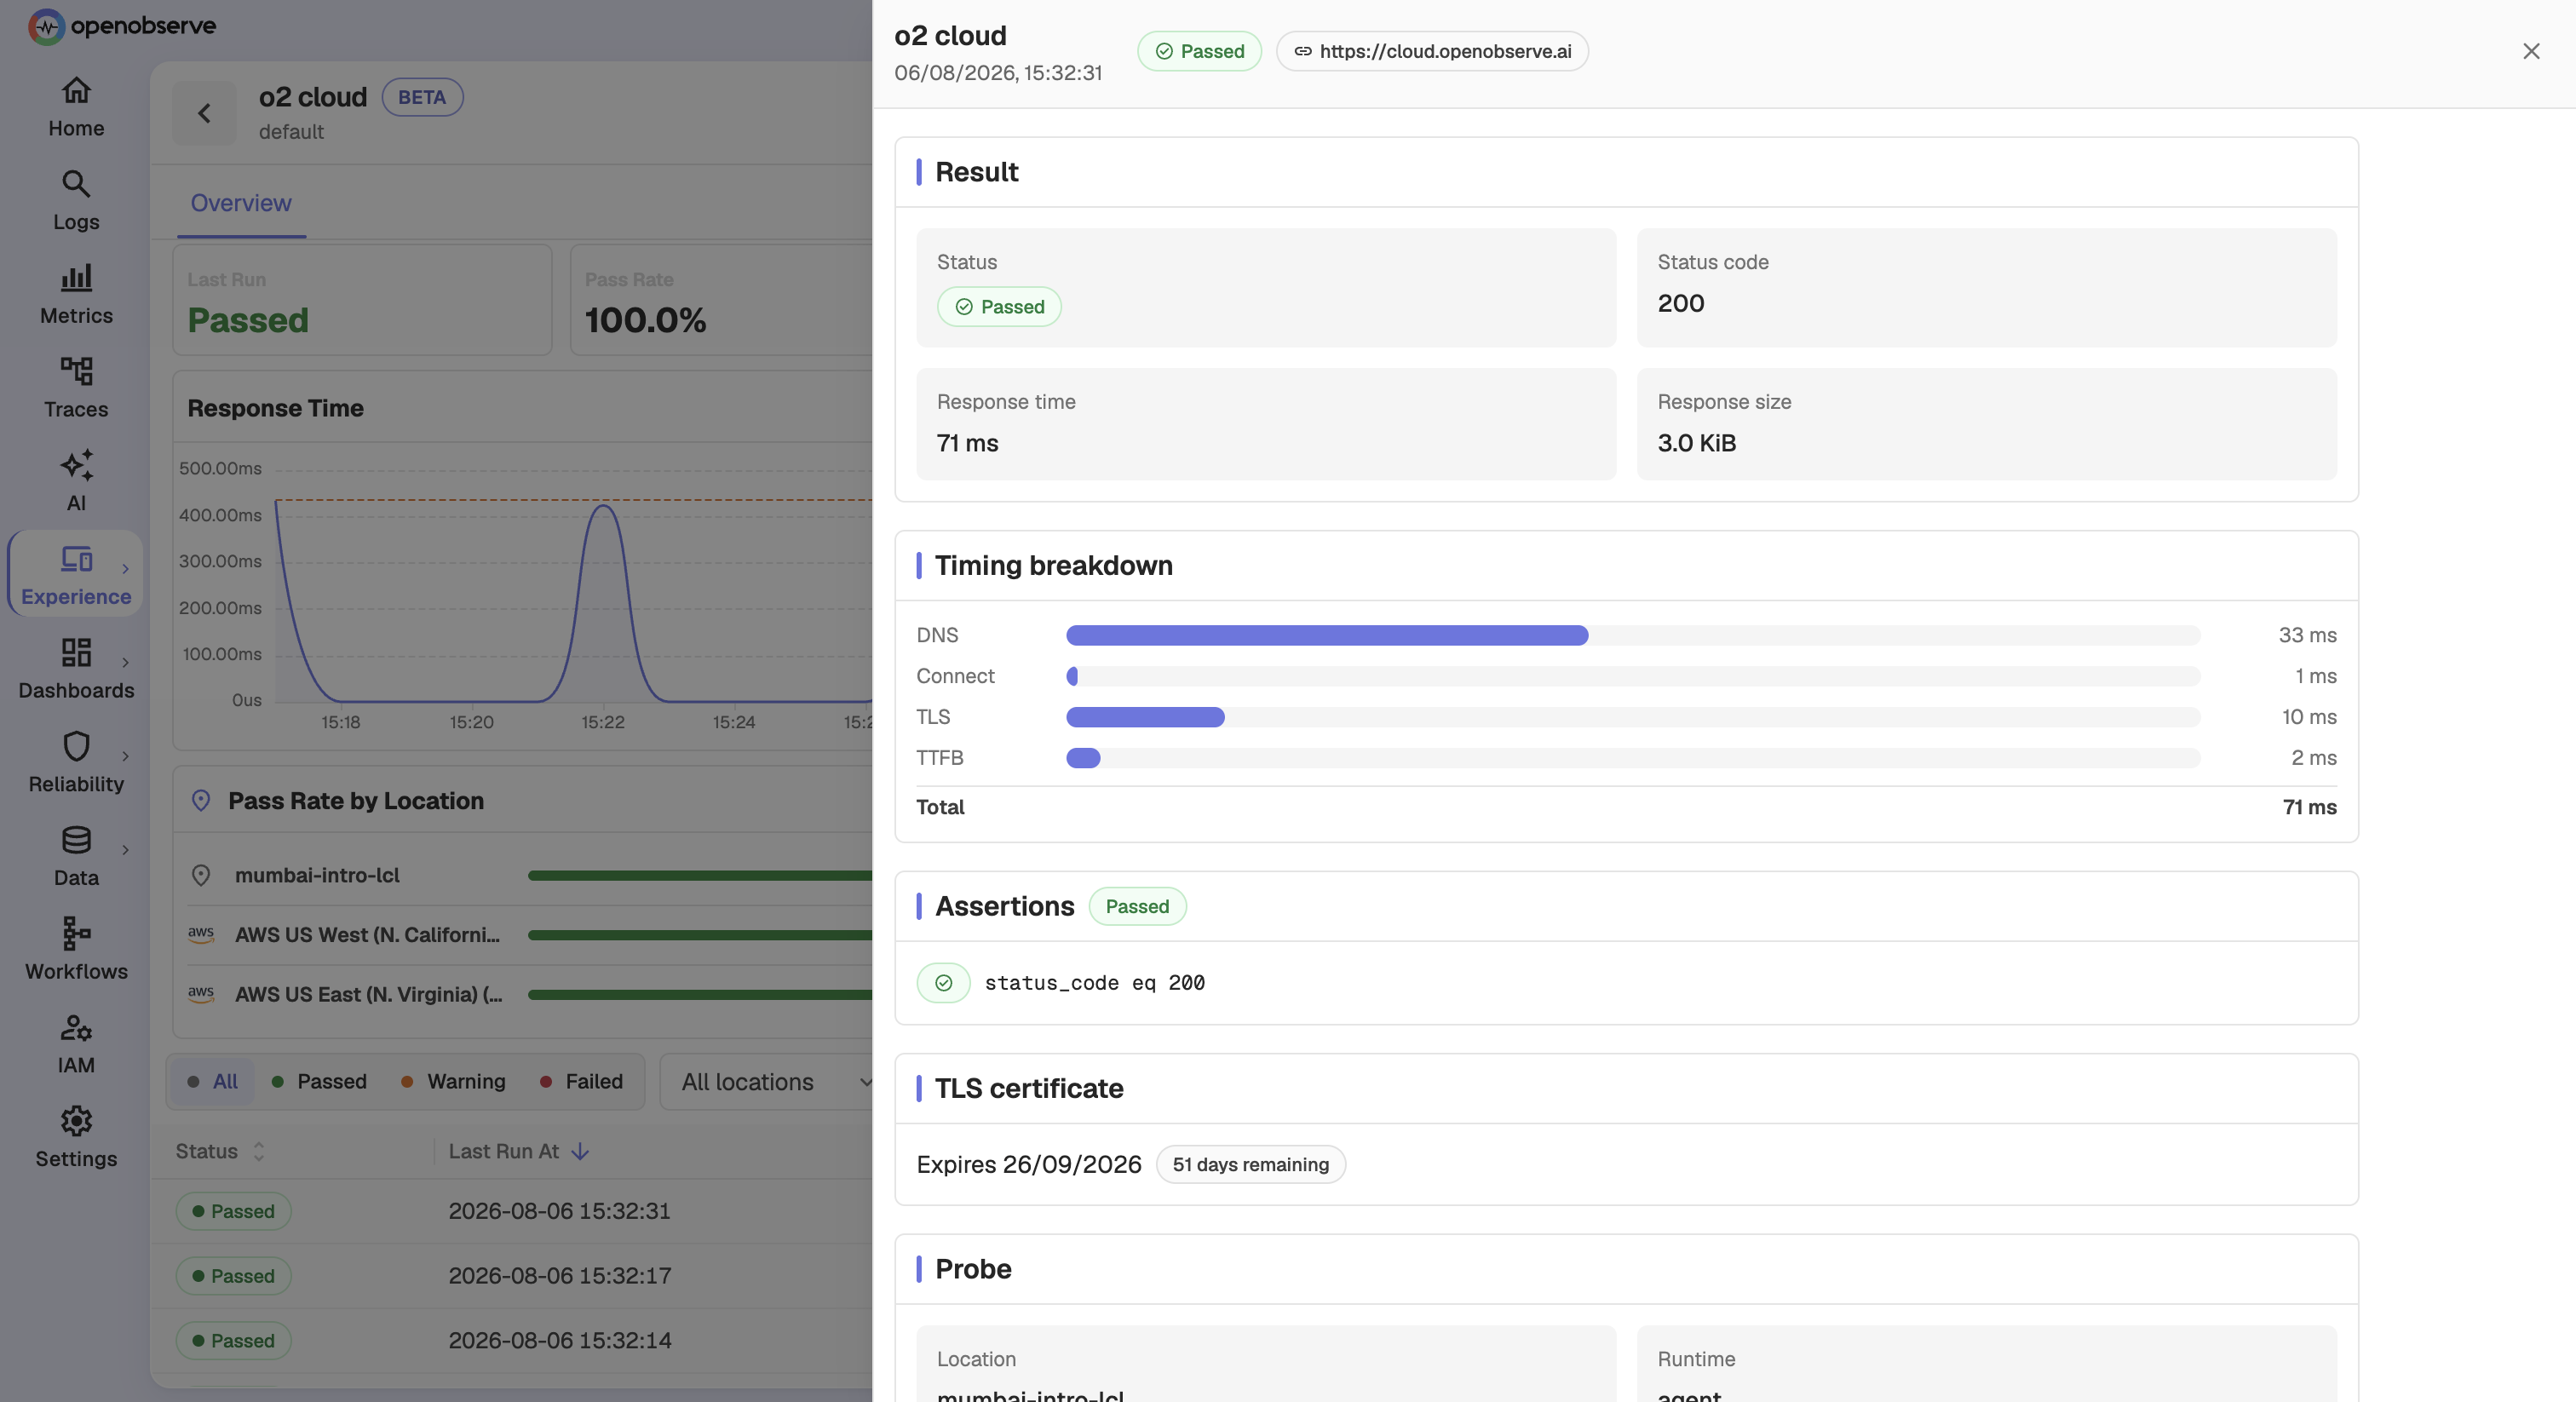
| Section | Reports |
|---|---|
| Result | Status, status code, response time, response size |
| Timing breakdown | DNS, Connect, TLS, TTFB, and Total |
| Assertions | Each assertion and whether it passed |
| TLS certificate | Expiry date and days remaining |
| Probe | Location, runtime, probe ID, and what triggered the run |
A high TTFB with low DNS and Connect times points at the application. A high TLS time points at handshake or certificate chain cost. A high DNS time points at resolution, often outside your control.
Troubleshooting
The Evidence tab is empty
Problem: You opened Evidence on a run and there is nothing there.
Solution: Evidence is retained for failed runs only. On a passing run this is expected. If a failed run's evidence will not load, the bundle may have passed its retention window, or the download link may have expired. Reload the run to get a fresh one.
No runs appear for the selected time range
Problem: The results page reports no runs.
Solution:
- If the check has never run, trigger one with Run now.
- If it has run before, use Jump to last run to move the window to the most recent data.
- Confirm the check is Enabled. A paused check does not run on its schedule.
A run reports a probe infrastructure error
Problem: A run shows an error but no step data.
Solution: The probe failed before executing the journey, so there is nothing to attribute. This is infrastructure rather than your application. If it persists across locations, contact support; if it is limited to one private location, check that its agents are healthy.
Need help:
Last updated on
Configuration
Reference for every Synthetics check setting, including details, schedule, retries, alerts, locations, browsers and devices, capture, and authentication.
Private Locations
Run Synthetics checks from inside your own network with self-registering agents, and manage the tokens those agents authenticate with.