Post by the tag: Openobserve
OpenObserve is transitioning to a fully usage-based pricing model effective June 2nd, 2025, eliminating minimum fees and the free tier. The new pay-as-you-go structure charges $0.30 per GB for log, metric, and trace ingestion, with additional fees for queries, pipelines, and advanced features like RUM and error tracking. Existing free-tier customers receive a 30-day exemption period, while current standard-tier customers will have their flat monthly fees removed after 30 days. New customers can access a 14-day free trial. The company emphasizes that their open-source version remains completely free for self-hosting, providing users with flexibility to choose between managed cloud services or self-managed deployments. This pricing change aims to create a more transparent, scalable cost structure that aligns charges with actual resource consumption while supporting OpenObserve's continued development and platform improvements.Description - OpenObserve announces usage-based pricing starting June 2025. Free tier ends, pay-as-you-go begins at $0.30/GB ingestion. 30-day transition period for existing users. Self-hosting remains free.
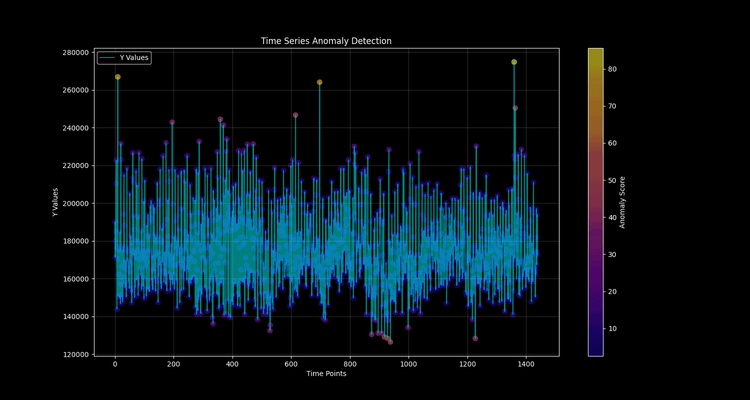
This comprehensive guide explains how to implement real-time anomaly detection using OpenObserve and the Random Cut Forest algorithm for time series data. Learn what anomaly detection is, how OpenObserve streamlines monitoring, and step-by-step instructions for setting up a robust anomaly detection system. Discover common challenges, troubleshooting tips, and best practices for scalable, cost-effective anomaly detection solutions.
Deploy OpenObserve on Heroku without DevOps complexity. Get logs, metrics, and traces monitoring running in minutes with our comprehensive deployment guide.
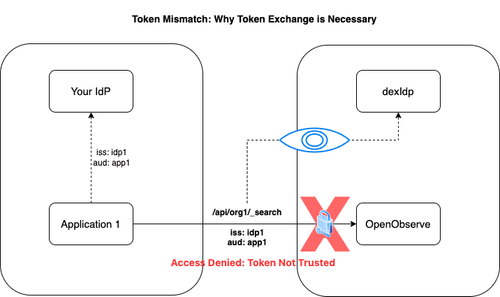
Discover OpenObserve’s Service Accounts feature, designed for secure programmatic access to APIs. Learn how token exchange enhances security and simplifies automation.
OpenObserve has just surpassed 15,000 stars on GitHub, a milestone that fills me with both pride and gratitude. When we started this project three years ago, the goal was simple yet ambitious: to build an open-source observability platform that is easier, faster, and dramatically more cost-effective than anything out there.
Learn how to securely integrate Microsoft Active Directory Domain Services (ADDS) LDAP with OpenObserve and Dex. This step-by-step guide covers authentication configuration, troubleshooting tips, and best practices for enterprise observability solutions.
This comprehensive guide walks you through the process of integrating PagerDuty with OpenObserve for effective incident management. You'll learn how to set up a PagerDuty service, create alert templates in OpenObserve, configure webhook destinations, and test your integration. Perfect for DevOps engineers, SREs, and IT professionals looking to streamline their alerting workflow and improve response times to critical issues.
Learn how to configure Datadog Agent to send metrics to OpenObserve using OpenTelemetry Collector. Complete guide with setup, troubleshooting & best practices.
Discover how OpenObserve Pipelines enable real-time log processing, dynamic data routing, and pre-aggregation for optimized observability. Learn to transform raw logs into structured formats using VRL functions, efficiently route logs based on conditions, and pre-aggregate metrics to improve performance. This in-depth guide covers step-by-step implementation, from ingesting logs to building powerful OpenObserve Pipelines for seamless log management and analytics. Perfect for DevOps, SREs, and observability engineers looking to enhance log processing workflows.
Learn How to deploy OpenObserve on Amazon EKS with ALB ingress. Step-by-step guide on setup, for better security, performance, and compliance.
Learn how to configure Okta SSO with OpenObserve Dex using OAUTH for seamless authentication. Discover why Dex simplifies identity management, and follow a step-by-step guide to set up Azure AD authentication with Dex. Enhance security, streamline user access, and optimize performance with this modern authentication approach.
Learn how to configure Azure SSO with OpenObserve Dex using OpenID Connect (OIDC) for seamless authentication. Discover why Dex simplifies identity management, why OIDC is recommended over SAML, and follow a step-by-step guide to set up Azure AD authentication with Dex. Enhance security, streamline user access, and optimize performance with this modern authentication approach.
Learn how to configure email alerts in OpenObserve with this step-by-step guide. Set up Gmail SMTP, create alert templates, and ensure instant notifications for critical system events
Discover the latest release of OpenObserve, version 0.13.1-rc1! Enjoy faster search speeds, advanced dashboard features, enhanced alerting with multiple time range and VRL support, and optimized performance. Experience next-level observability with these powerful updates and more in OpenObserve 0.13.1-rc1.
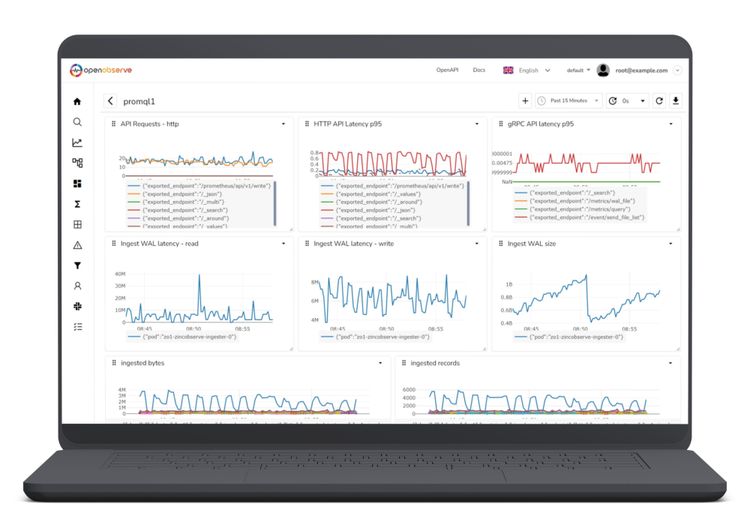
Learn how to create effective monitoring dashboards with OpenObserve. This guide covers installation, sample data setup, and dashboard creation, highlighting key features like customizable panels and dynamic filtering for enhanced application performance monitoring.
This blog helps you in getting started with understanding migration from ELK to OpenObserve Streamlining Log Management for Better Insights.
How to configure journald.conf to customize journald logging in Linux
What are Apache, GPL and AGPL licenses and why OpenObserve moved from Apache to AGPL
We delves into our strategic shift from using Plotly to adopting Apache ECharts for our data visualization needs. It explores the reasons behind this decision, the comparative strengths and weaknesses of both tools, and the impact of this change on our user experience and technical operations
Jidu acheived 100% tracing fidelity with OpenObserve by migrating from Elasticsearch to OpenObserve. Read this case study to learn how they did it.
OpenObserve is an open source, cloud native open source observability platform that provides ~140x (YMMV. Could be higher or lower based on data entropy) lower storage costs compared to Elasticsearch. Use cases include real-life log data, significantly reduces operational costs, and improves ease of use. It can scale to petabytes of data, is highly performant, and allows you to sleep better at night 😴. If you are looking for an observability tool for logs, metrics, and traces, take a look at OpenObserve and how its approach towards observability could help you build better software and save money on observability costs.


![Building Monitoring Dashboards with OpenObserve [Tutorial]](https://openobserve-staging-website.s3.us-west-2.amazonaws.com/assets/medium_image16_fabb63f803.png)