









“OpenObserve helped us migrate from Datadog in under an hour... reducing observability costs by 4x.”

4x
Lower observability cost

< 1 hour
Migrated off Datadog

Flat pricing
No month-end surprises
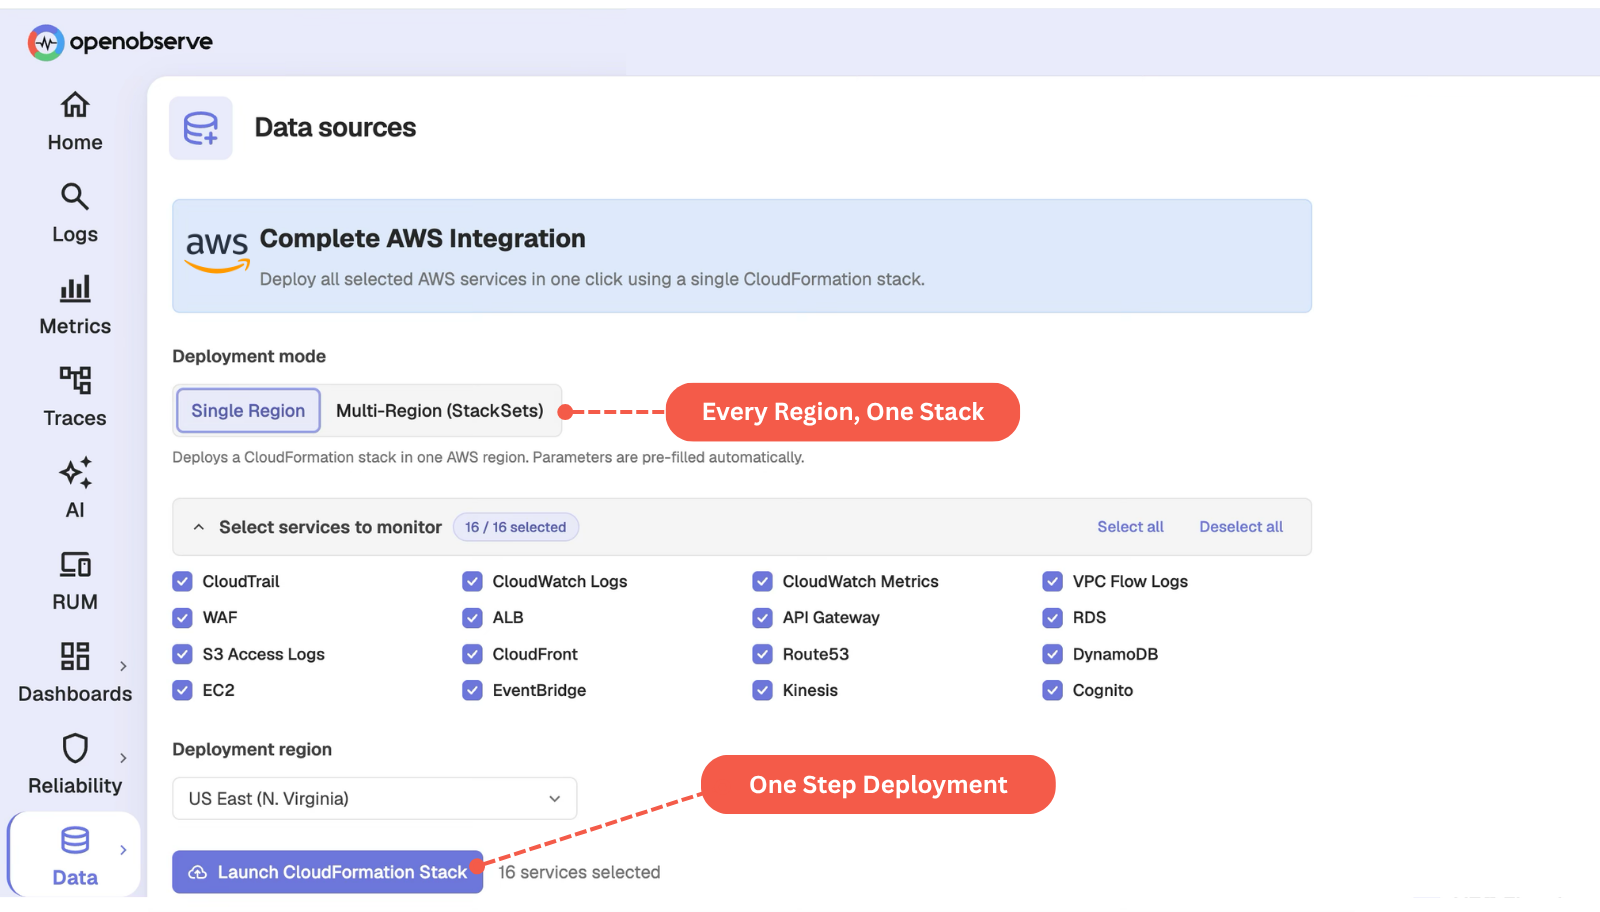
One CloudFormation stack deploys every service you select, fully parameterized.
Account activity and API usage
Add SourceAdd DashboardALB access logs, errors, latency
Add SourceAdd DashboardStream logs for analysis
Add SourceAdd DashboardBilling analytics
Add SourceAdd DashboardOne stack, or add services one at a time - each with its dashboard.
Connect your AWS estate in minutes. OpenObserve ingests directly from the services you already run - no agents, no custom glue code.



















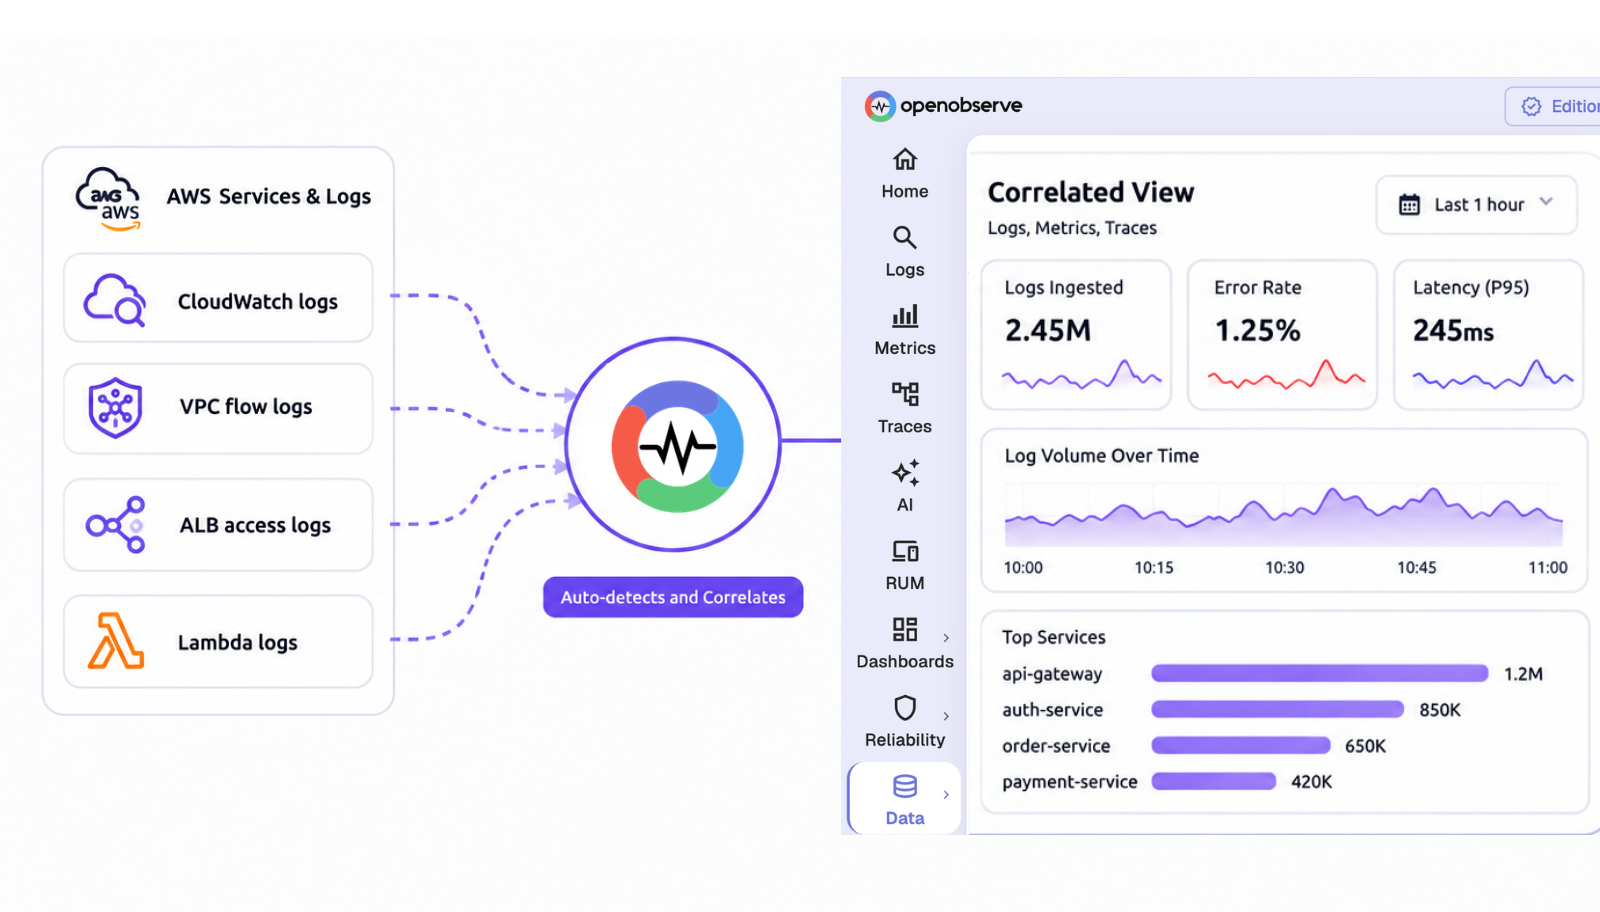
CloudWatch, VPC Flow Logs, ALB, and Lambda telemetry in one place, across one region or every region.
Select your services, deploy a single CloudFormation stack, done. No per-service wiring.
Keep a full year of AWS history at a fraction of the cost of index-heavy tools.
Deploy monitoring for every AWS service you select in a single step. One CloudFormation stack replaces service-by-service setup.
Extend monitoring to every region without repeating setup per account. StackSets deploy the same stack across your entire AWS footprint.
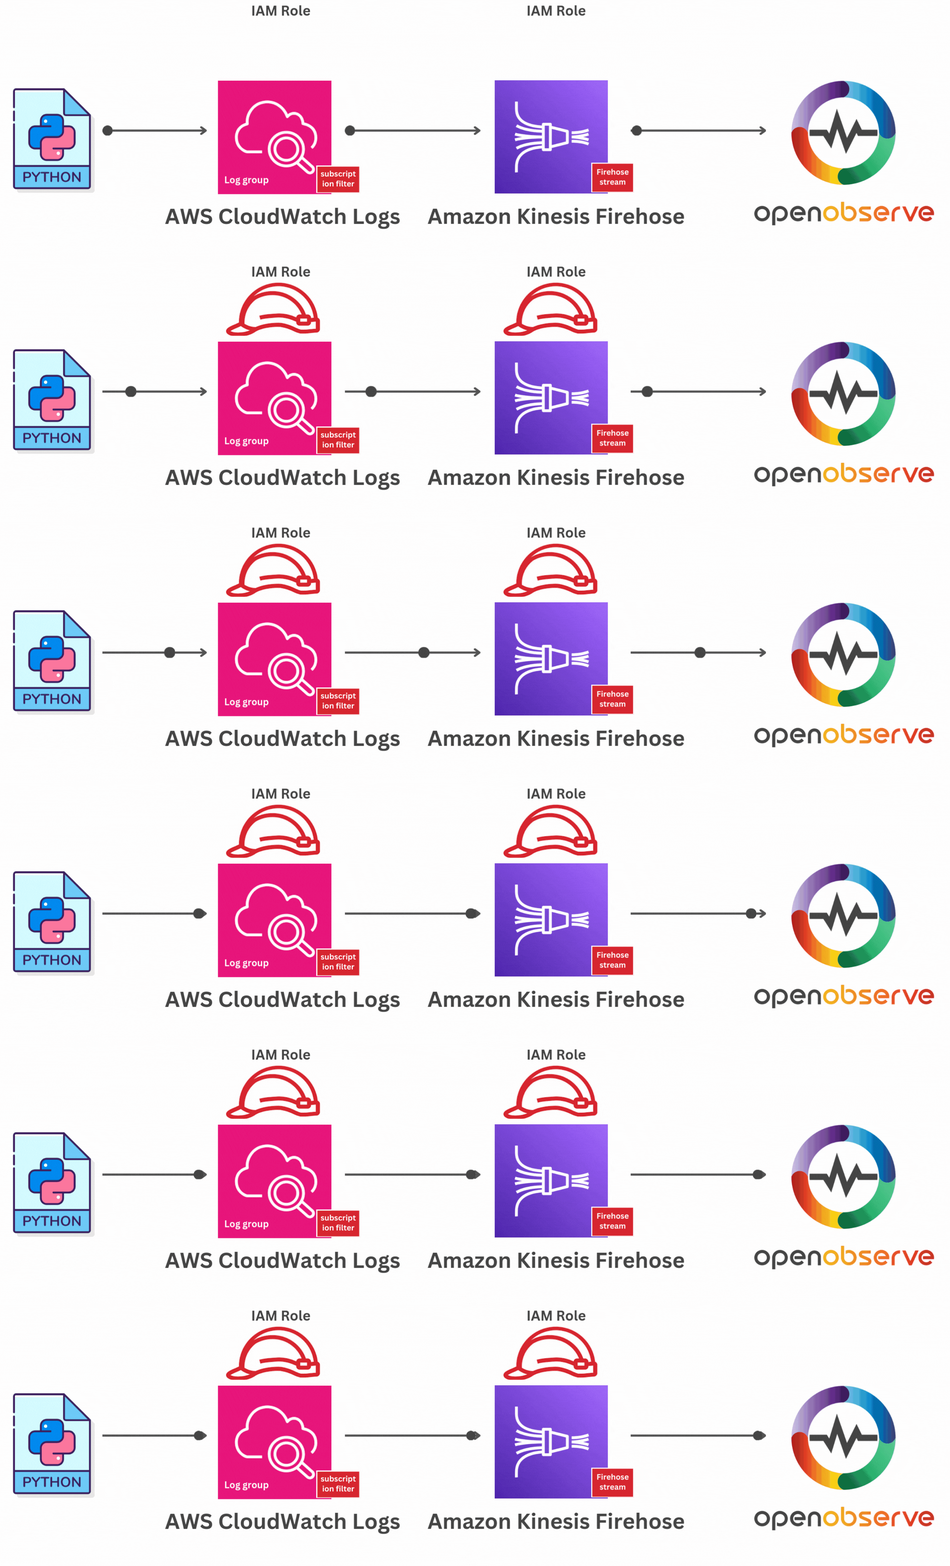
Get logs and metrics from CloudWatch, VPC Flow Logs, ALB, and Lambda without writing custom parsers.
See the complete path a request took across your AWS estate. Logs, metrics, and traces are correlated automatically.
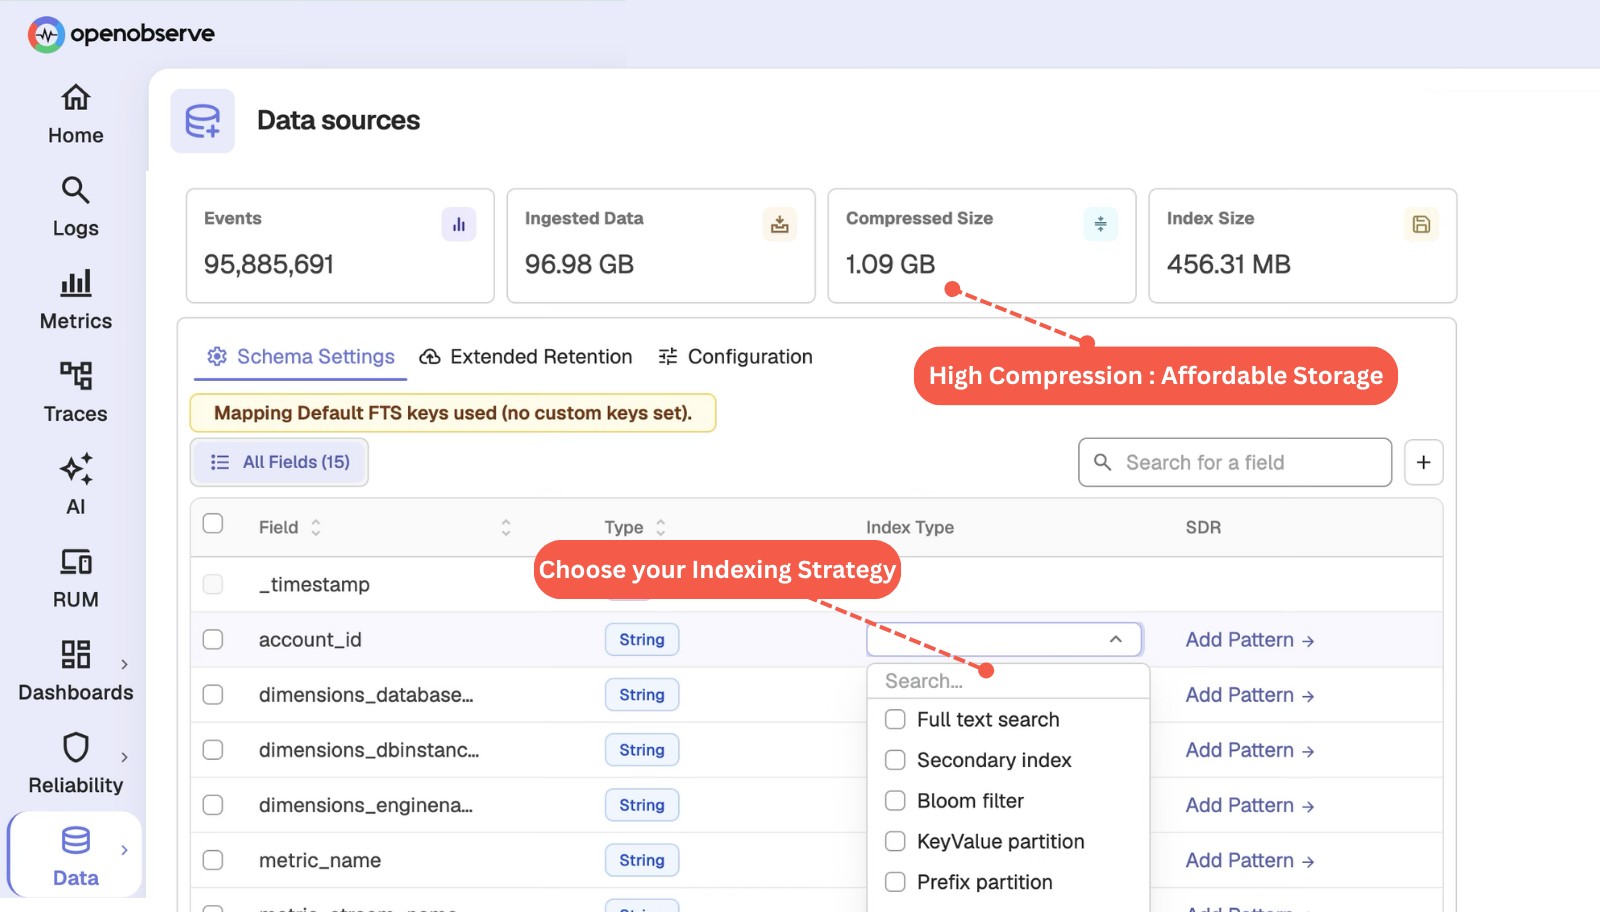
Keep a full year of AWS telemetry without the cost forcing shorter retention. Columnar storage compresses data without slowing down queries.
Never lose the record you need during an incident. Every log and metric is indexed, not sampled.
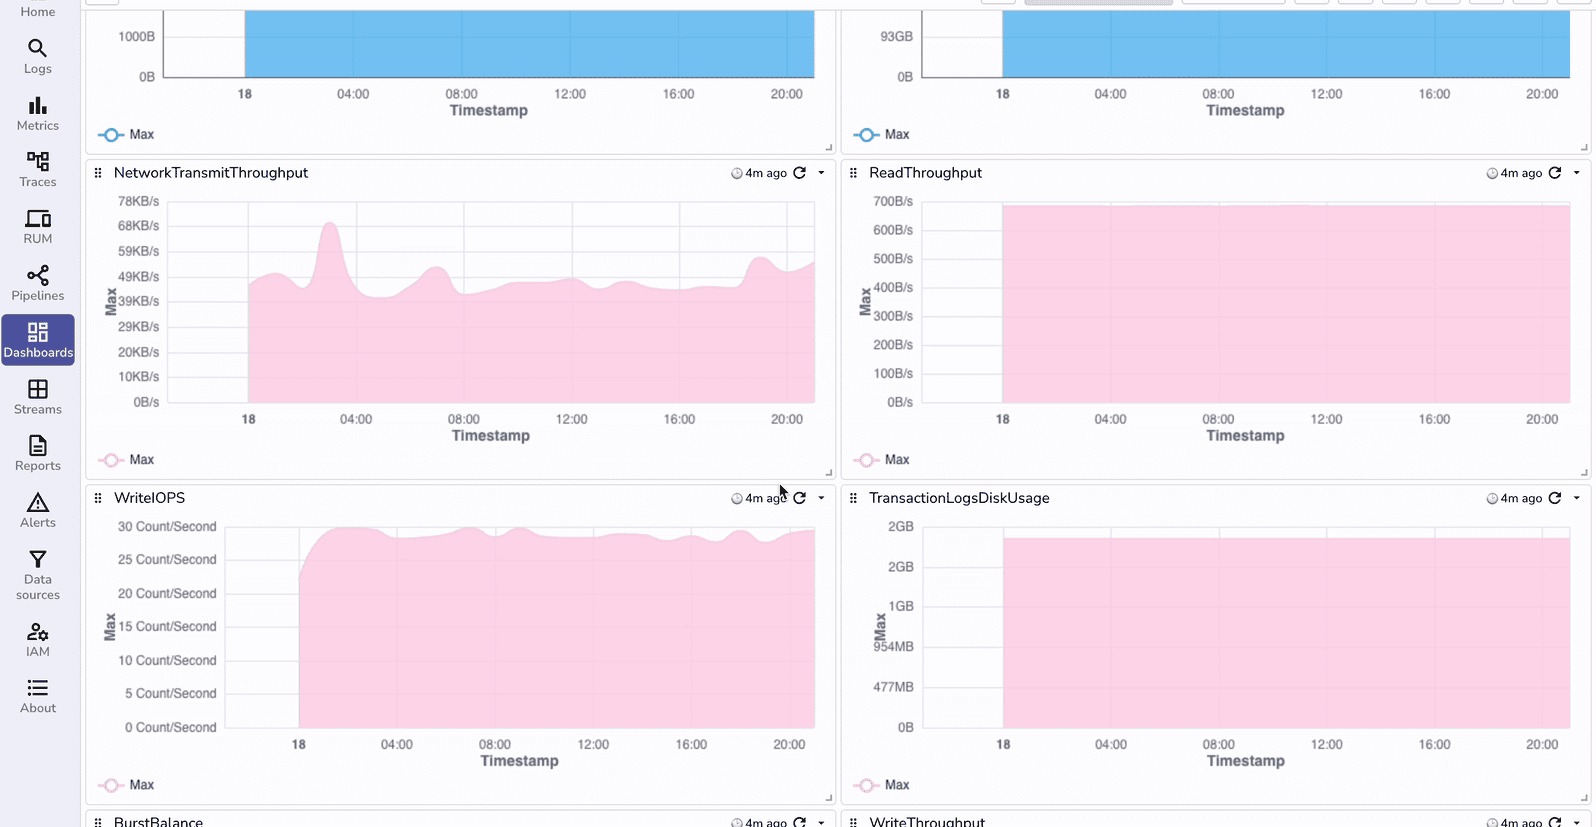
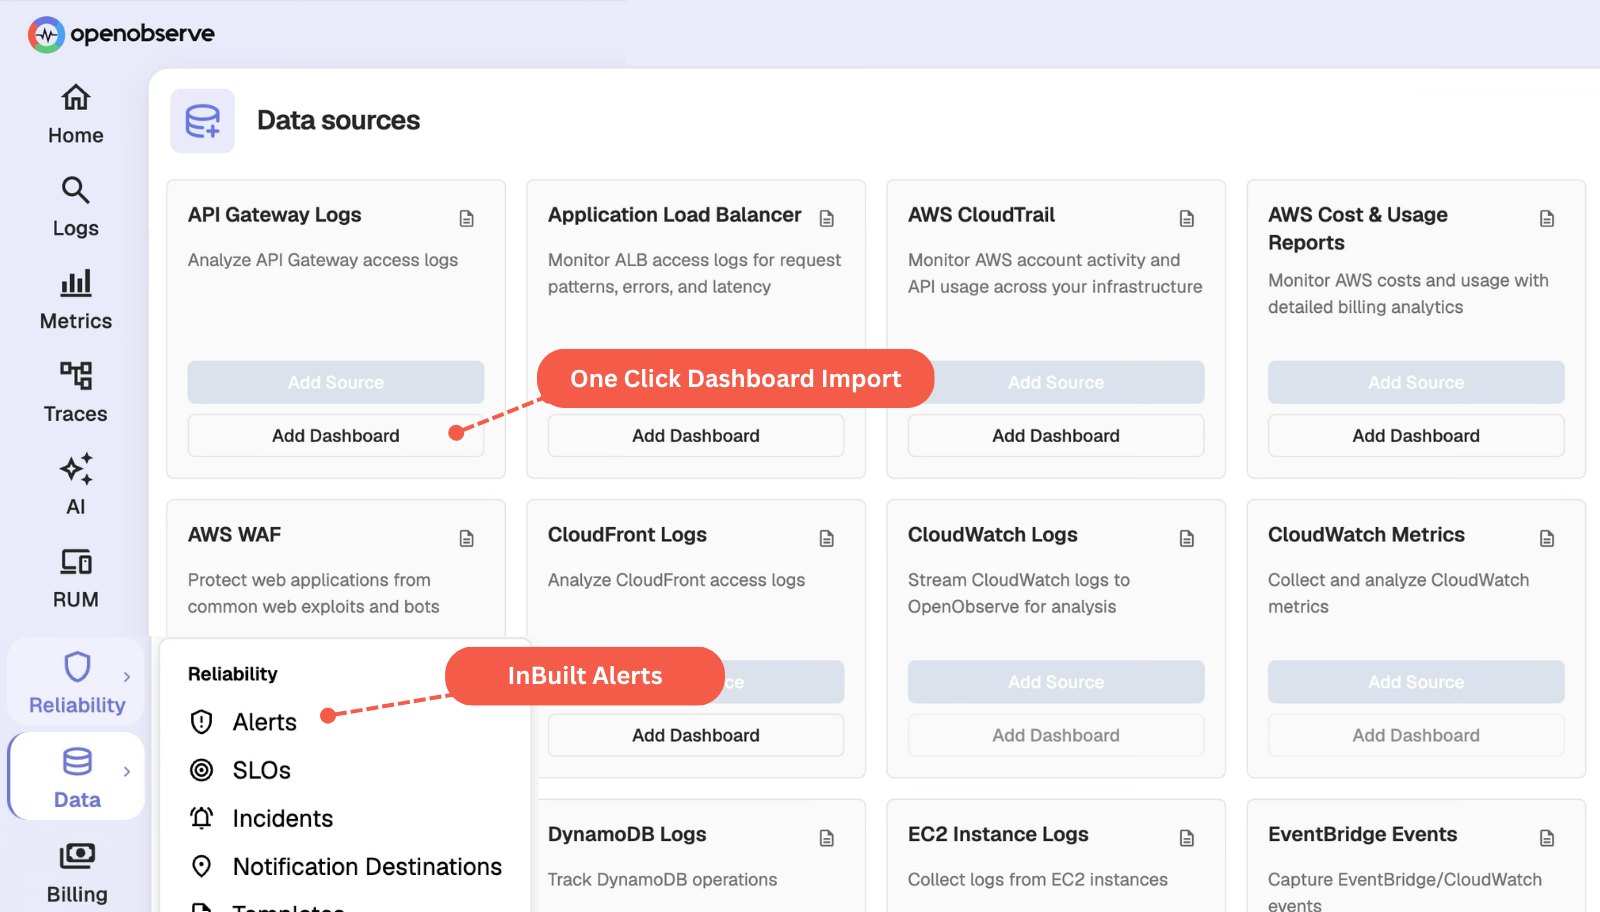
Start monitoring without building dashboards first. Common AWS views ship ready to use.
Set thresholds the moment data arrives, without wiring a separate alerting pipeline.
Same telemetry, same workloads, one platform. Every number is OpenObserve against a named vendor - not an industry average.
vs. Datadog
8×
more cost-effective
8x cost reduction means you can unify your observability into a single platform.
vs. Elastic
140×
storage efficiency
140x storage means longer retention doesn't necessarily mean expensive bills.
vs. Grafana stack
5–15×
faster performance
5x to 15x faster queries mean dashboards load in milliseconds, not minutes.
See how much you'd save switching today.
Correlate between the environments and signals across various sources with OpenObserve built-in correlation engine.
“OpenObserve helped us migrate from Datadog in under an hour... reducing observability costs by 4x.”
4x
Lower observability cost
< 1 hour
Migrated off Datadog
Flat pricing
No month-end surprises
From zero to AWS dashboards in minutes - no agents to babysit, no pipelines to wire by hand.
See the guideSpin up a in the region closest to you.
Point Kinesis Firehose or CloudWatch at OpenObserve and load prebuilt AWS dashboards in a couple of clicks.
Watch logs, metrics, and traces stream in - correlated and query-ready from the first event.
to help you get the most out of AWS monitoring.
Monitor every AWS service you run with prebuilt dashboards, metrics, and alerting rules. Pick the plan that fits your team.
Self-hosted Enterprise, free up to 50GB. Advanced features for growing teams.
Fully managed OpenObserve in the cloud. Start with a free trial - no infrastructure to run.
Enterprise-grade support, SSO, and SLAs for large-scale, multi-region deployments.

AI Observability by OpenObserve
OpenTelemetry-native observability for agents and LLMs.