“OpenObserve helped us migrate from Datadog in under an hour... reducing observability costs by 4x.”

4x
Lower observability cost

< 1 hour
Migrated off Datadog

Flat pricing
No month-end surprises
PromQL and SQL. Full resolution, retained.
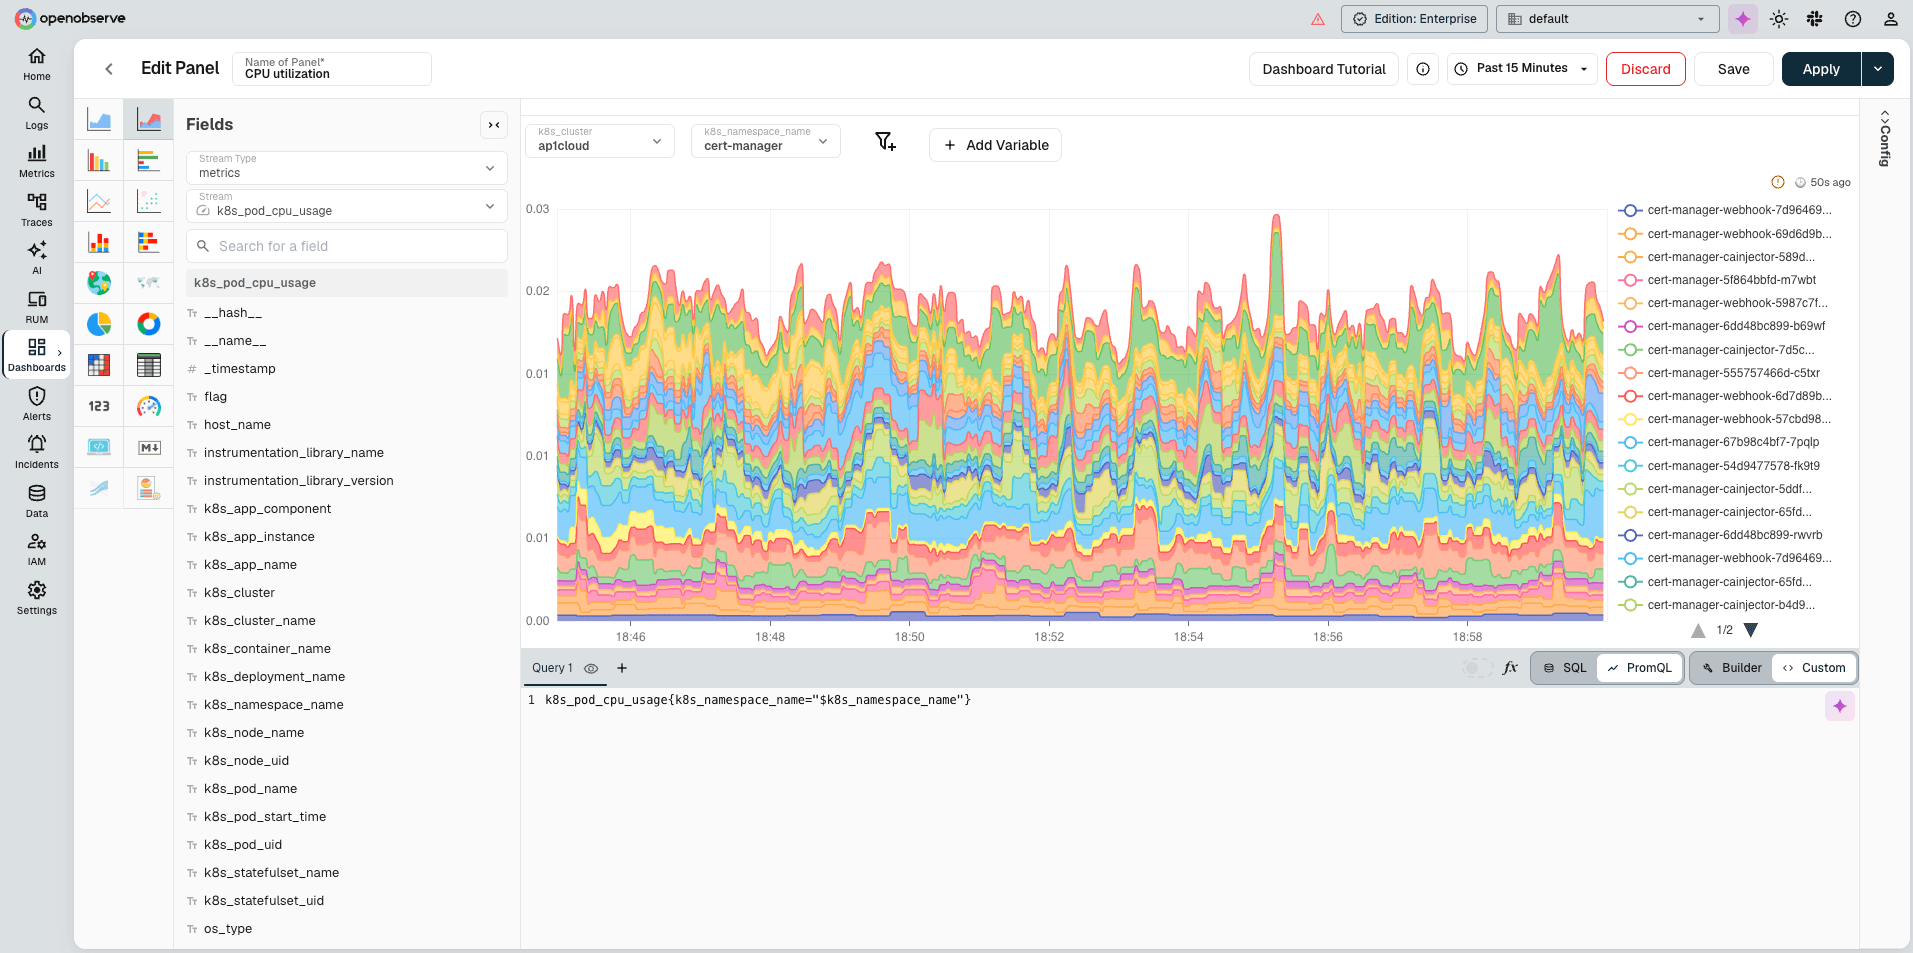
Monitor your infrastructure and applications with Prometheus-native metrics and efficient time-series storage.
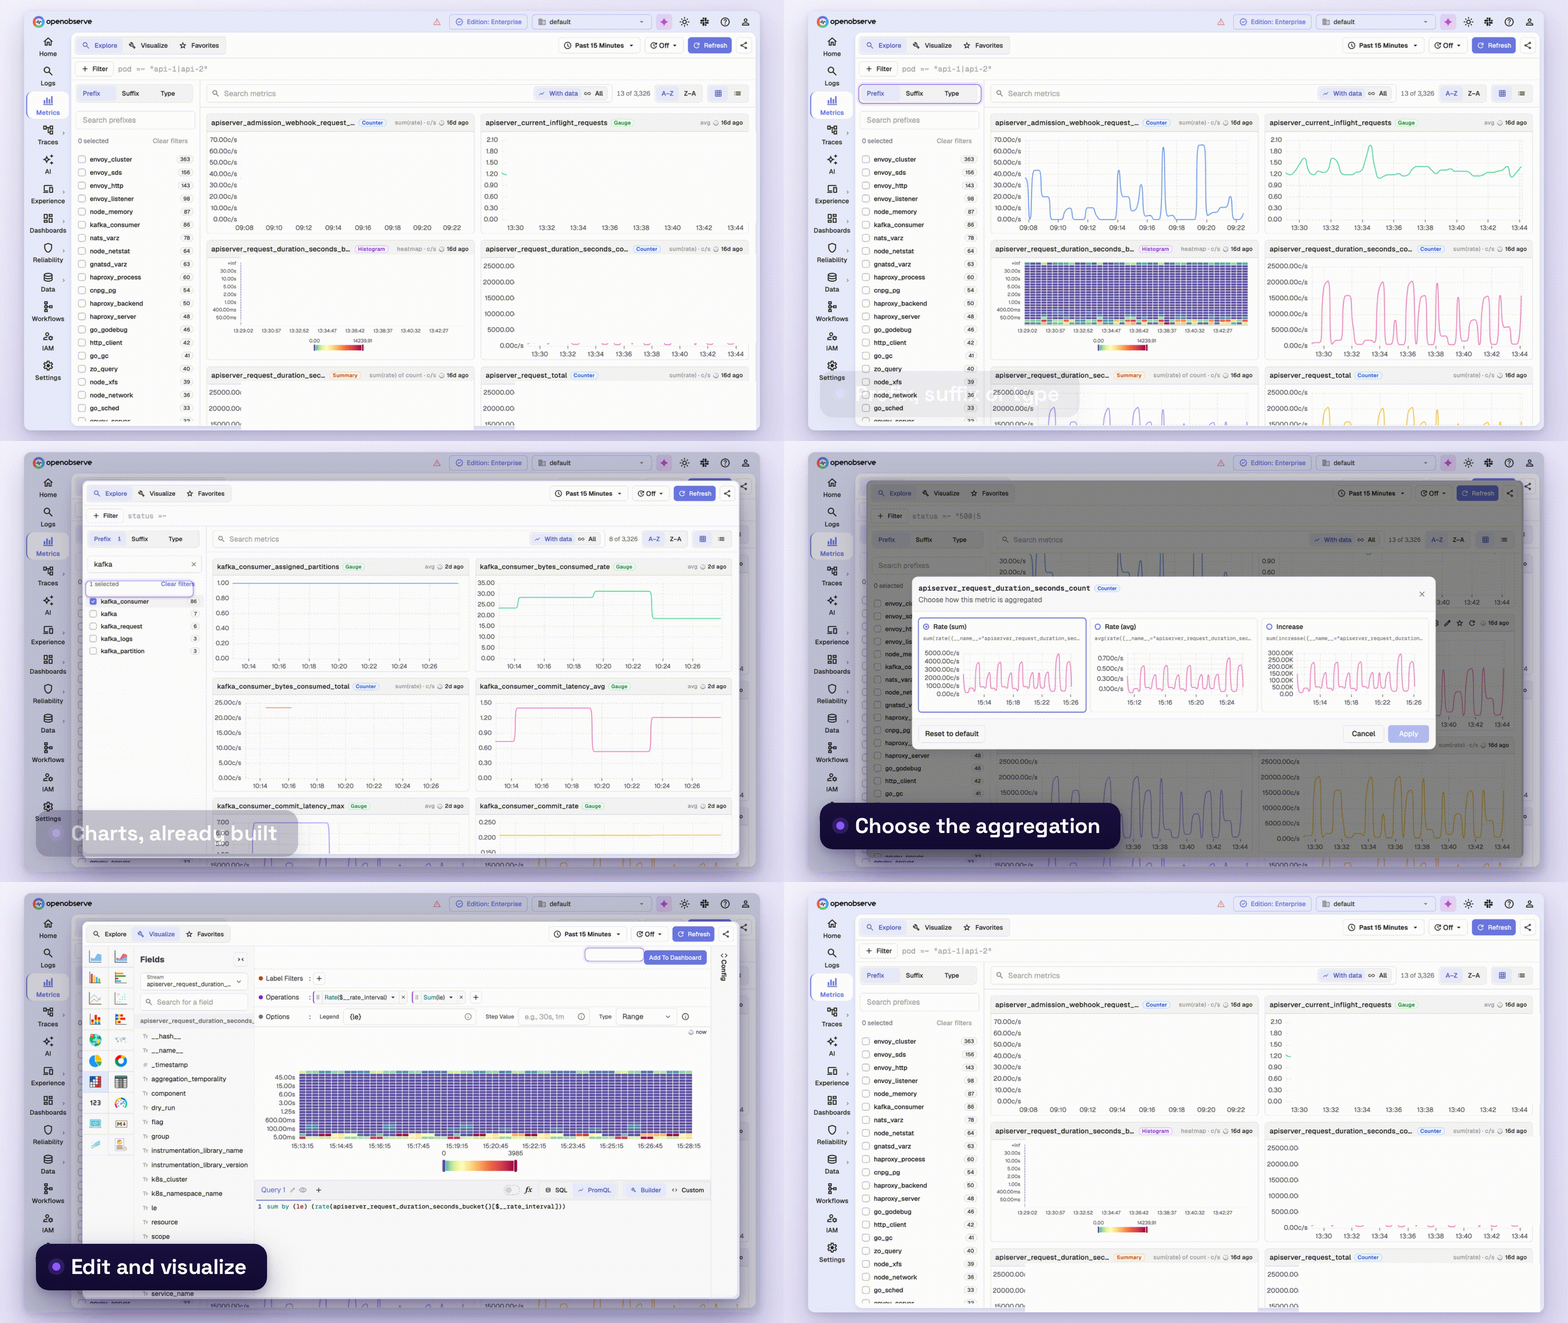
Pivot from a metric spike straight into the logs and traces behind it, no second tool.
Query the same metrics either way, no forced migration.
Standardized collection with zero vendor lock-in
Collect and query time-series data without hitting a cardinality wall.
Ingest metrics from any source with minimal overhead via Prometheus remote-write, OpenTelemetry, or direct API integration.
Visualize and analyze metrics instantly without cardinality limits, enabling immediate detection of performance trends.
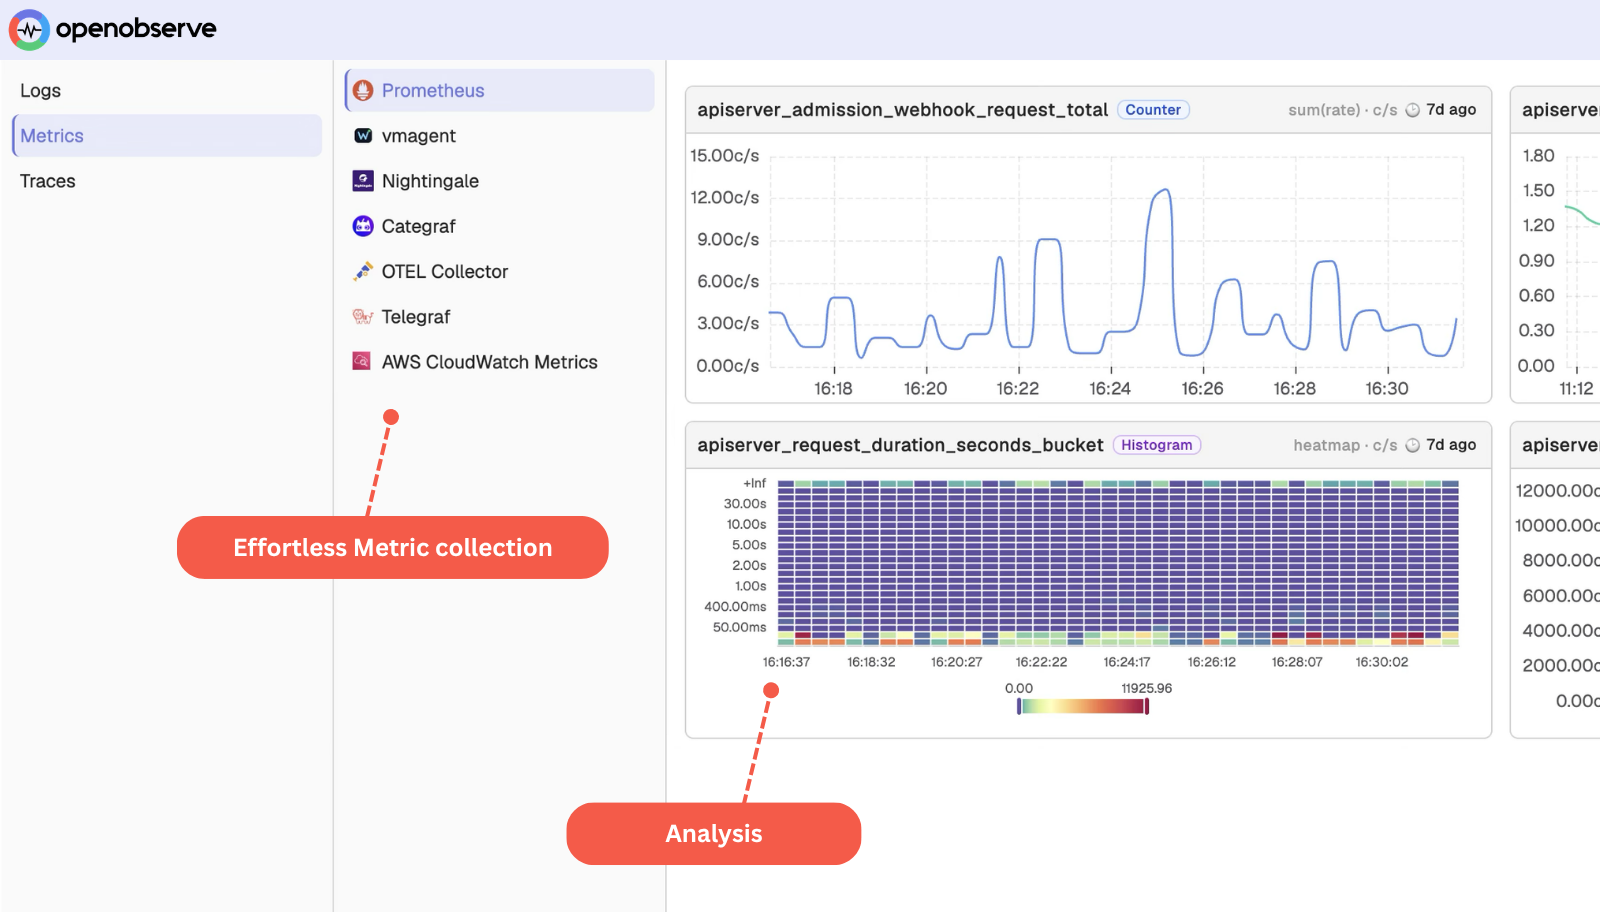
Connect with Prometheus endpoints using full remote write protocol support and your existing configurations.
Use familiar PromQL syntax or switch to SQL, your team’s expertise remains valuable without new learning curves.
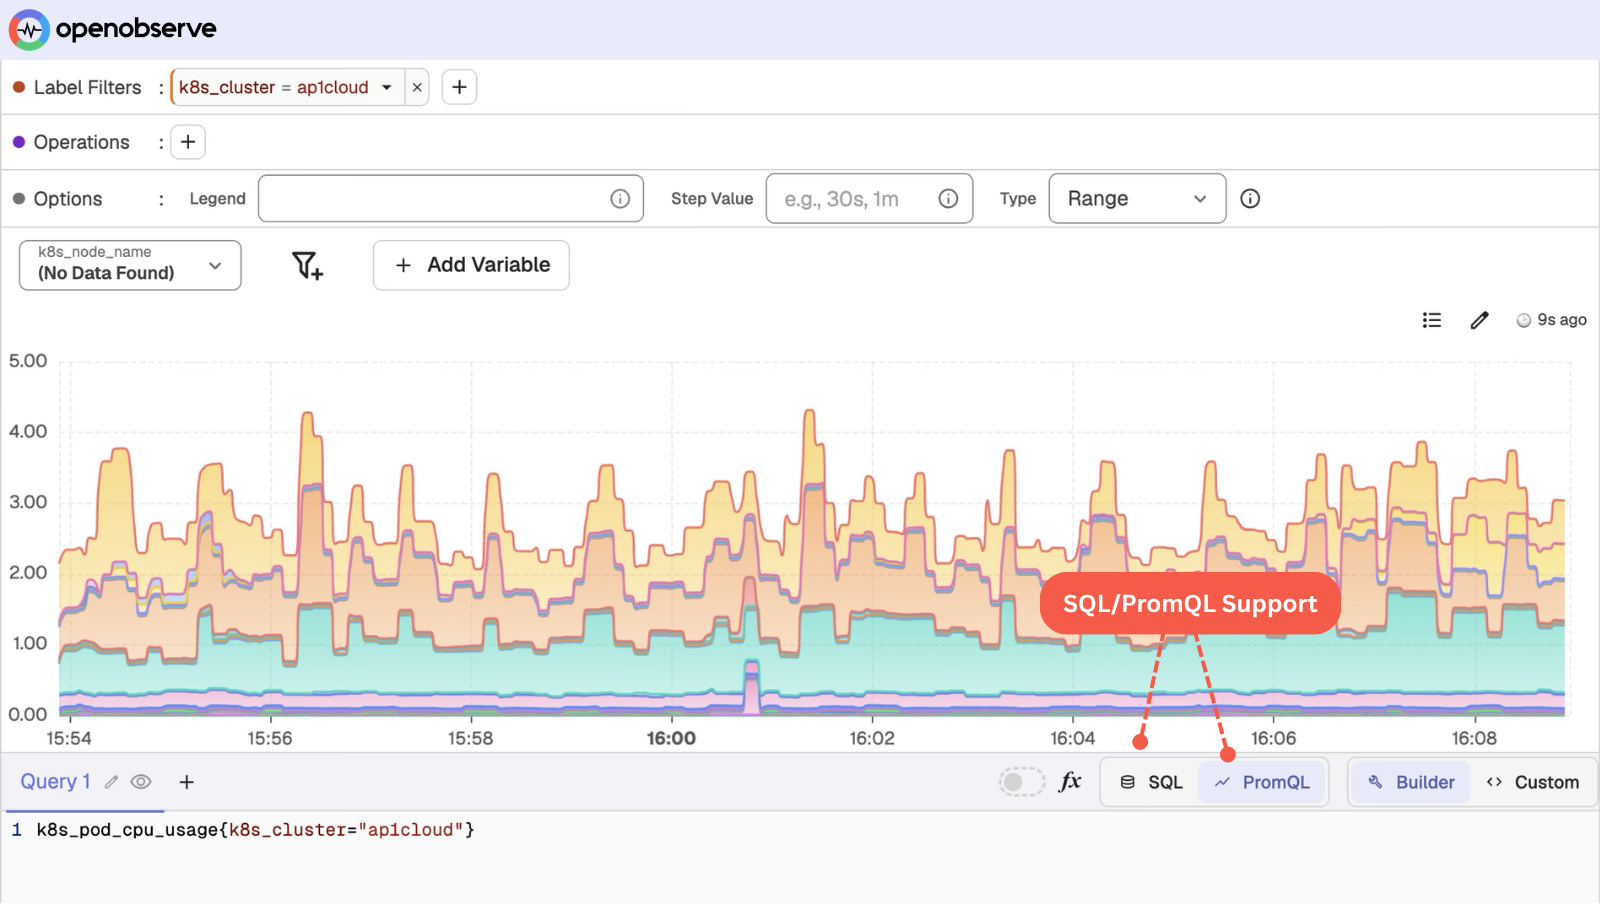
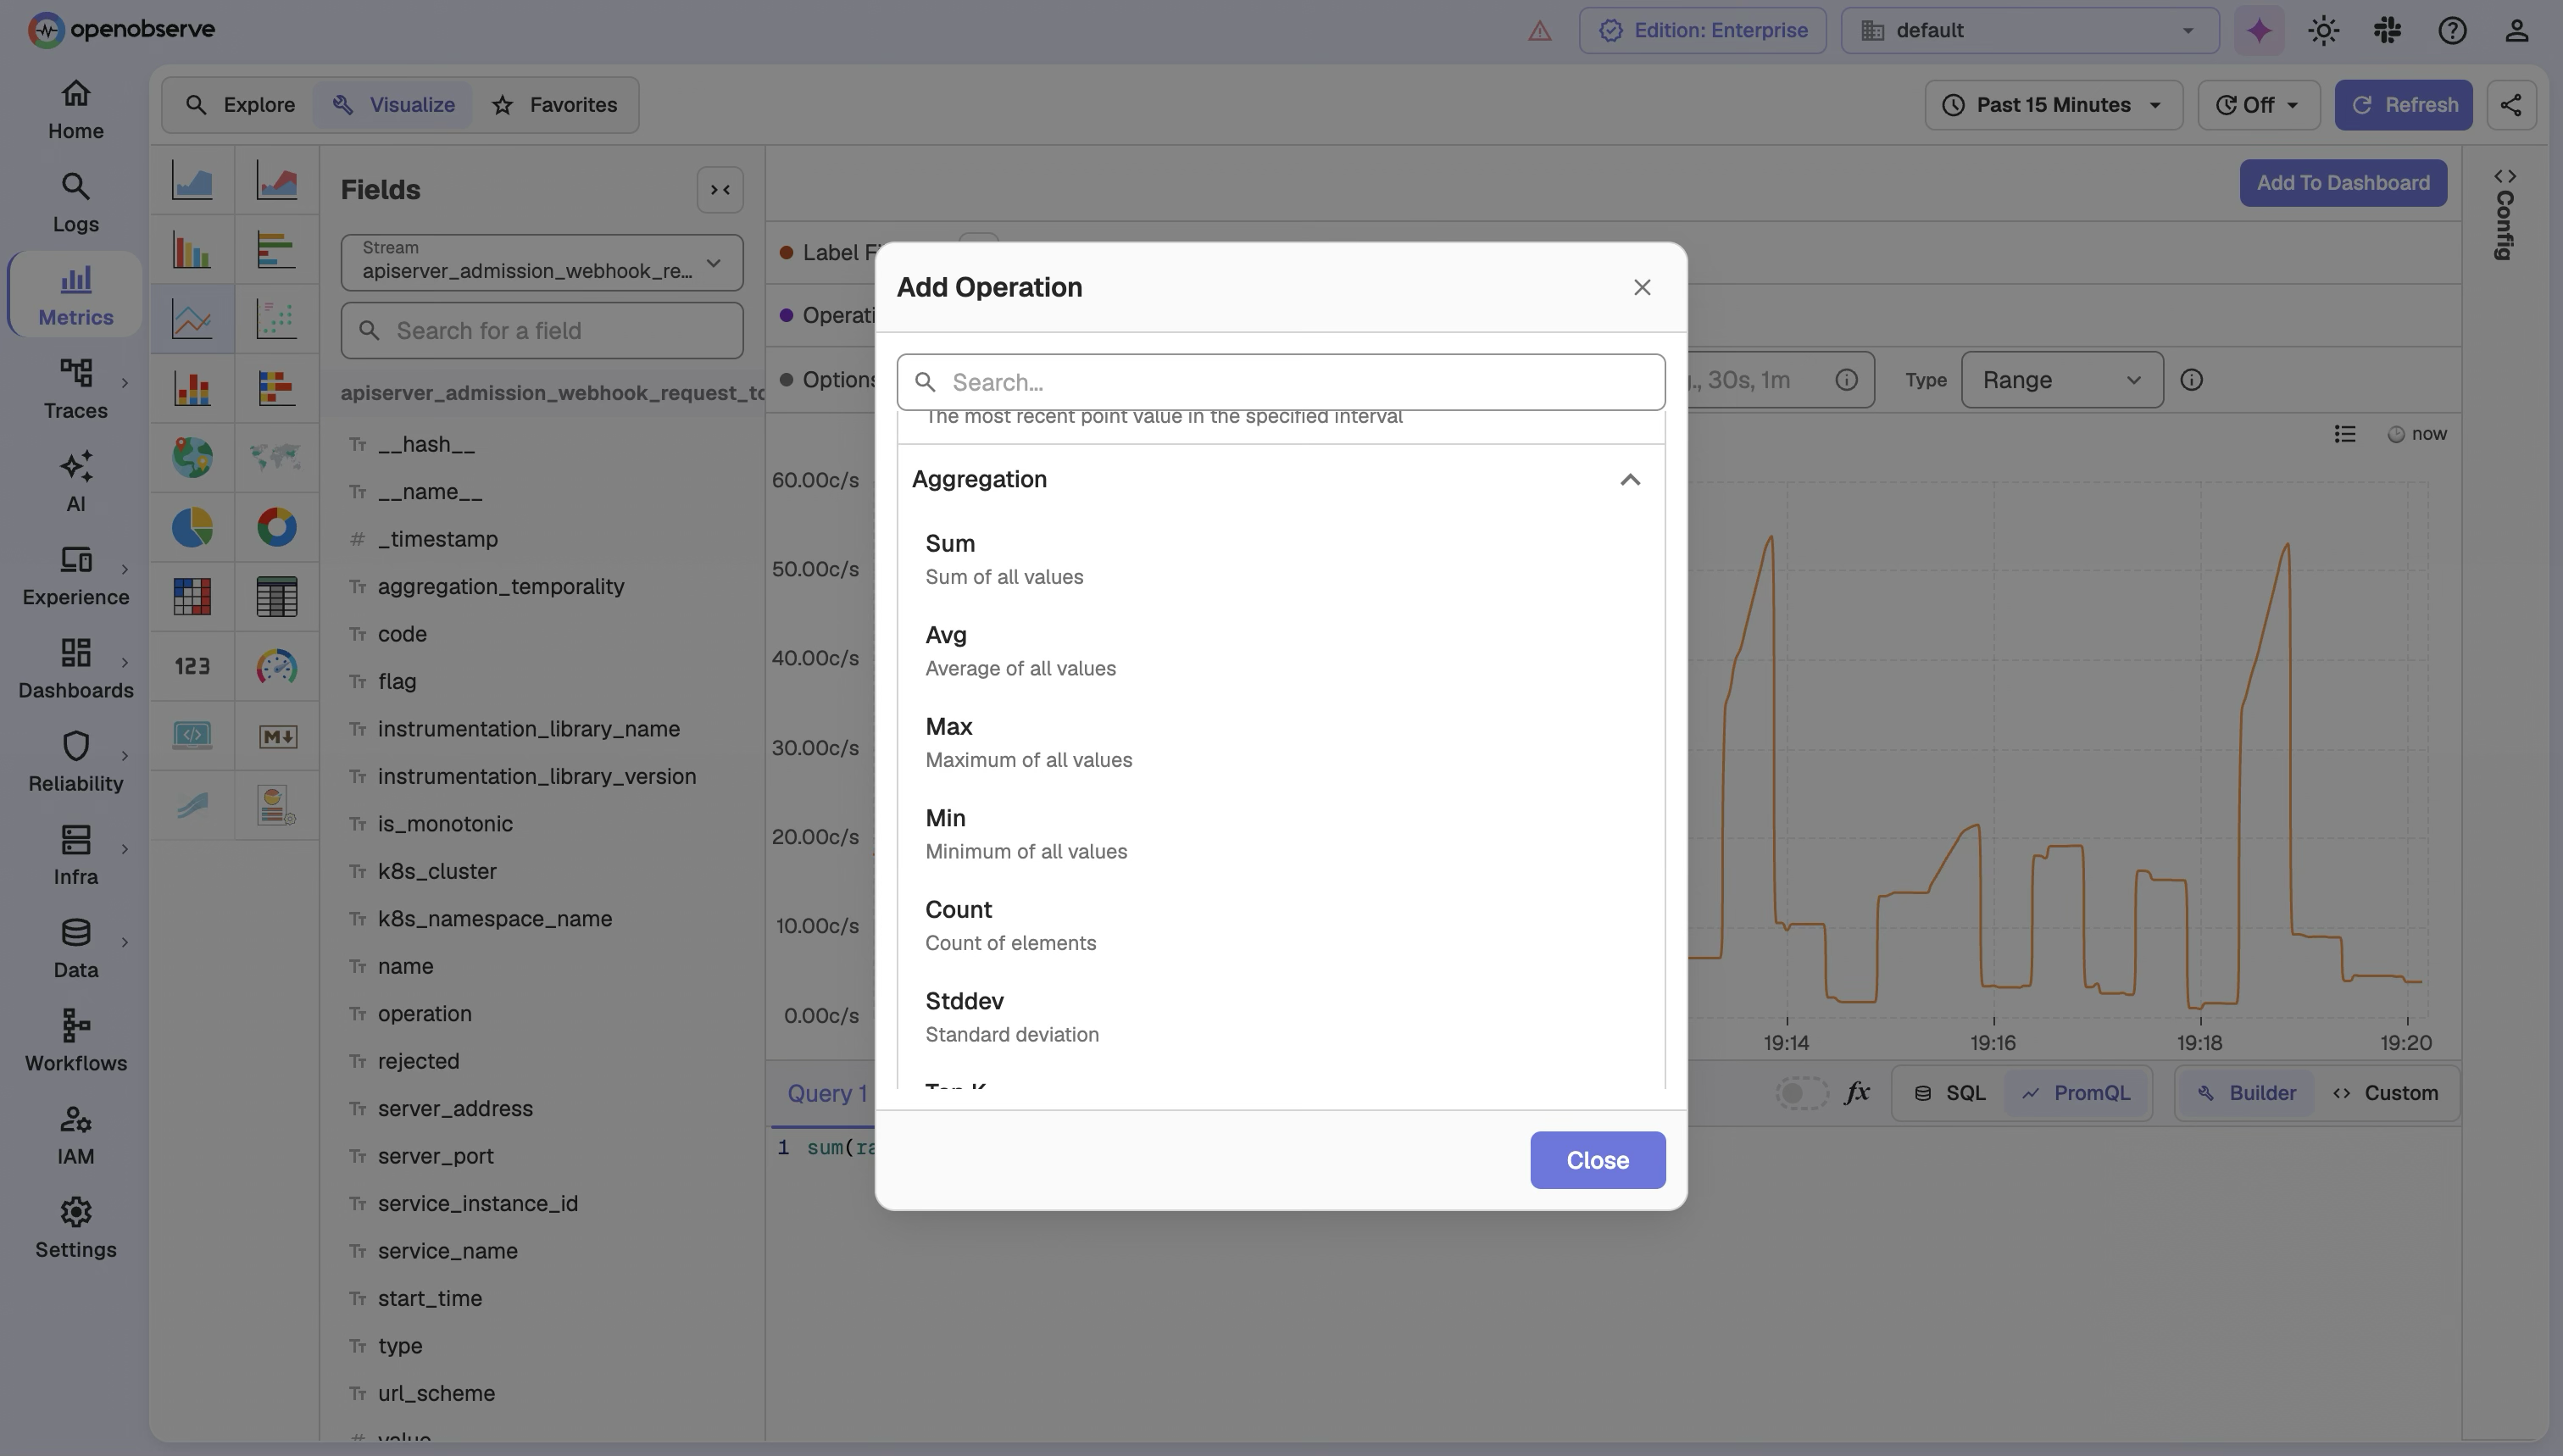
Process time-series data with powerful calculations including rates, moving averages, and percentile analysis using either PromQL or SQL.
Optimize query performance for historical data through automatic downsampling of longer period requests.
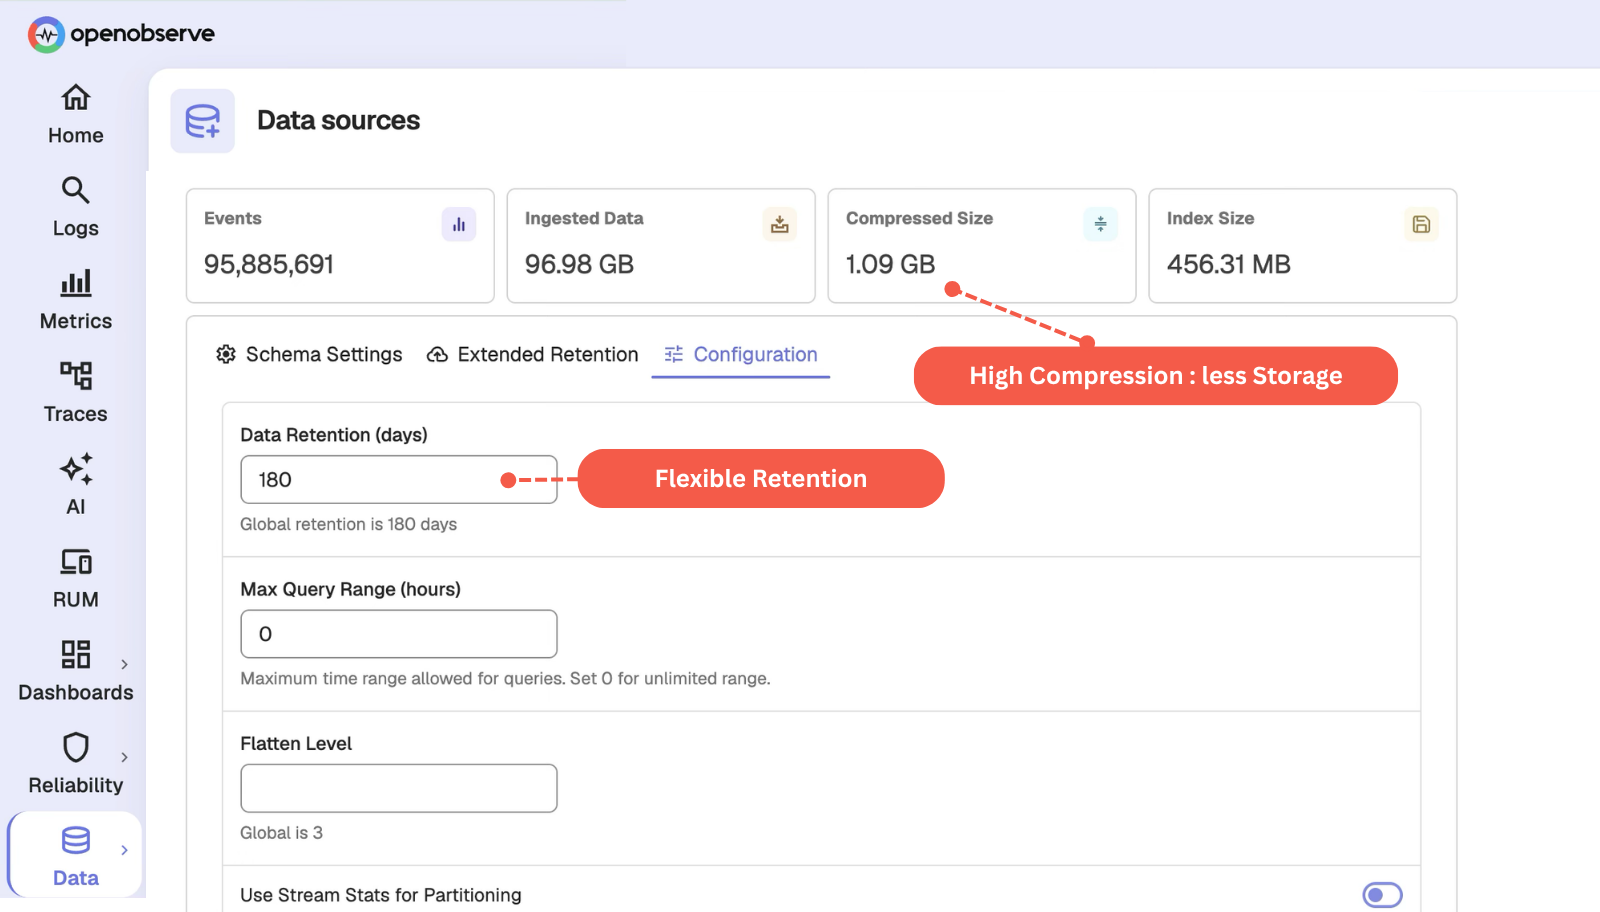
Cut storage costs while maintaining query speed through columnar format designed for time-series data.
Define custom retention periods for each data source, ensuring you keep only what you need for as long as you need it.
Same telemetry, same workloads, one platform. Every number is OpenObserve against a named vendor - not an industry average.
vs. Datadog
8×
more cost-effective
8x cost reduction means you can unify your observability into a single platform.
Read case studyvs. Elastic
140×
storage efficiency
140x storage means longer retention doesn't necessarily mean expensive bills.
Read case studyvs. Grafana stack
5–15×
faster performance
5x to 15x faster queries mean dashboards load in milliseconds, not minutes.
Read case studySee how much you would save switching today.
Correlate between the environments and signals across various sources with OpenObserve built-in correlation engine.
“OpenObserve helped us migrate from Datadog in under an hour... reducing observability costs by 4x.”
4x
Lower observability cost
< 1 hour
Migrated off Datadog
Flat pricing
No month-end surprises
to help you get the most out of Metrics.
Try OpenObserve today for more efficient and performant observability.

AI Observability by OpenObserve
OpenTelemetry-native observability for agents and LLMs.