Integration with Jenkins
This guide explains how to monitor Jenkins pipelines using the OpenTelemetry plugin and stream telemetry data to OpenObserve for visualization.
Overview
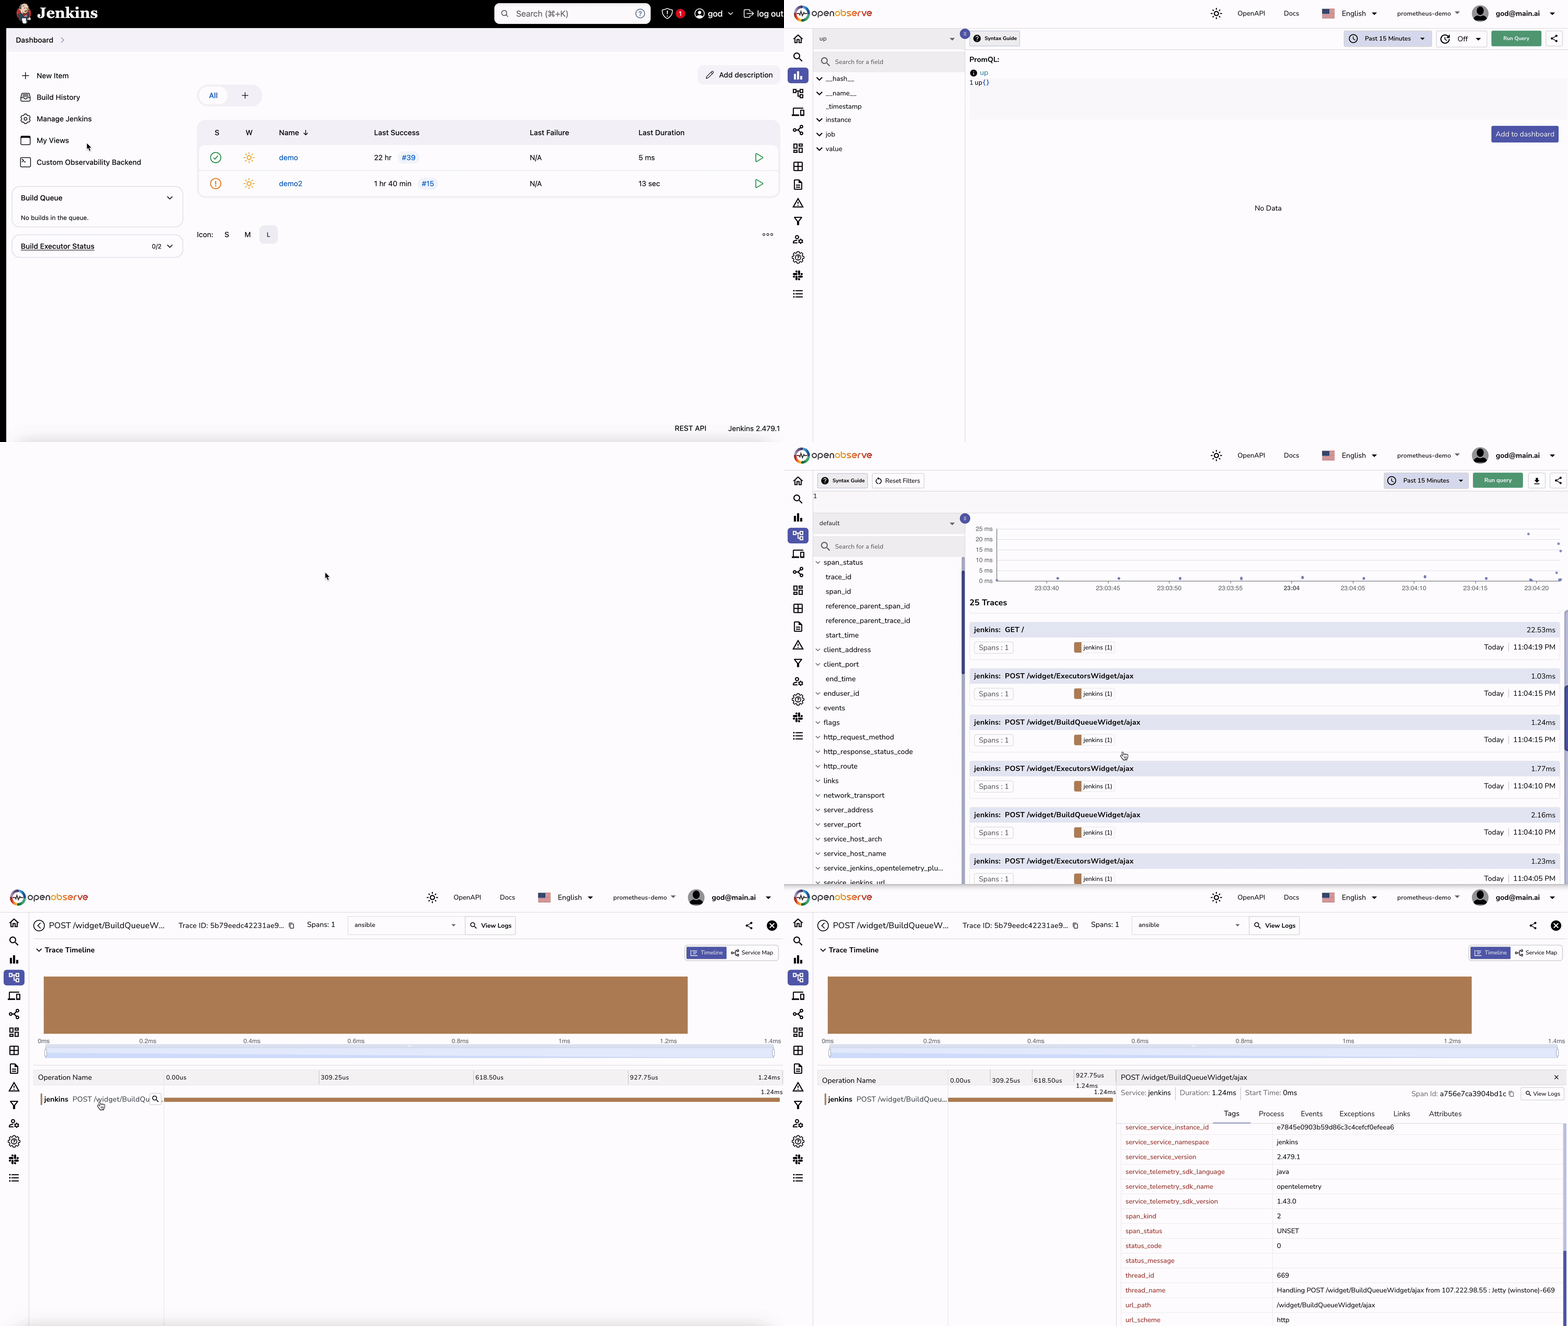
The Jenkins integration captures traces, logs, and metrics using the OpenTelemetry plugin for Jenkins. Once connected to OpenObserve, this setup provides full visibility into pipeline executions , including build stages, test results, and execution time.
Steps to Integrate
Prerequisites
- Jenkins installed on your system
- OpenObserve account (Cloud or Self-Hosted)
Step 1: Install the OpenTelemetry Plugin
- In Jenkins, go to Manage Jenkins → Manage Plugins
- Under Available Plugins, search for OpenTelemetry
- Select and install the plugin, Restart Jenkins if prompted

Step 2: Configure OpenTelemetry with OpenObserve
- In Manage Jenkins → Configure System, scroll to the OpenTelemetry section
- Under OTLP Endpoint, enter:
- Next, Select Header Authentication
- In Header Value, enter:

-
Add Configuration Properties (Advanced Settings) : Under Advanced → Configuration Properties, add:
otel.exporter.otlp.protocol=http/protobuf
otel.exporter.otlp.headers=organization=prometheus-demo,stream-name=default
otel.logs.exporter=otlp
These settings configure the OpenTelemetry plugin to export logs and traces directly to OpenObserve.
-
Set Observability Backend URLs
- Under Visualization Backend, select Custom Observability Backend
- Trace Visualization URL Template:
https://<O2_HOST>/web/traces - Metrics Visualization URL Template:
https://<O2_HOST>/web/metrics
These URLs allow Jenkins to link directly to OpenObserve dashboards and trace views.
Step 3: Create a Sample Jenkins Pipeline (Optional)
Note: If you have already existing pipeline, just rebuild to see the traces in Openobserve.
-
Go to New Item → Name:
Test Pipeline→ Select Pipeline
-
In the Pipeline script field, paste the following:
pipeline { agent any stages { stage('Prepare') { steps { echo 'Preparing environment...' sleep 1 } } stage('Build') { steps { echo 'Building the project...' sleep 2 } } stage('Test') { steps { echo 'Running tests...' script { int totalTests = 10 int failedTests = 2 echo "Total tests: ${totalTests}" echo "Failed tests: ${failedTests}" if (failedTests > 0) { currentBuild.result = 'UNSTABLE' } } } } stage('Deploy') { steps { echo 'Deploying to staging...' sleep 1 } } } post { success { echo 'Pipeline completed successfully!' } unstable { echo 'Pipeline completed with some test failures.' } failure { echo 'Pipeline failed.' } } } - Save and run the pipeline to generate test logs and traces
Step 4: View Pipeline Telemetry from Jenkins UI
- After pipeline execution, go to the Jenkins job panel -> Click the Observability link
- You will be redirected to OpenObserve with trace and metrics views for that specific job

Troubleshooting
No data in OpenObserve?
- Double-check the OTLP endpoint and ensure it uses the full OpenObserve URL
- Ensure the Header Authentication is enabled and token is prefixed with
Basic - Check that
otel.logs.exporterandotel.exporter.otlp.headersare correctly added in Advanced Configuration Properties
Observability links not working?
- Verify that Visualization Backend is set to Custom
- Confirm the URLs:
- Traces:
https://<O2_HOST>/web/traces - Metrics:
https://<O2_HOST>/web/metrics
- Traces:
No pipeline logs or metrics?
- Ensure your pipeline includes
echo,sleep, and other commands that produce activity - Run the pipeline at least once to generate telemetry
- Check Jenkins logs for any plugin-related errors