Log Management and Analytics
Transform your log data into actionable insights with real-time analysis and industry-leading storage efficiency.
Significantly Efficient
140x lower storage costs compared to Elasticsearch
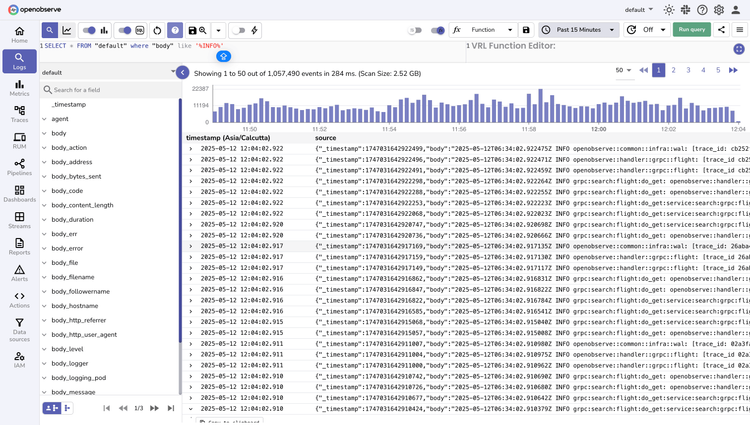
Highly Performant
Run lightning-fast queries across terabytes of data.
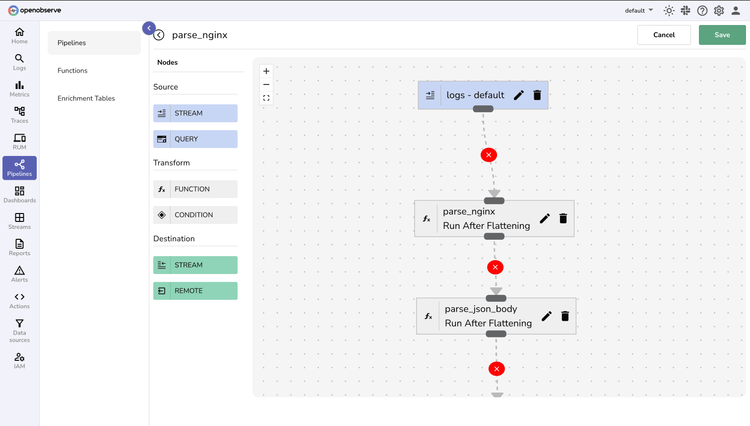
OTel-Native Logs
Standardized collection with zero vendor lock-in.
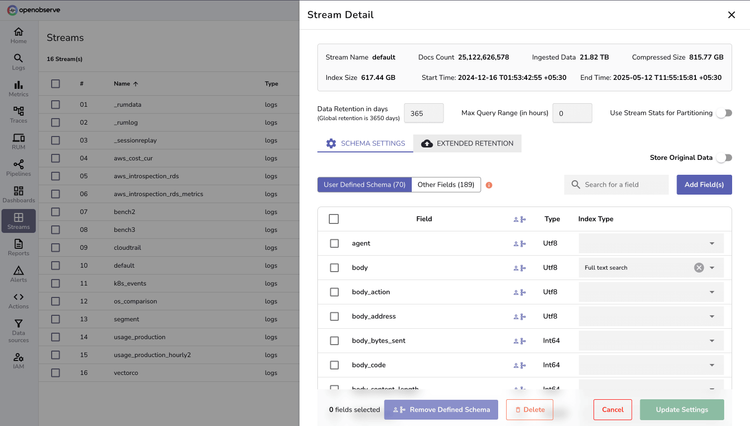
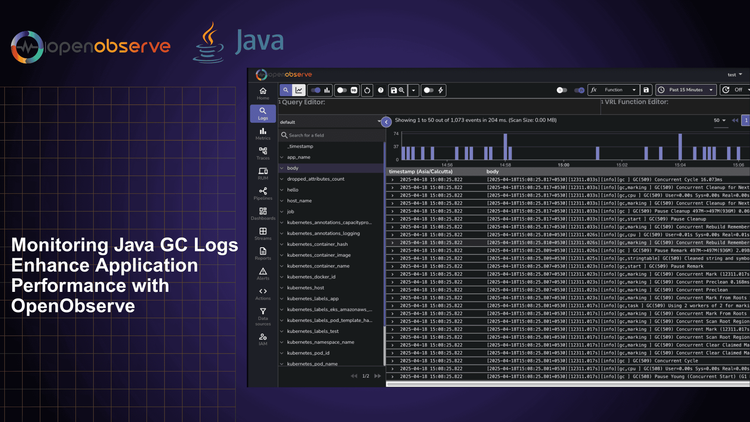
OpenObserve Logs
Scale from gigabytes to petabytes while dramatically reducing costs.
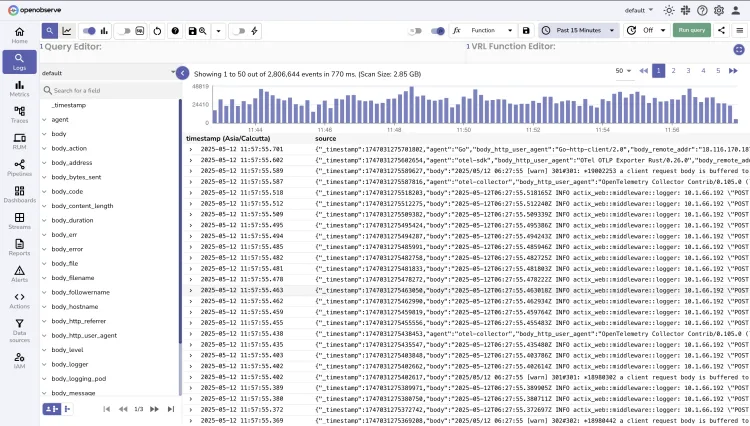
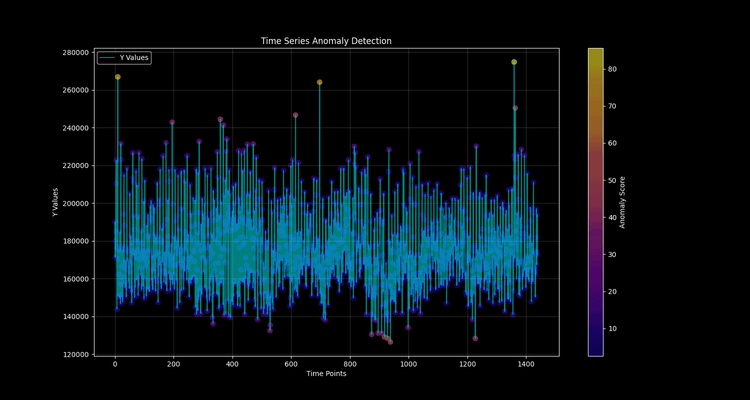
Real-Time Analytics
Instant Ingest-to-dashboard
Get answers the moment logs arrive, sub-second results even across petabytes of data.
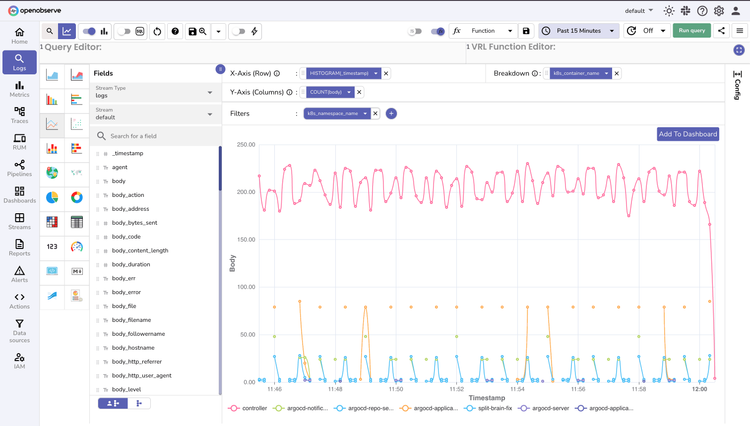
Log-centric Visualizations
Build customized logging dashboards in minutes with our drag-and-drop interface that updates live and shares with one click.
Log FAQs
Latest From Our Blogs


Ready to get started?
Try OpenObserve today for more efficient and performant observability.