Kubernetes Monitoring
Complete Kubernetes visibility, from cluster to pod, in minutes.
Why use OpenObserve for Kubernetes?
Full visibility into containers, workloads, and infrastructure performance across clusters.
Complete Kubernetes Observability
Full visibility into containers, workloads, and infrastructure performance across clusters.
Stand Up In Minutes
Monitor your Kubernetes environment instantly with the OpenObserve Collector. Automatically capture metrics, logs, and traces.
Reduce Kubernetes Costs
Identify Kubernetes inefficiencies and optimize resources for immediate cost savings.
OpenObserve’s Key Kubernetes Monitoring Capabilities
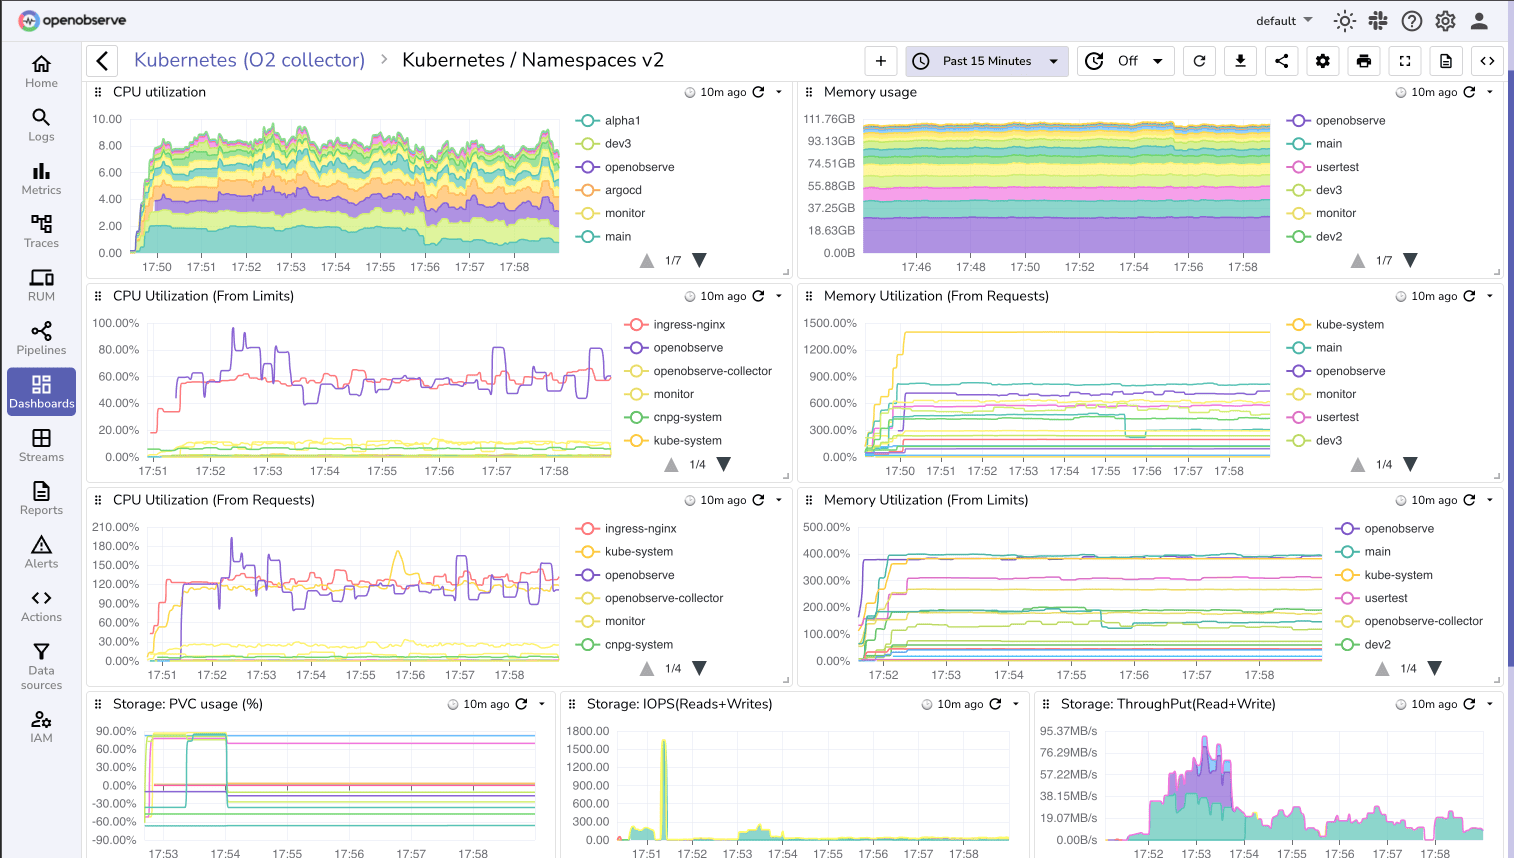
Unified Kubernetes Monitoring
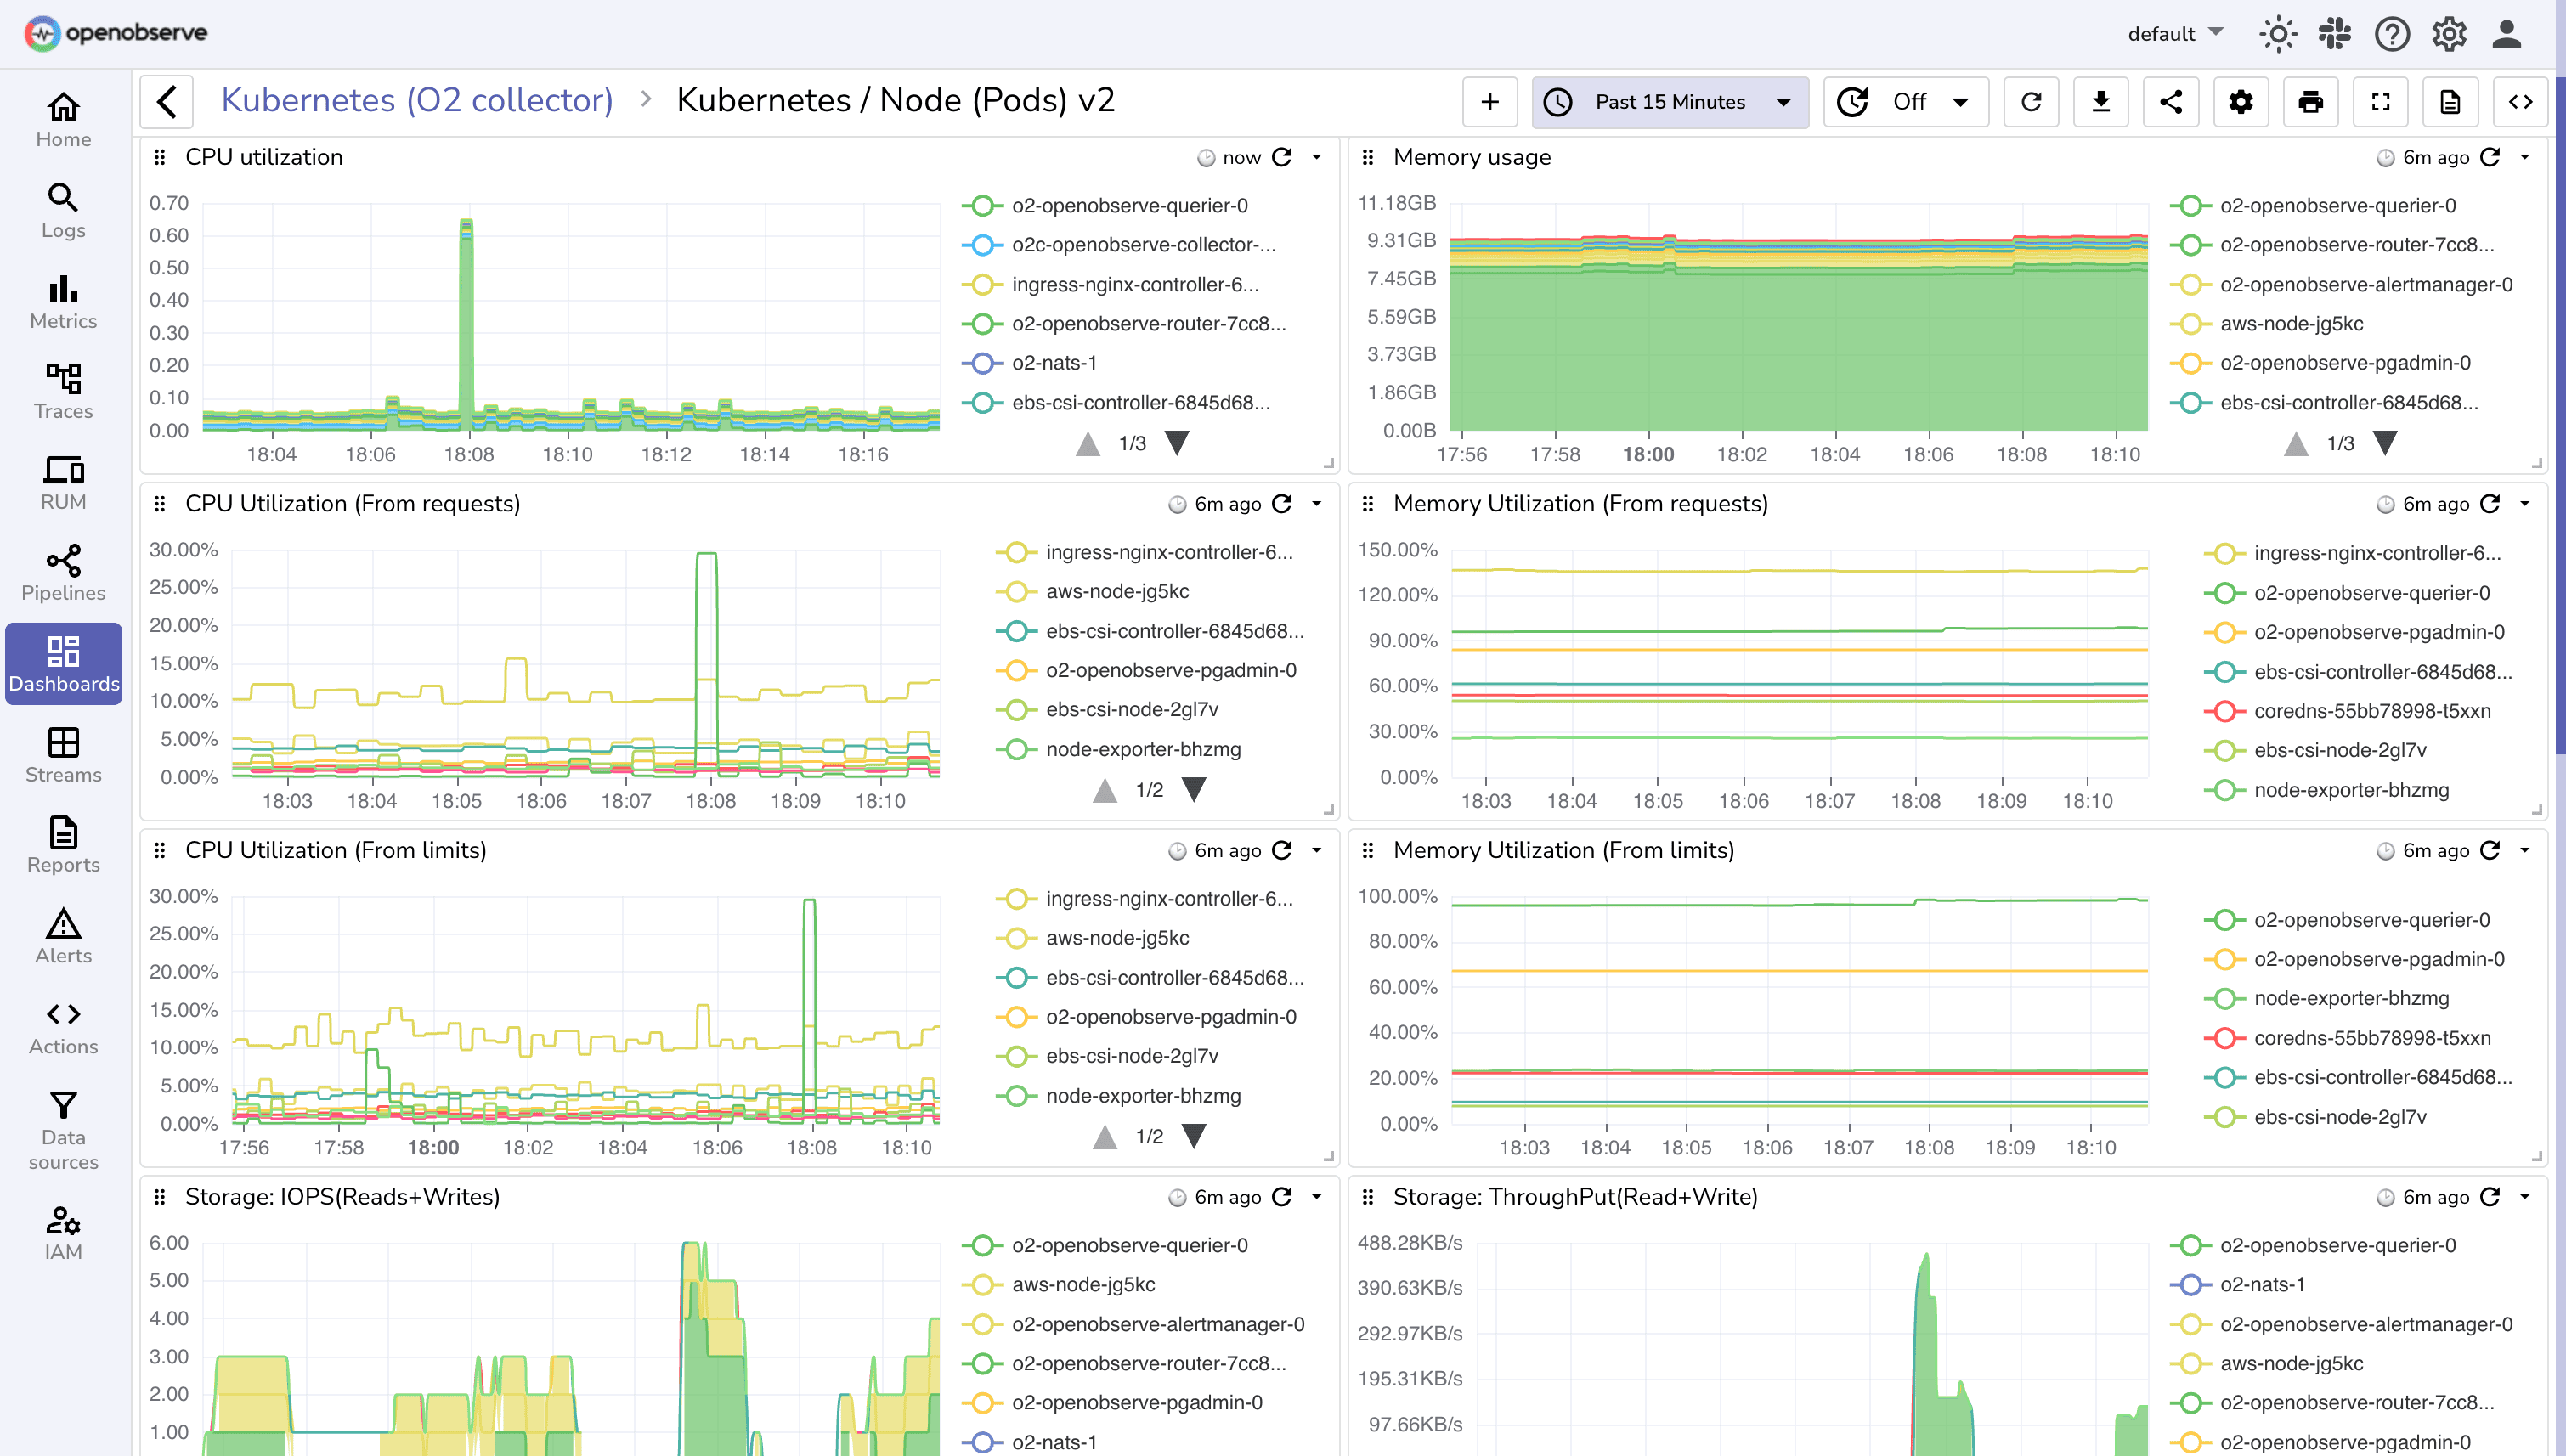
Pod-Level Observability
Monitor detailed CPU, memory, and network metrics at the pod level for precise performance optimization and capacity planning.
Real-Time Insights
View application performance and infrastructure health through intuitive dashboards that update in real-time.
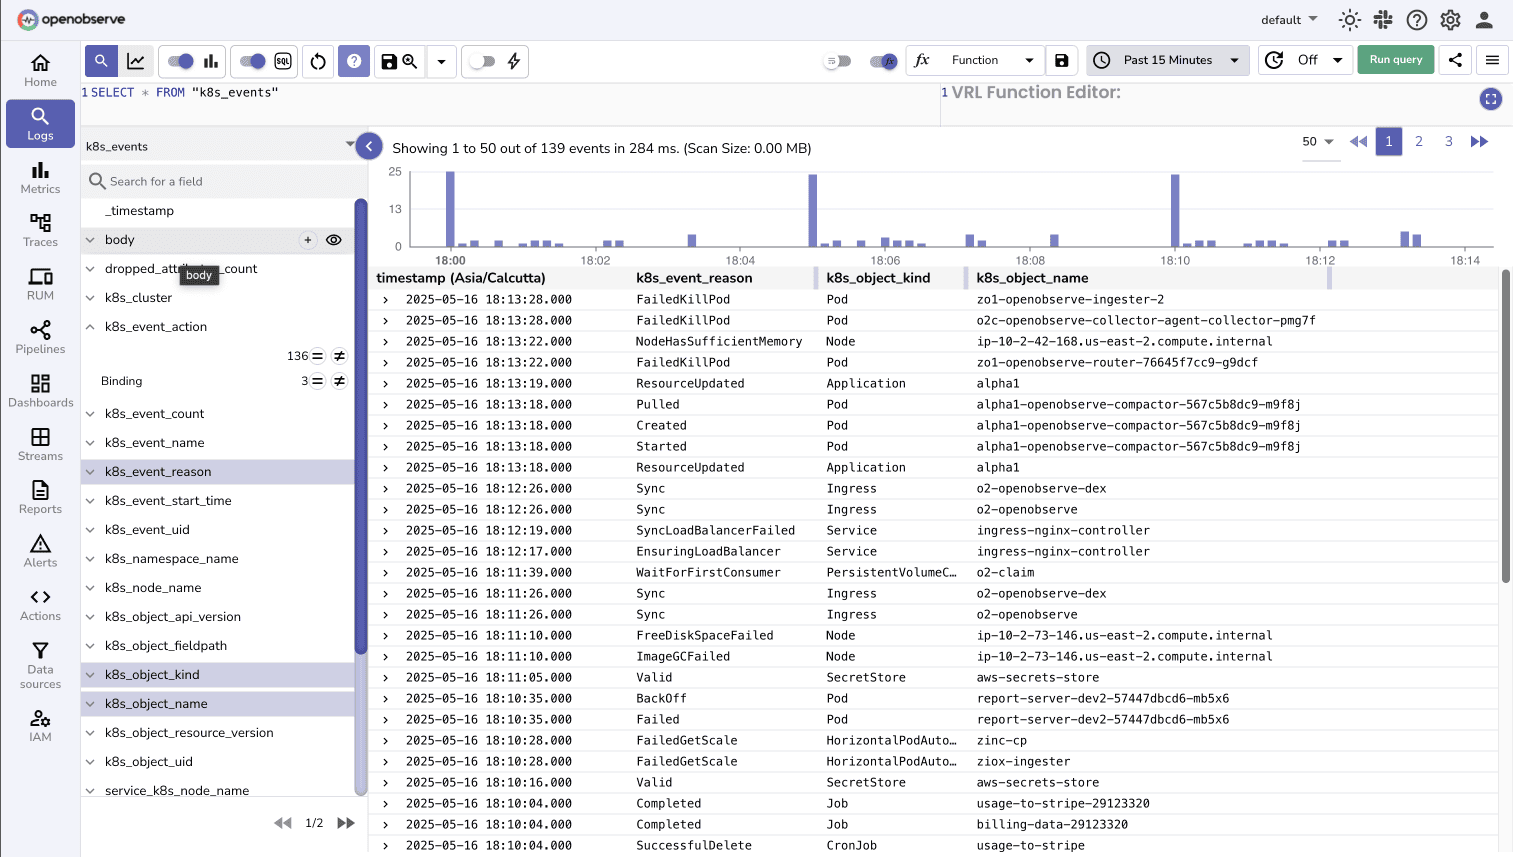
Multi cluster visibility
Monitor in cluster services
Manage and monitor in-cluster services. Capture events for all Kubernetes object types, including pods, deployments, HPA, and more.
Monitor multi-cluster services
Monitor multi-cluster services and correlate events across them
Resource Optimization
Resource Metrics
Track CPU, memory, and storage utilization across nodes, pods, and containers for efficient resource allocation.
Performance Analytics
Make data-driven decisions for scaling and resource optimization based on actual usage patterns
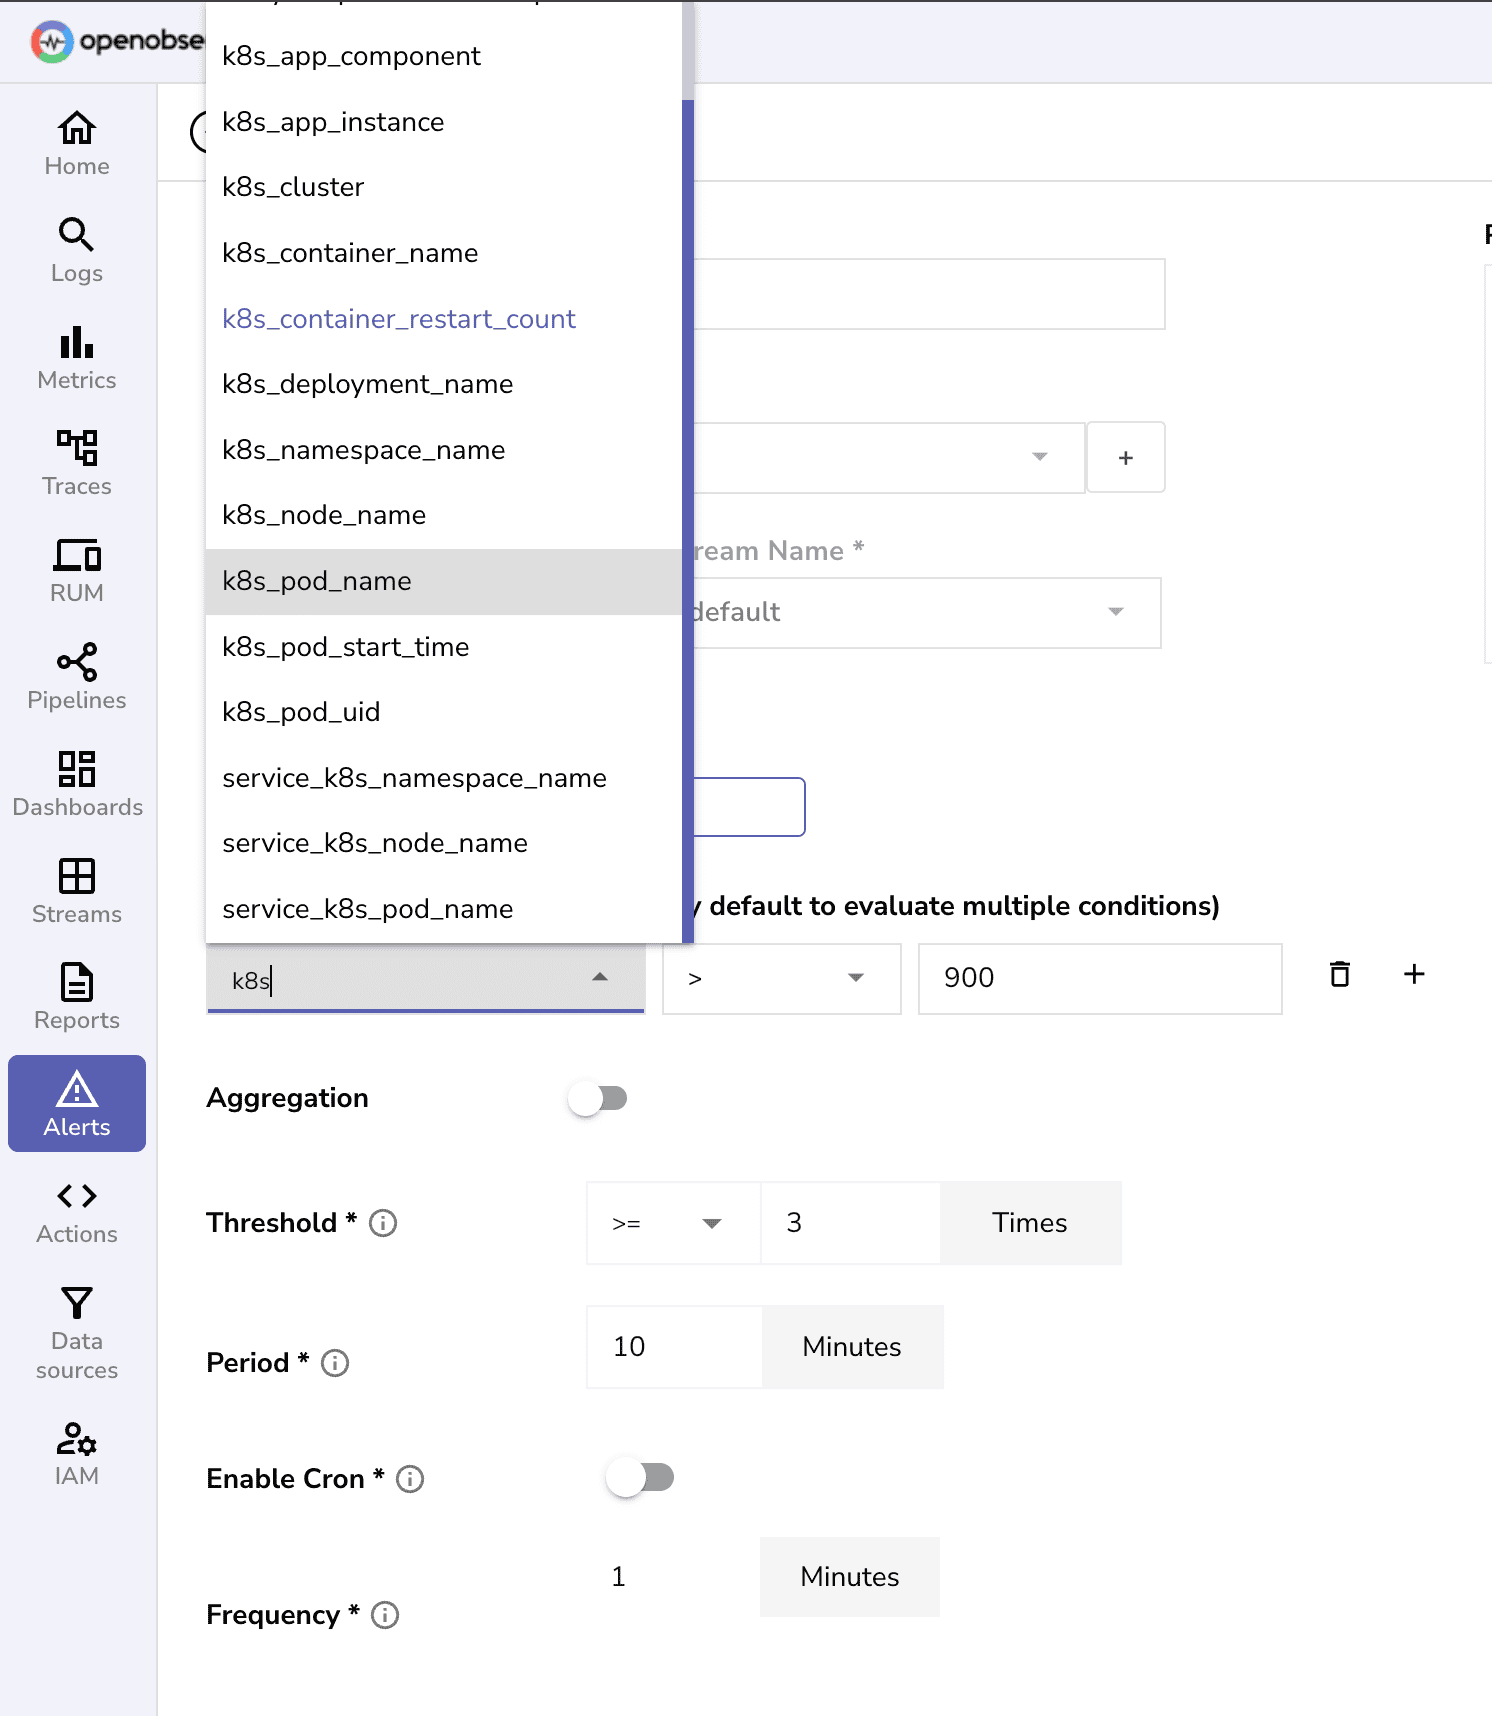
Uptime & Incident Management
Availability Monitoring
Track cluster and application availability with automated health checks and performance monitoring.
Incident Response
Respond to issues quickly with instant alerts and comprehensive diagnostic capabilities.
Kubernetes Monitoring FAQs
Ready to get started?
Try OpenObserve today for more efficient and performant observability.