Log Management and Analytics
Transform your log data into actionable insights with real-time analysis and industry-leading storage efficiency.

Significantly Efficient
140x lower storage costs compared to Elasticsearch
Highly Performant
Run lightning-fast queries across terabytes of data.
OTel-Native Logs
Standardized collection with zero vendor lock-in.
OpenObserve Logs
Scale from gigabytes to petabytes while dramatically reducing costs.
Log Processing
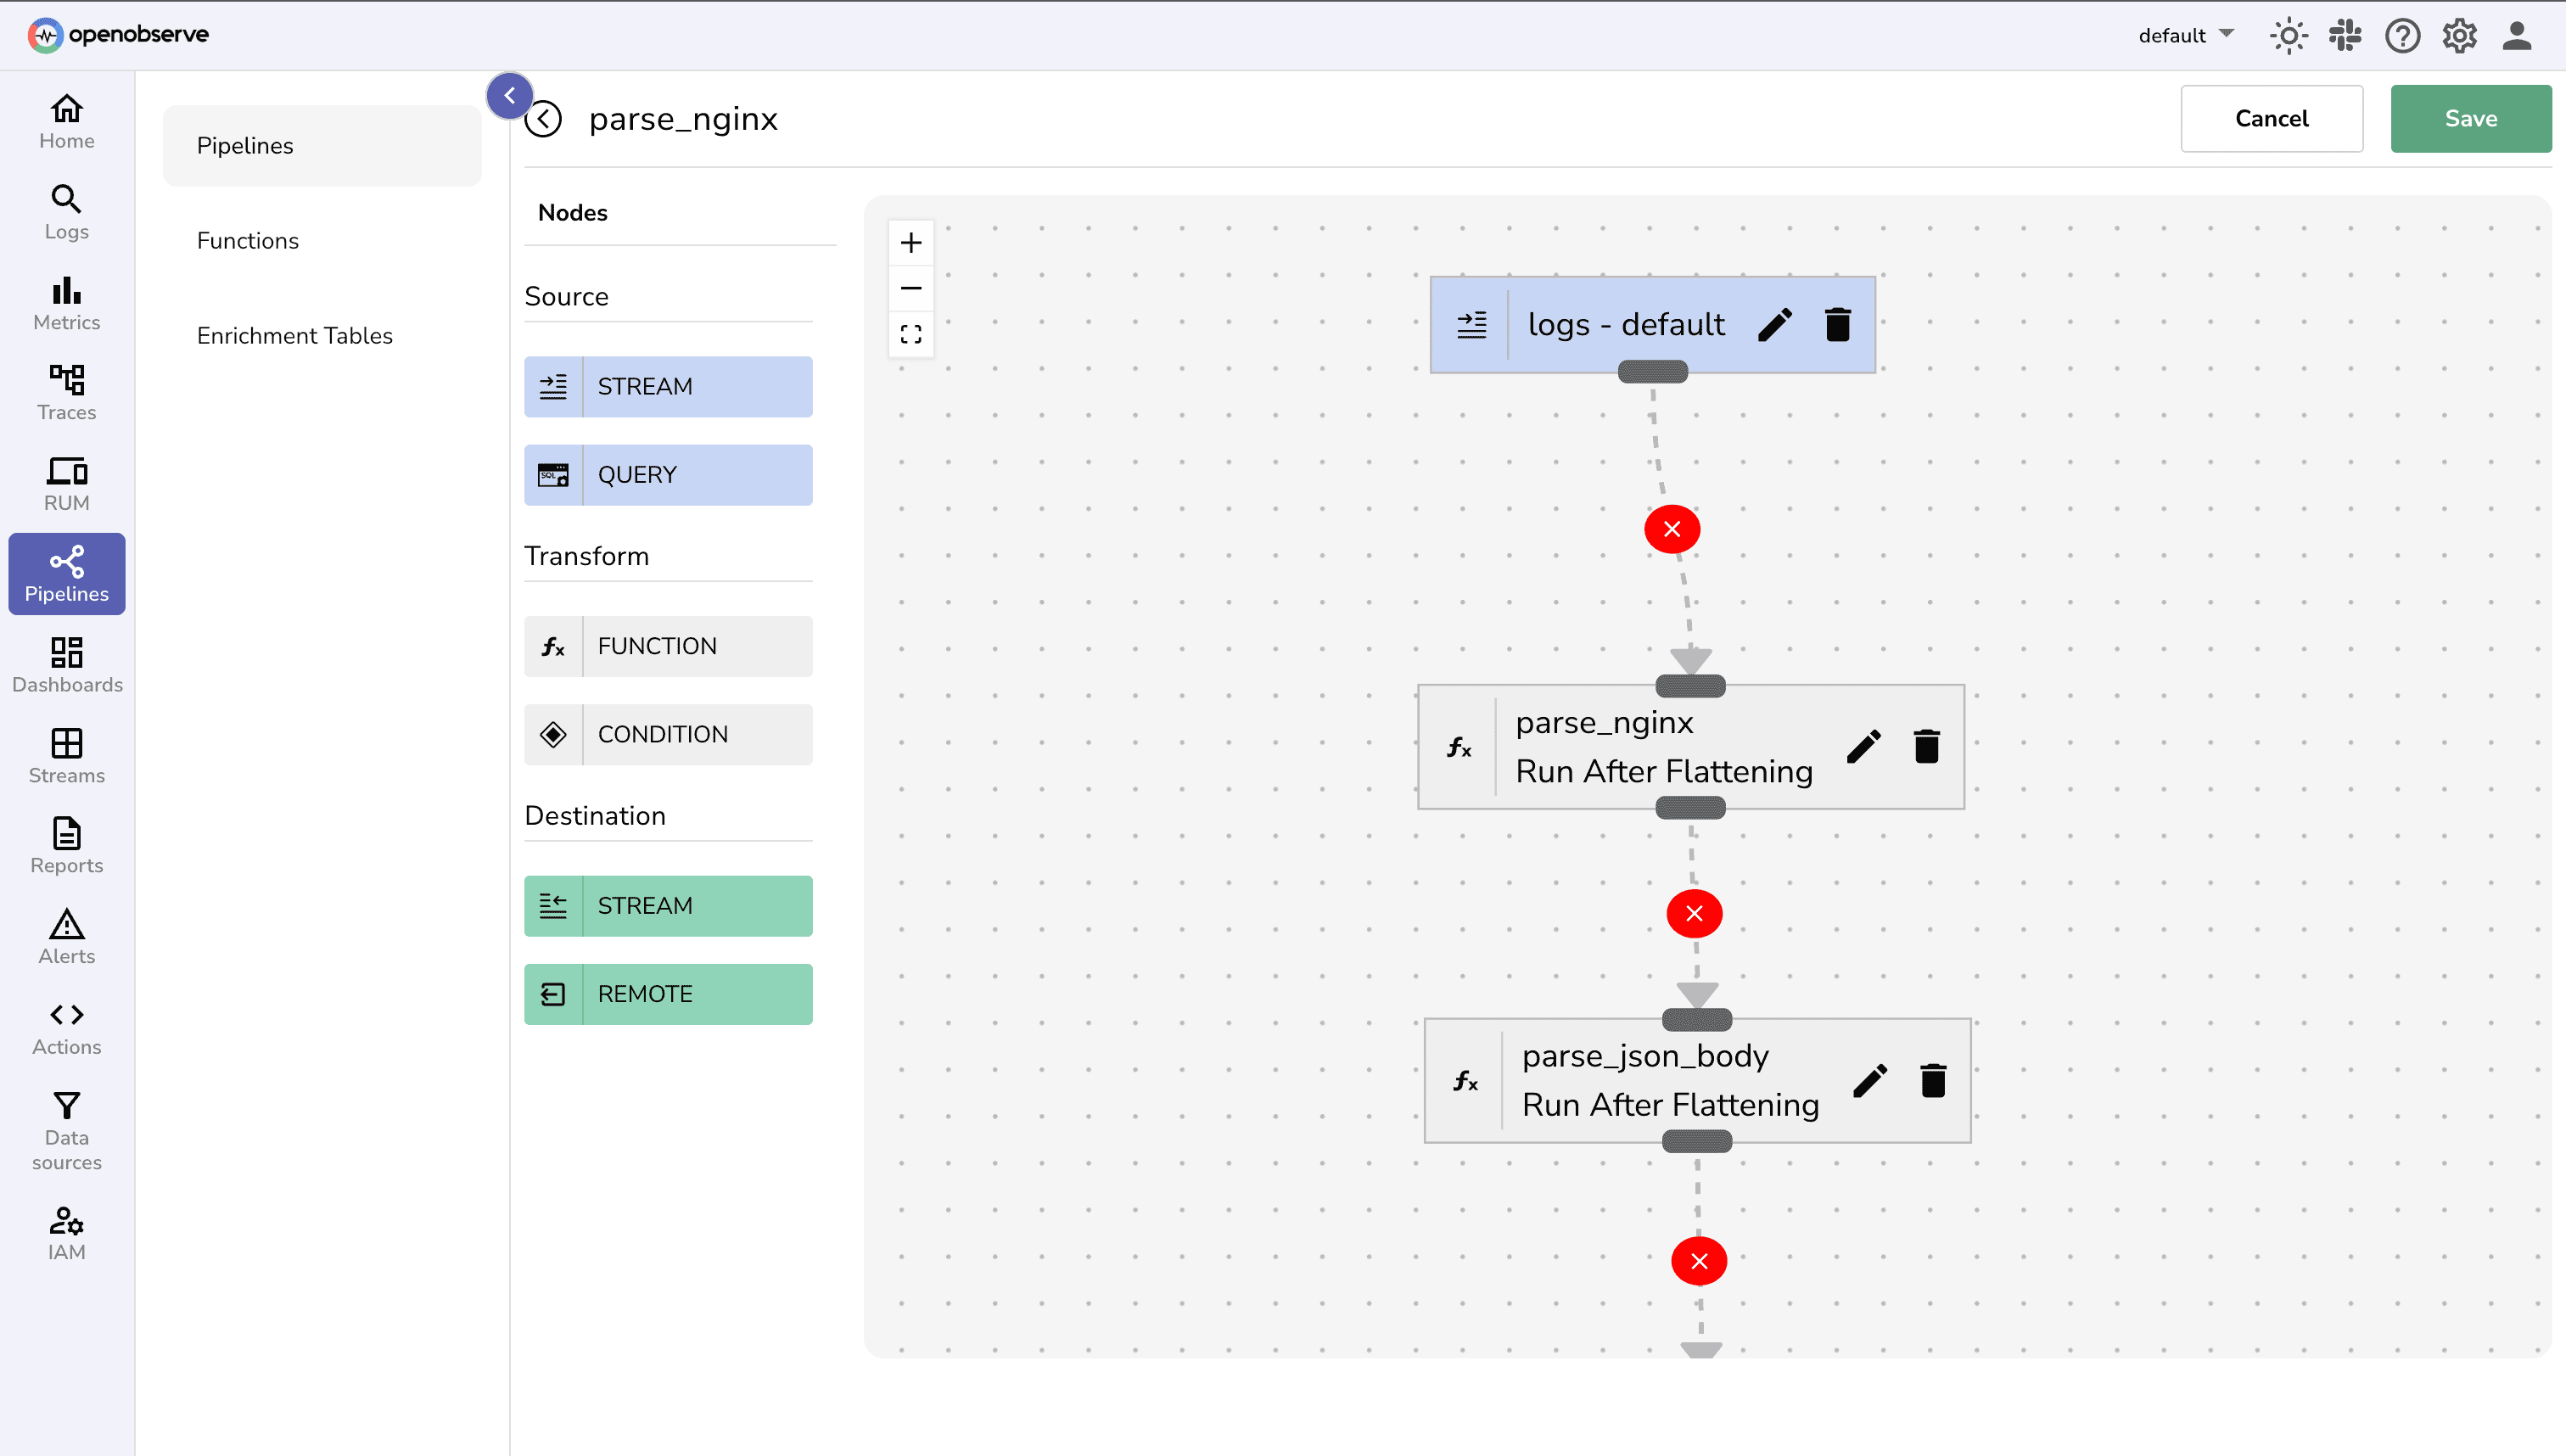
Automated Parsing
Flexible Transformation Pipeline
Enrich, filter, and reshape logs during ingestion with Vector Remap Language—maintaining peak performance while handling any log format.
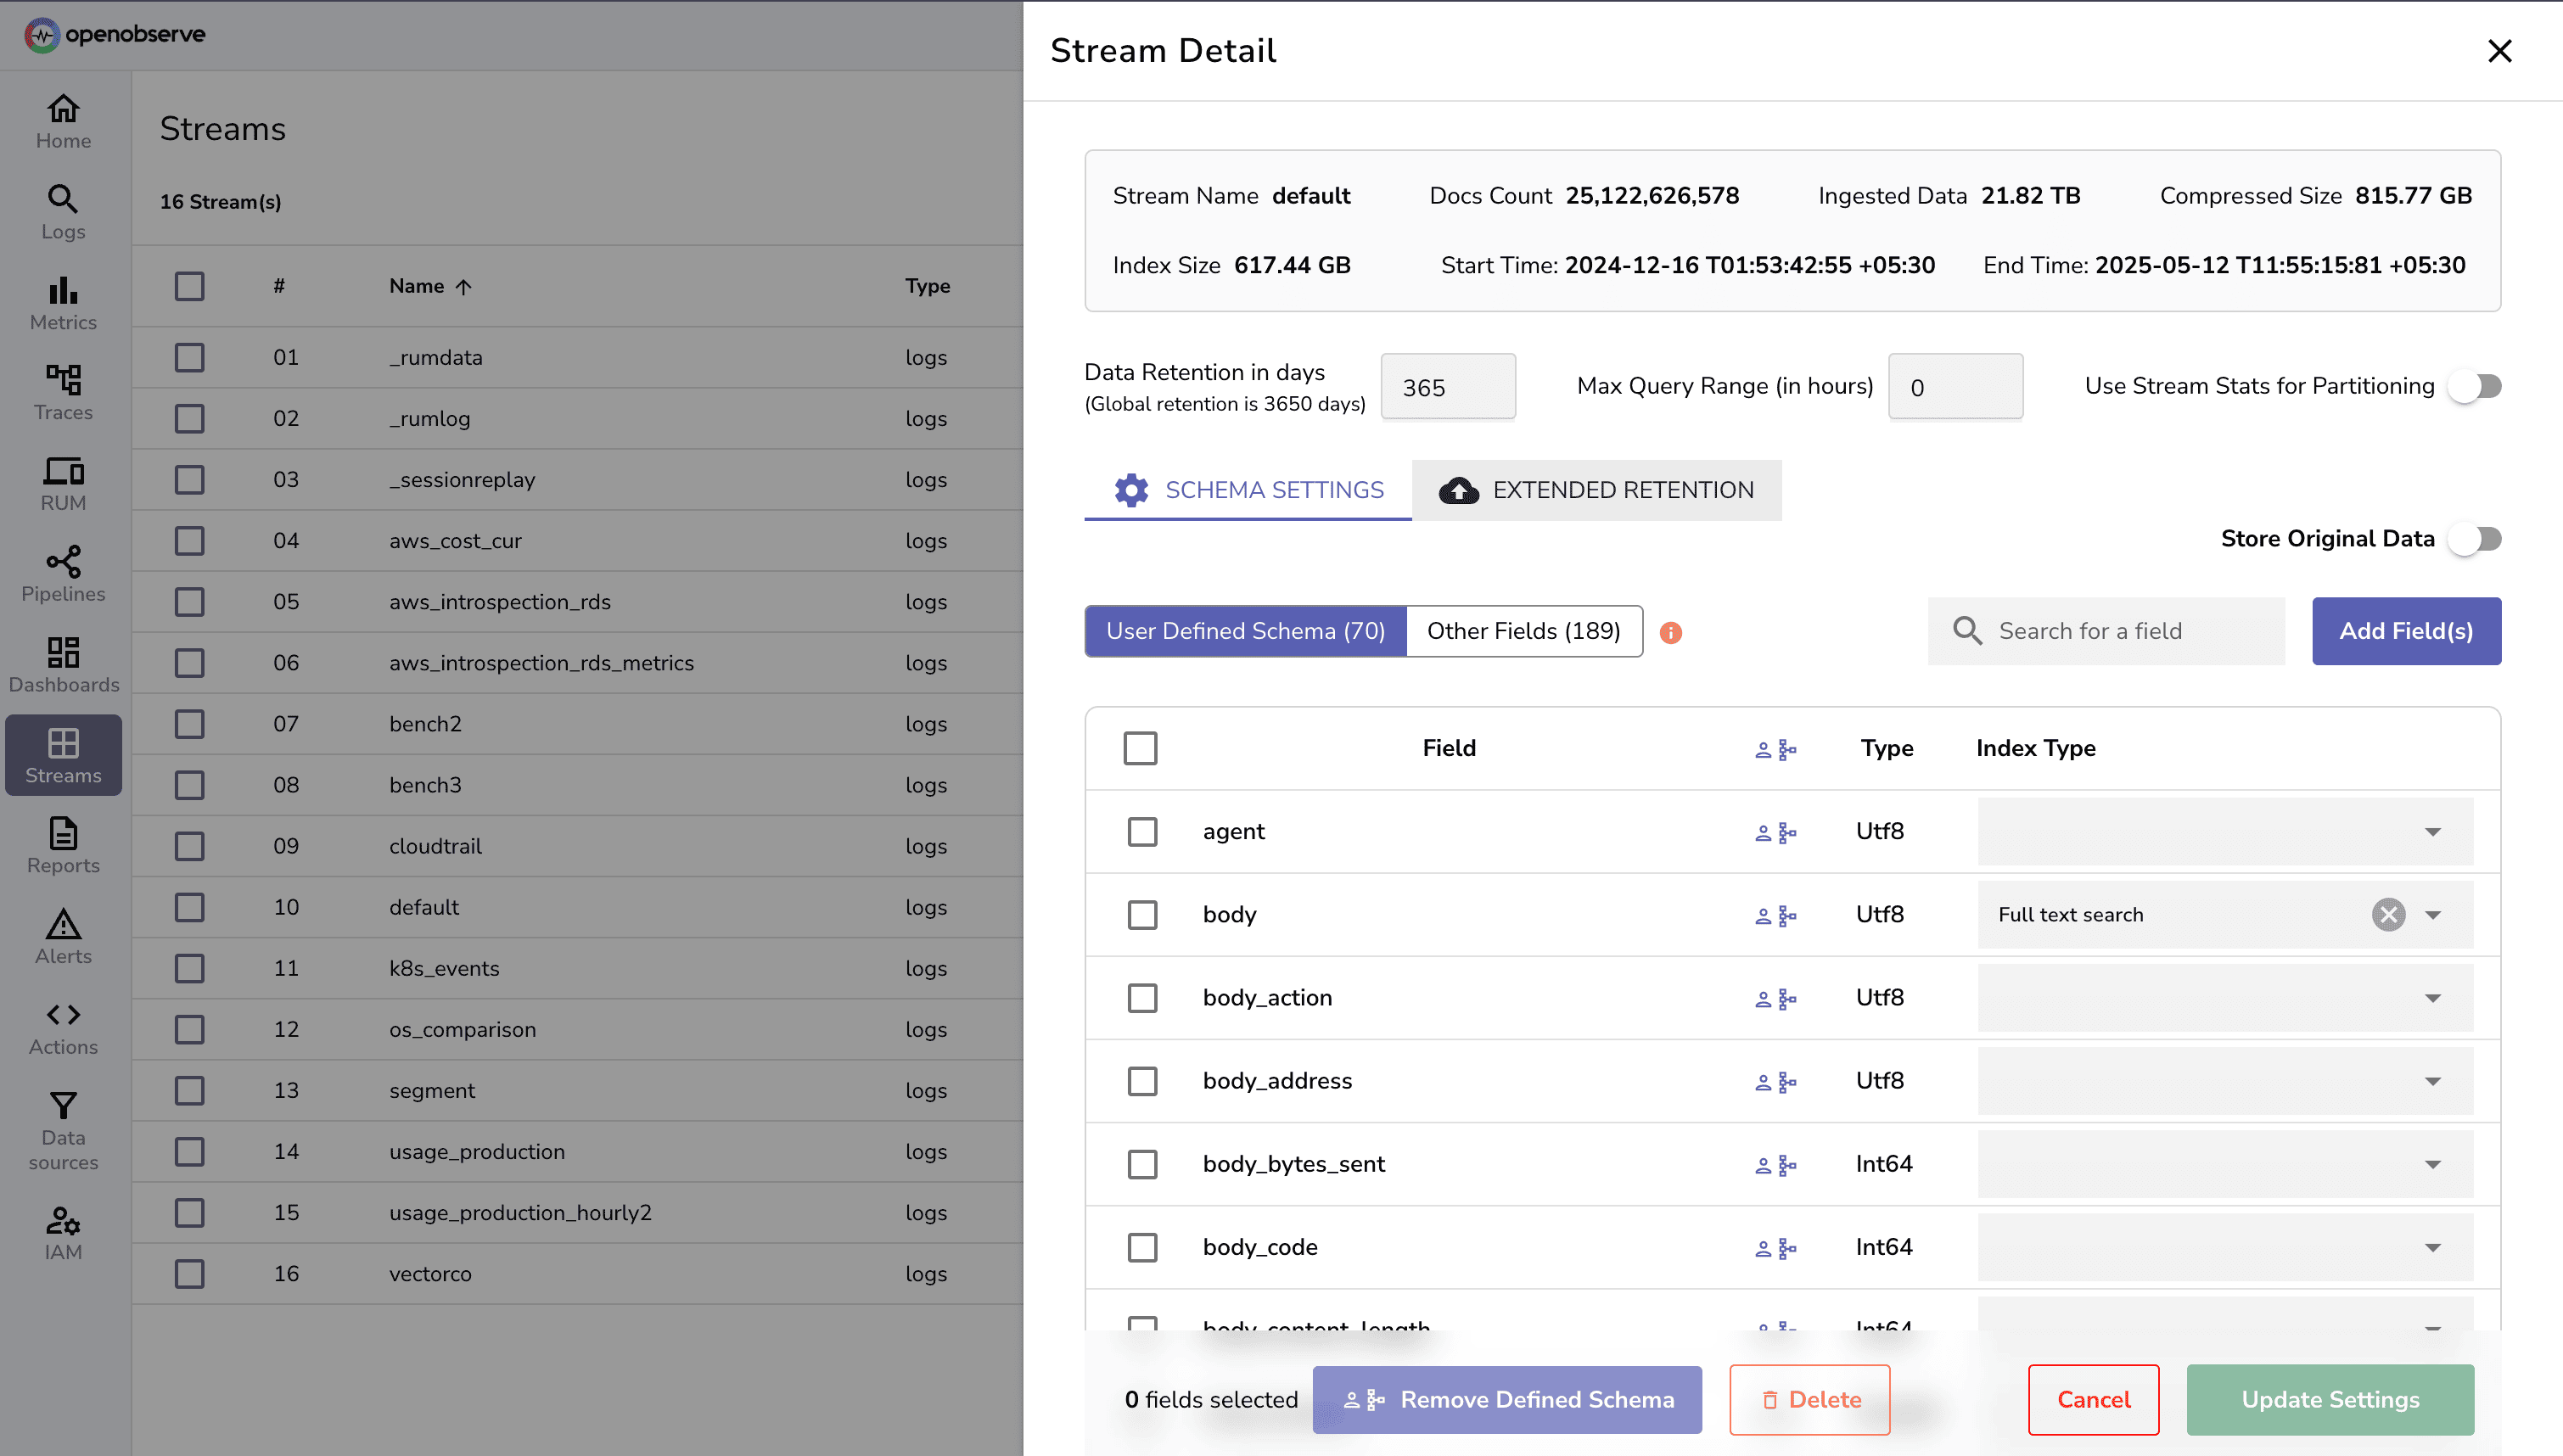
Optimized Storage
Industry-Leading Compression
Slash log storage costs by up to 140x compared to Elasticsearch with our advanced columnar storage and Parquet format.
Retention Management
Configure custom log retention policies per data source, keeping valuable logs accessible longer without escalating costs.
Real-Time Analytics
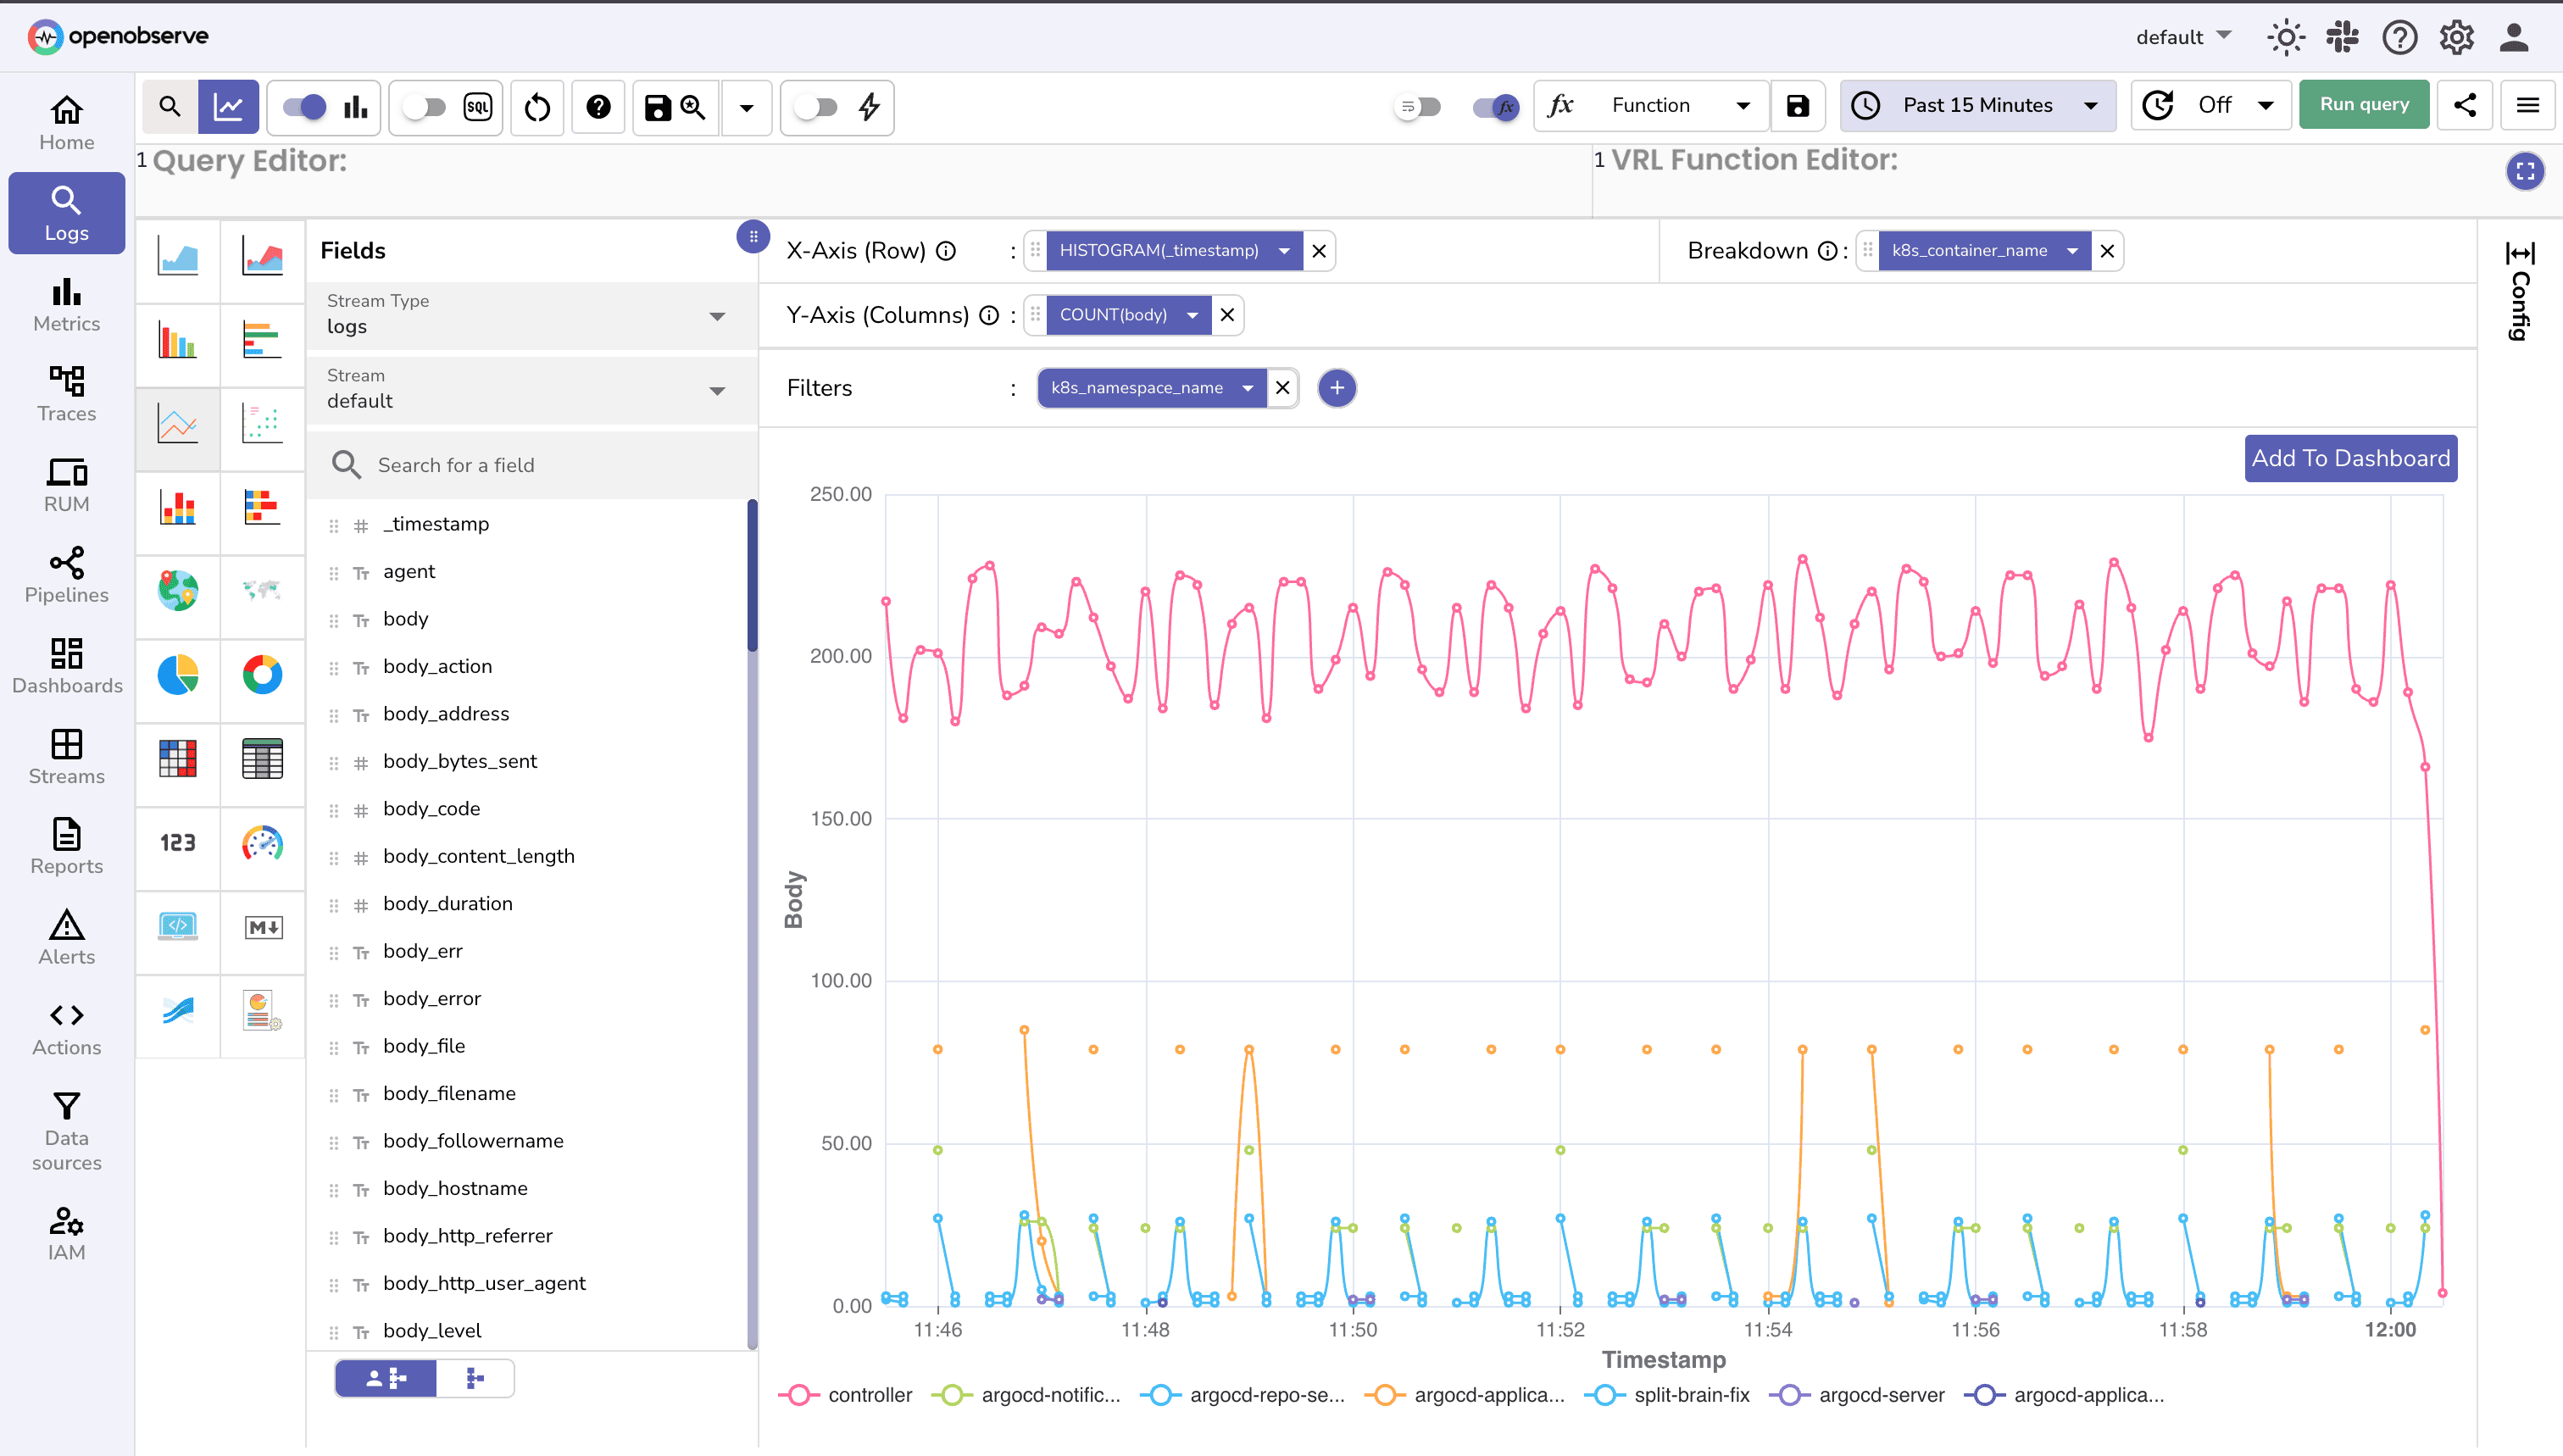
Instant Ingest-to-dashboard
Get answers the moment logs arrive, with sub-second results even across petabytes of data.
Log-centric Visualizations
Build customized logging dashboards in minutes with our drag-and-drop interface that updates live and shares with one click.
Powerful Search
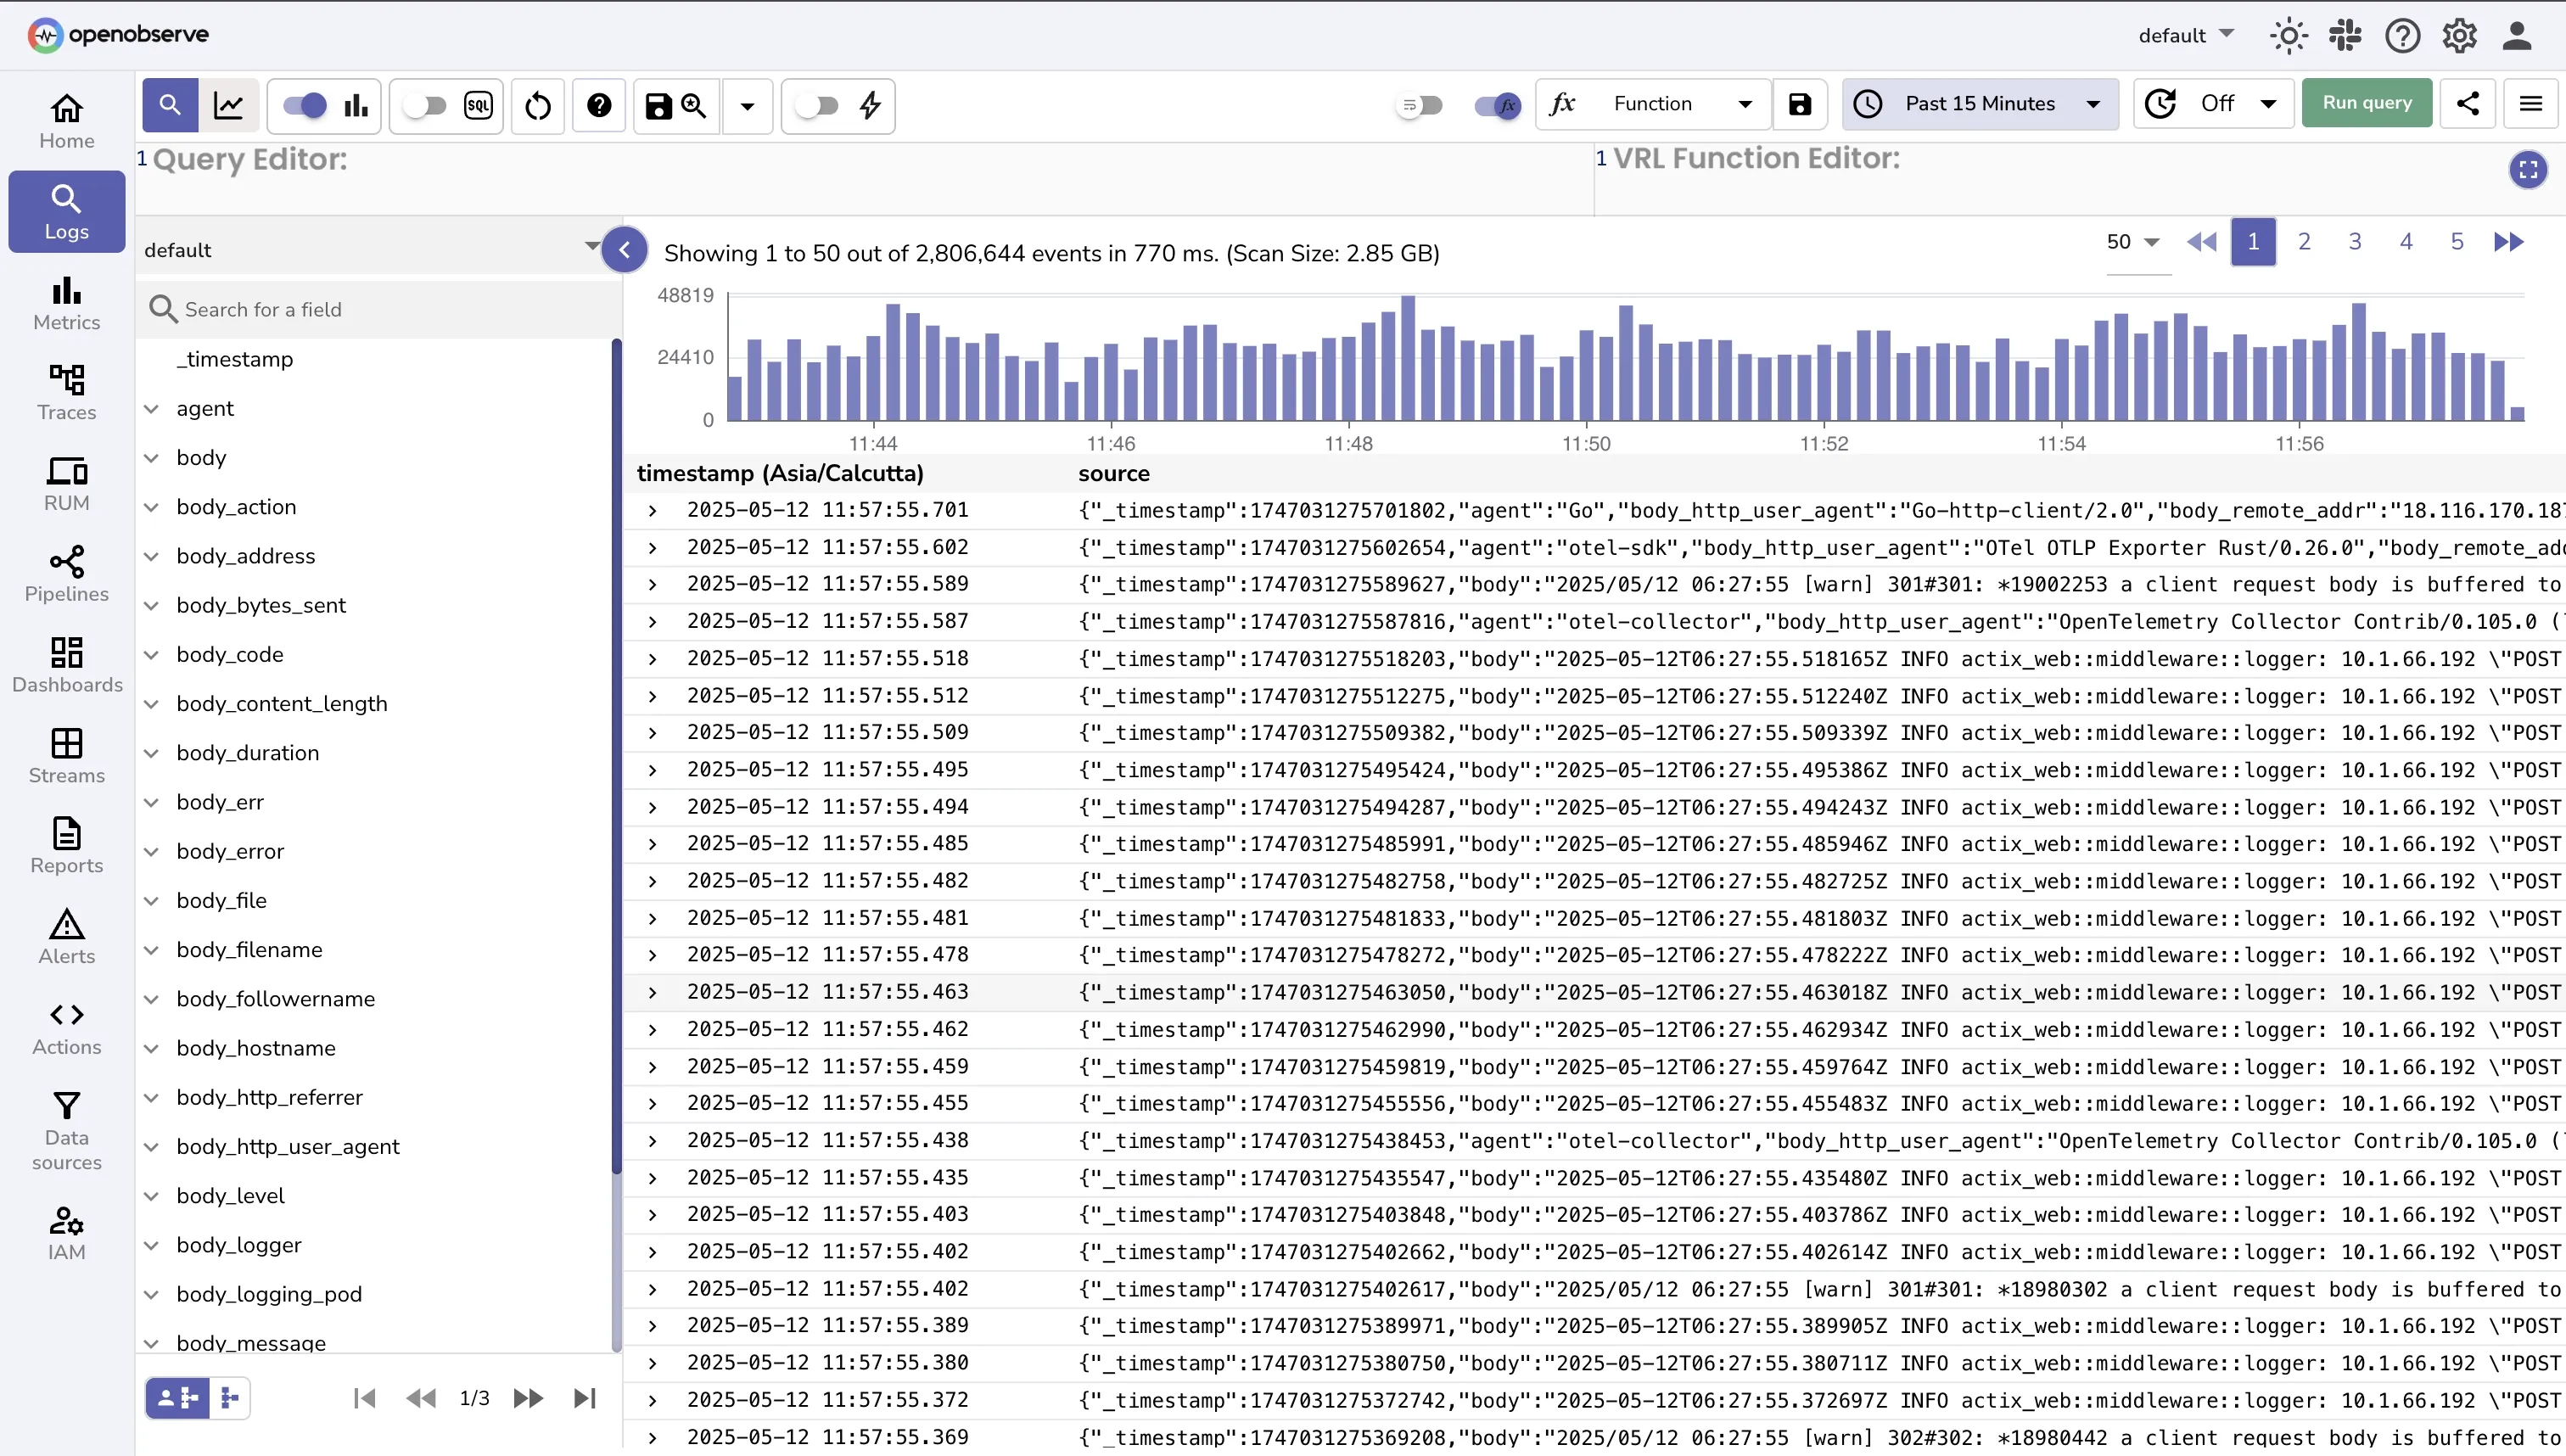
Instantaneous Text Search
Find specific log entries across massive datasets in seconds with intelligent pattern matching that surfaces relevant results first.
Simple, Yet Precise Queries
Utilize SQL to run precise queries and complex aggregations across all your log sources.
Log FAQs
Resources
Explore guides, videos, and articles to help you get the most out of Logs.

Ready to get started?
Try OpenObserve today for more efficient and performant observability.