A Beginner’s Guide to OpenTelemetry OTLP Exporters

Simran Kumari
September 19, 2025
9 min read
Don’t forget to share!
Try OpenObserve Cloud today for more efficient and performant observability.

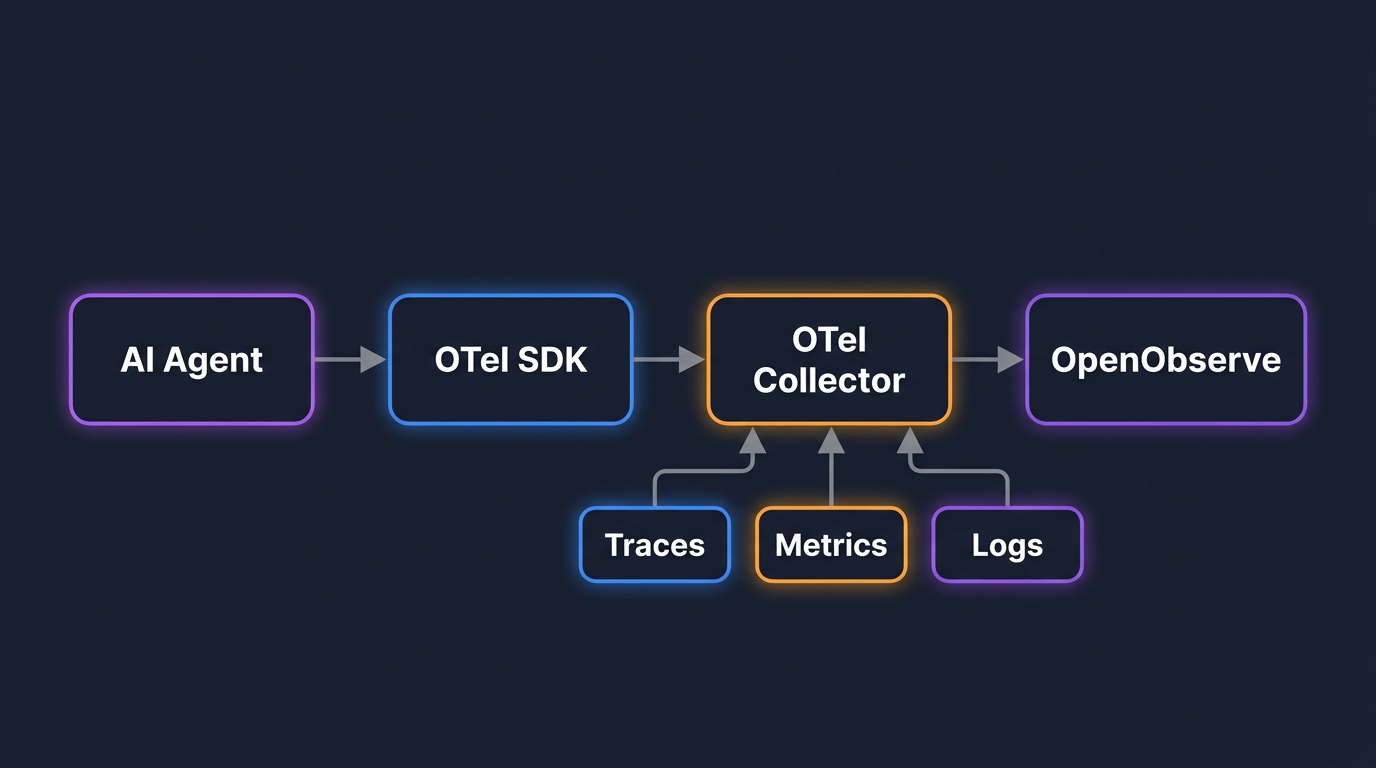
Monitoring your applications effectively starts with understanding how your data flows from your apps to a monitoring system. OTLP (OpenTelemetry Protocol) exporters are the tools that make this possible. They send traces, metrics, and logs from your applications to platforms like OpenObserve, allowing you to visualize performance, detect issues early, and respond quickly.
Use the OpenTelemetry Collector with an OTLP exporter (HTTP or gRPC) to send traces, metrics, and logs to OpenObserve’s OTLP endpoints. Start with HTTP for simplicity; switch to gRPC for sustained high volume/low latency. Then build dashboards and alerts.
This guide explains OTLP and its setup in a simple step-by-step format.
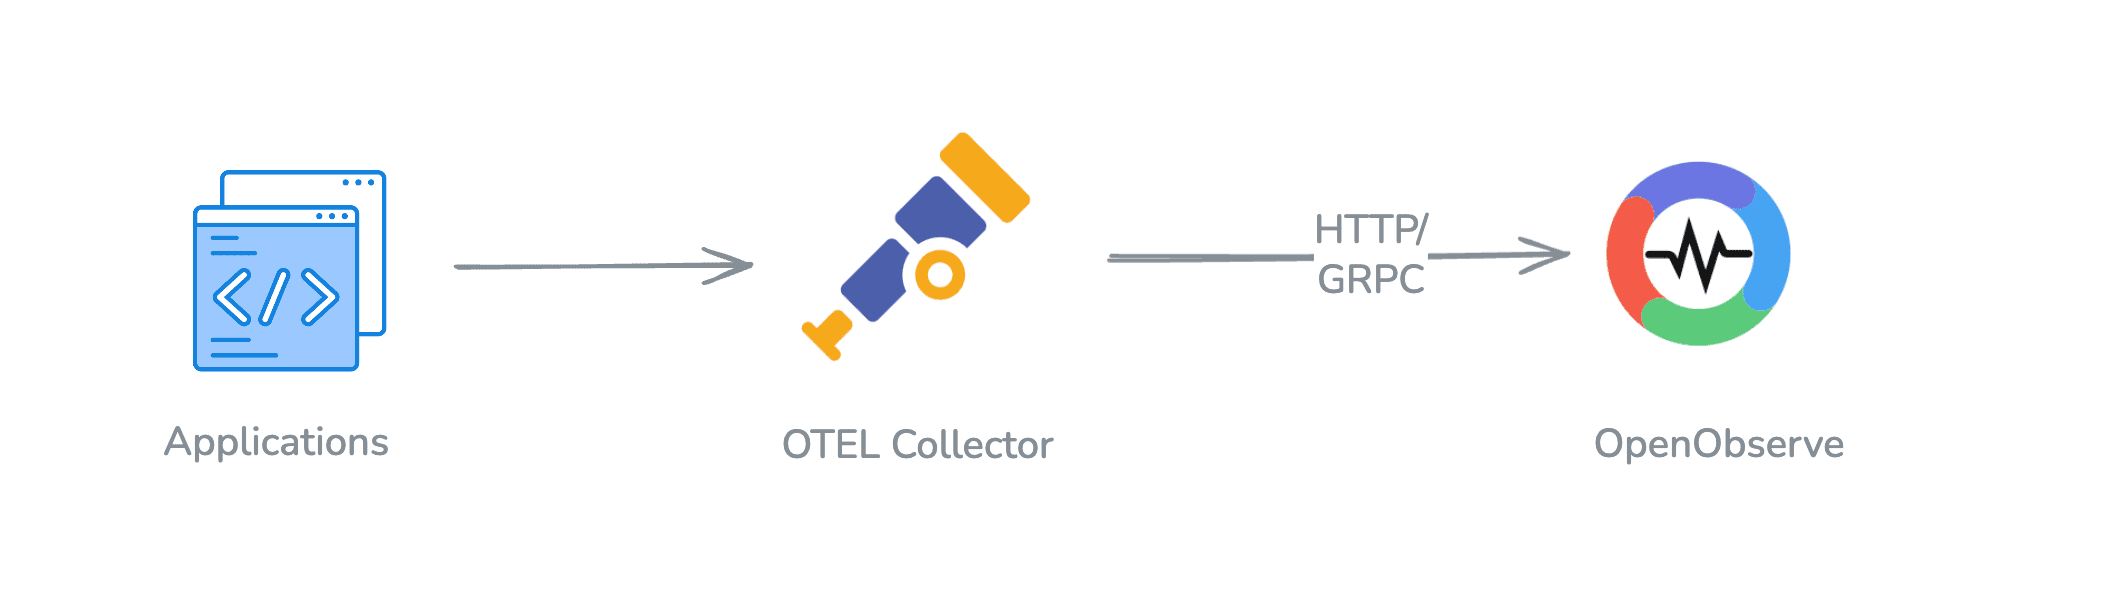
OTLP stands for OpenTelemetry Protocol. The OpenTelemetry Protocol (OTLP) is the standard method used to send telemetry data traces, metrics, and logs from your applications to a monitoring backend. It acts as the bridge between your applications and observability platforms like OpenObserve, ensuring that your performance data arrives reliably and efficiently.
OTLP is designed to be:
With OTLP, you don’t need separate tools for different types of telemetry. Everything flows through the same protocol, which simplifies setup and monitoring.
OTLP sends data efficiently using three key concepts: encoding, transport, and delivery.
Delivery: Employs mechanisms like compression and batching to optimize data delivery, reducing the load on both the network and the backend systems.
OTLP operates on a straightforward request and response model:
This model ensures reliable data transmission and provides feedback on the status of each data export operation.
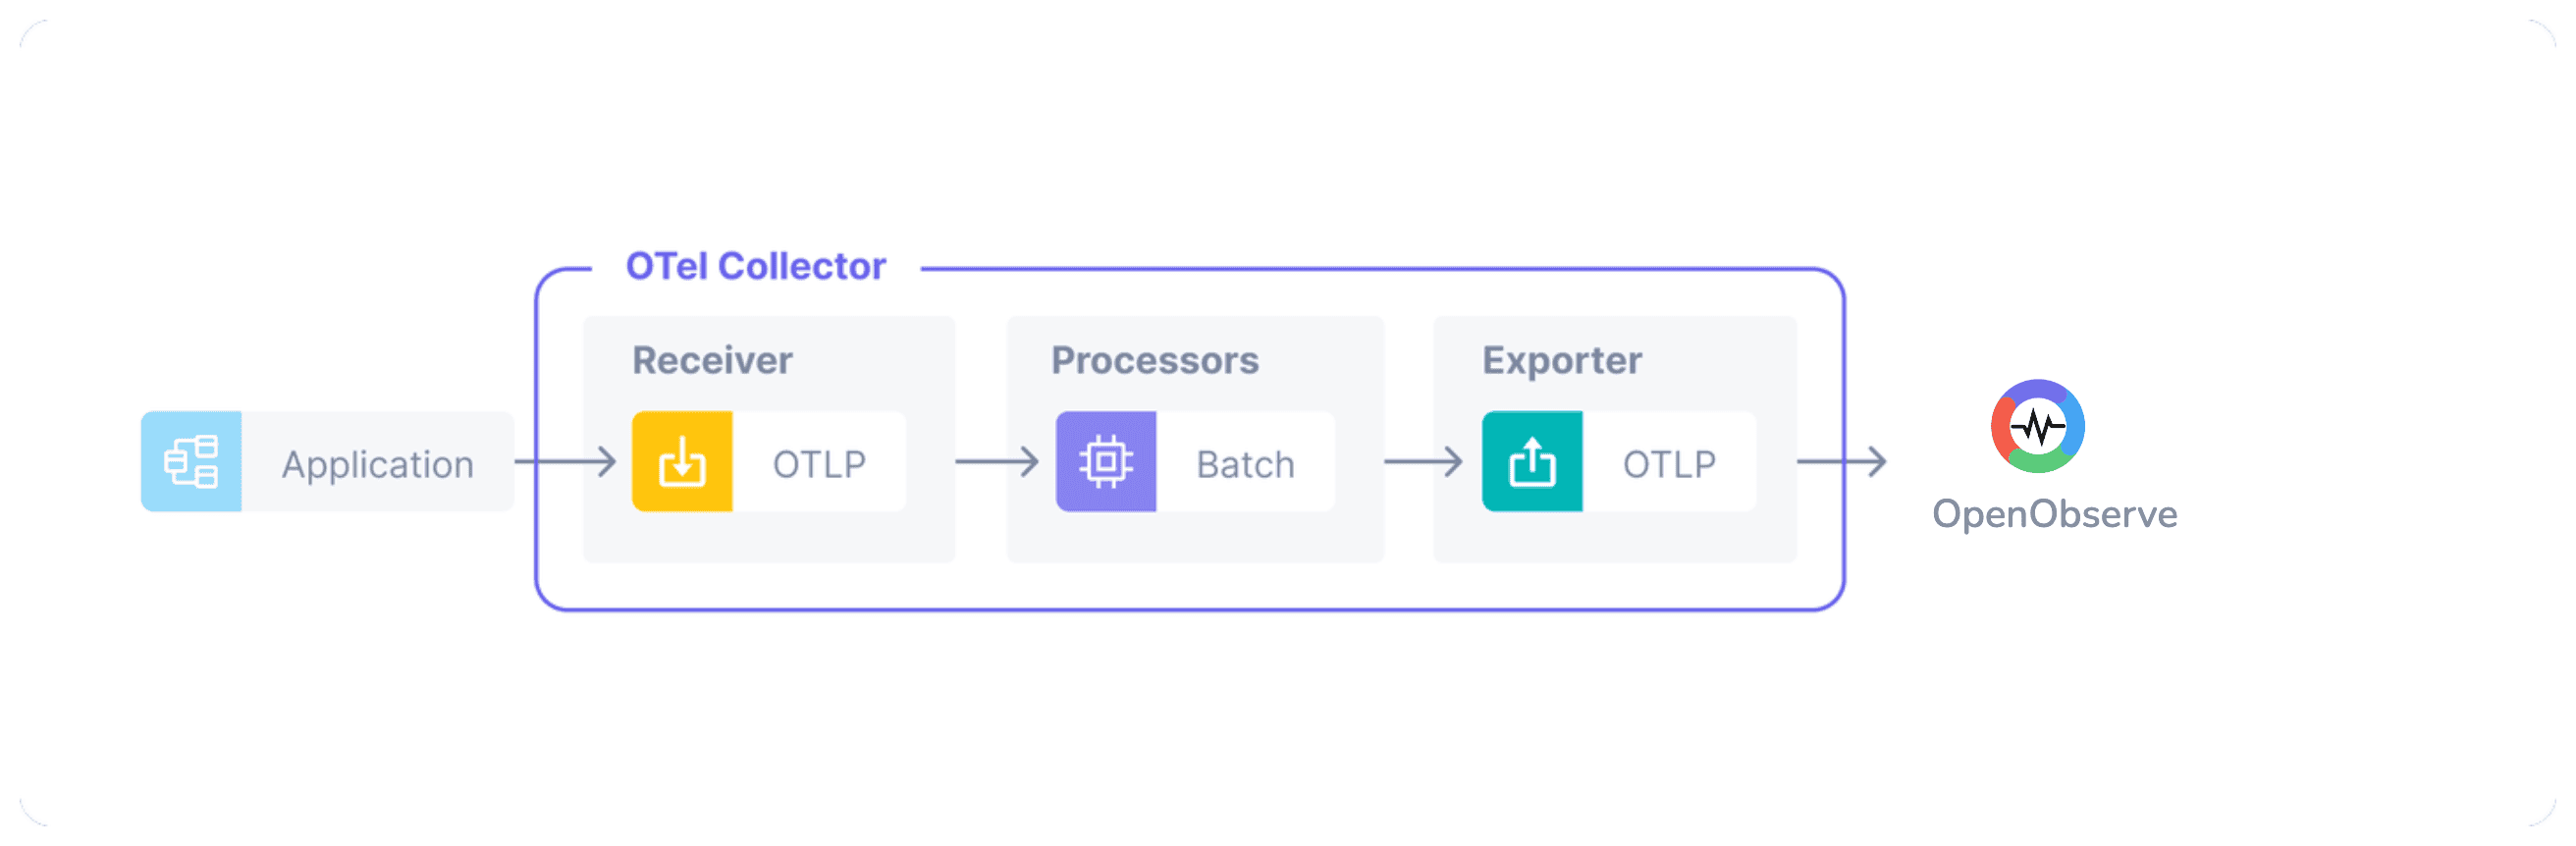
An OTLP exporter is the component that sends your telemetry data from the OpenTelemetry Collector to a backend like OpenObserve. Exporters handle authentication, compression, and batching and can be configured for either HTTP or gRPC transport. Essentially, they act as the bridge between your application’s telemetry and your monitoring platform.
OTLP can send data using two main transport methods: HTTP and gRPC. Each has its own strengths depending on your needs.
| Aspect | OTLP/HTTP | OTLP/gRPC |
|---|---|---|
| Default port | :4318 |
:4317 |
| Payload | Protobuf or JSON | Protobuf (binary) |
| Pattern | POST request/response | Unary + streaming |
| When to use | Simple, debug‑friendly | High‑volume, low latency |
HTTP is the simpler option and widely supported across networks. It works well if you want ease of setup and easy debugging.
Key features of OTLP/HTTP:
HTTP is perfect for teams that are starting with OTLP and don’t need continuous streaming.
To set up OTLP over HTTP in the OpenTelemetry Collector, you define an HTTP exporter and configure your pipelines for traces, metrics, and logs.
Example configuration:
exporters:
  otlphttp:
    endpoint: "http://localhost:4318"
    headers:
      Authorization: "Bearer your_api_token"
    compression: gzip
    timeout: 10s

service:
  pipelines:
    traces:
      receivers: [otlp]
      exporters: [logging, otlphttp]
    metrics:
      receivers: [otlp]
      exporters: [logging, otlphttp]
    logs:
      receivers: [otlp]
      exporters: [logging, otlphttp]
HTTP is simple, widely compatible, and allows you to use either binary protobuf for efficiency or JSON for easy debugging.
gRPC is a high-performance transport designed for real-time telemetry. It is especially useful when you have high-volume applications or need low-latency monitoring.
Key features of OTLP/gRPC:
Binary data only: Uses protobuf for compact and fast transmission.
Streaming support: Can send continuous sequences of telemetry data, ideal for real-time insights.
Unary requests: Each request gets an immediate response from the server.
Robustness: Built-in support for retries, deadlines, and cancellation.
gRPC is the preferred choice when you need fast, reliable, and continuous telemetry flow, such as monitoring a high-traffic web application or microservices.
endpoint to your OpenObserve ingest URL (see Data Sources) not the Collector’s receiver port. Authorization: Bearer <TOKEN> header. compression: gzip and processors: [batch] enabled.For higher performance, OTLP over gRPC is recommended. gRPC supports streaming telemetry data, which reduces latency and improves real-time monitoring.
Example configuration:
exporters:
  otlp:
    endpoint: "localhost:4317"
    tls:
      insecure: true
    compression: gzip

service:
  pipelines:
    traces:
      receivers: [otlp]
      exporters: [logging, otlp]
    metrics:
      receivers: [otlp]
      exporters: [logging, otlp]
    logs:
      receivers: [otlp]
      exporters: [logging, otlp]
gRPC ensures continuous data flow, low latency, and reliability with built-in retry mechanisms.
:4317 and the gRPC exporter (exporters.otlp), not otlphttp. tls.insecure: true only for local/self-signed labs; prefer proper TLS in prod.Choosing between HTTP and gRPC depends on your needs. HTTP is great for simplicity, debugging, and broad compatibility. gRPC offers better performance, low latency, and supports continuous streaming of telemetry data, which is ideal for real-time monitoring.
Here are the key differences:
If your goal is easy setup and debugging, start with HTTP. If you need real-time, high-performance telemetry, gRPC is the better choice.
You can explore other exporters:
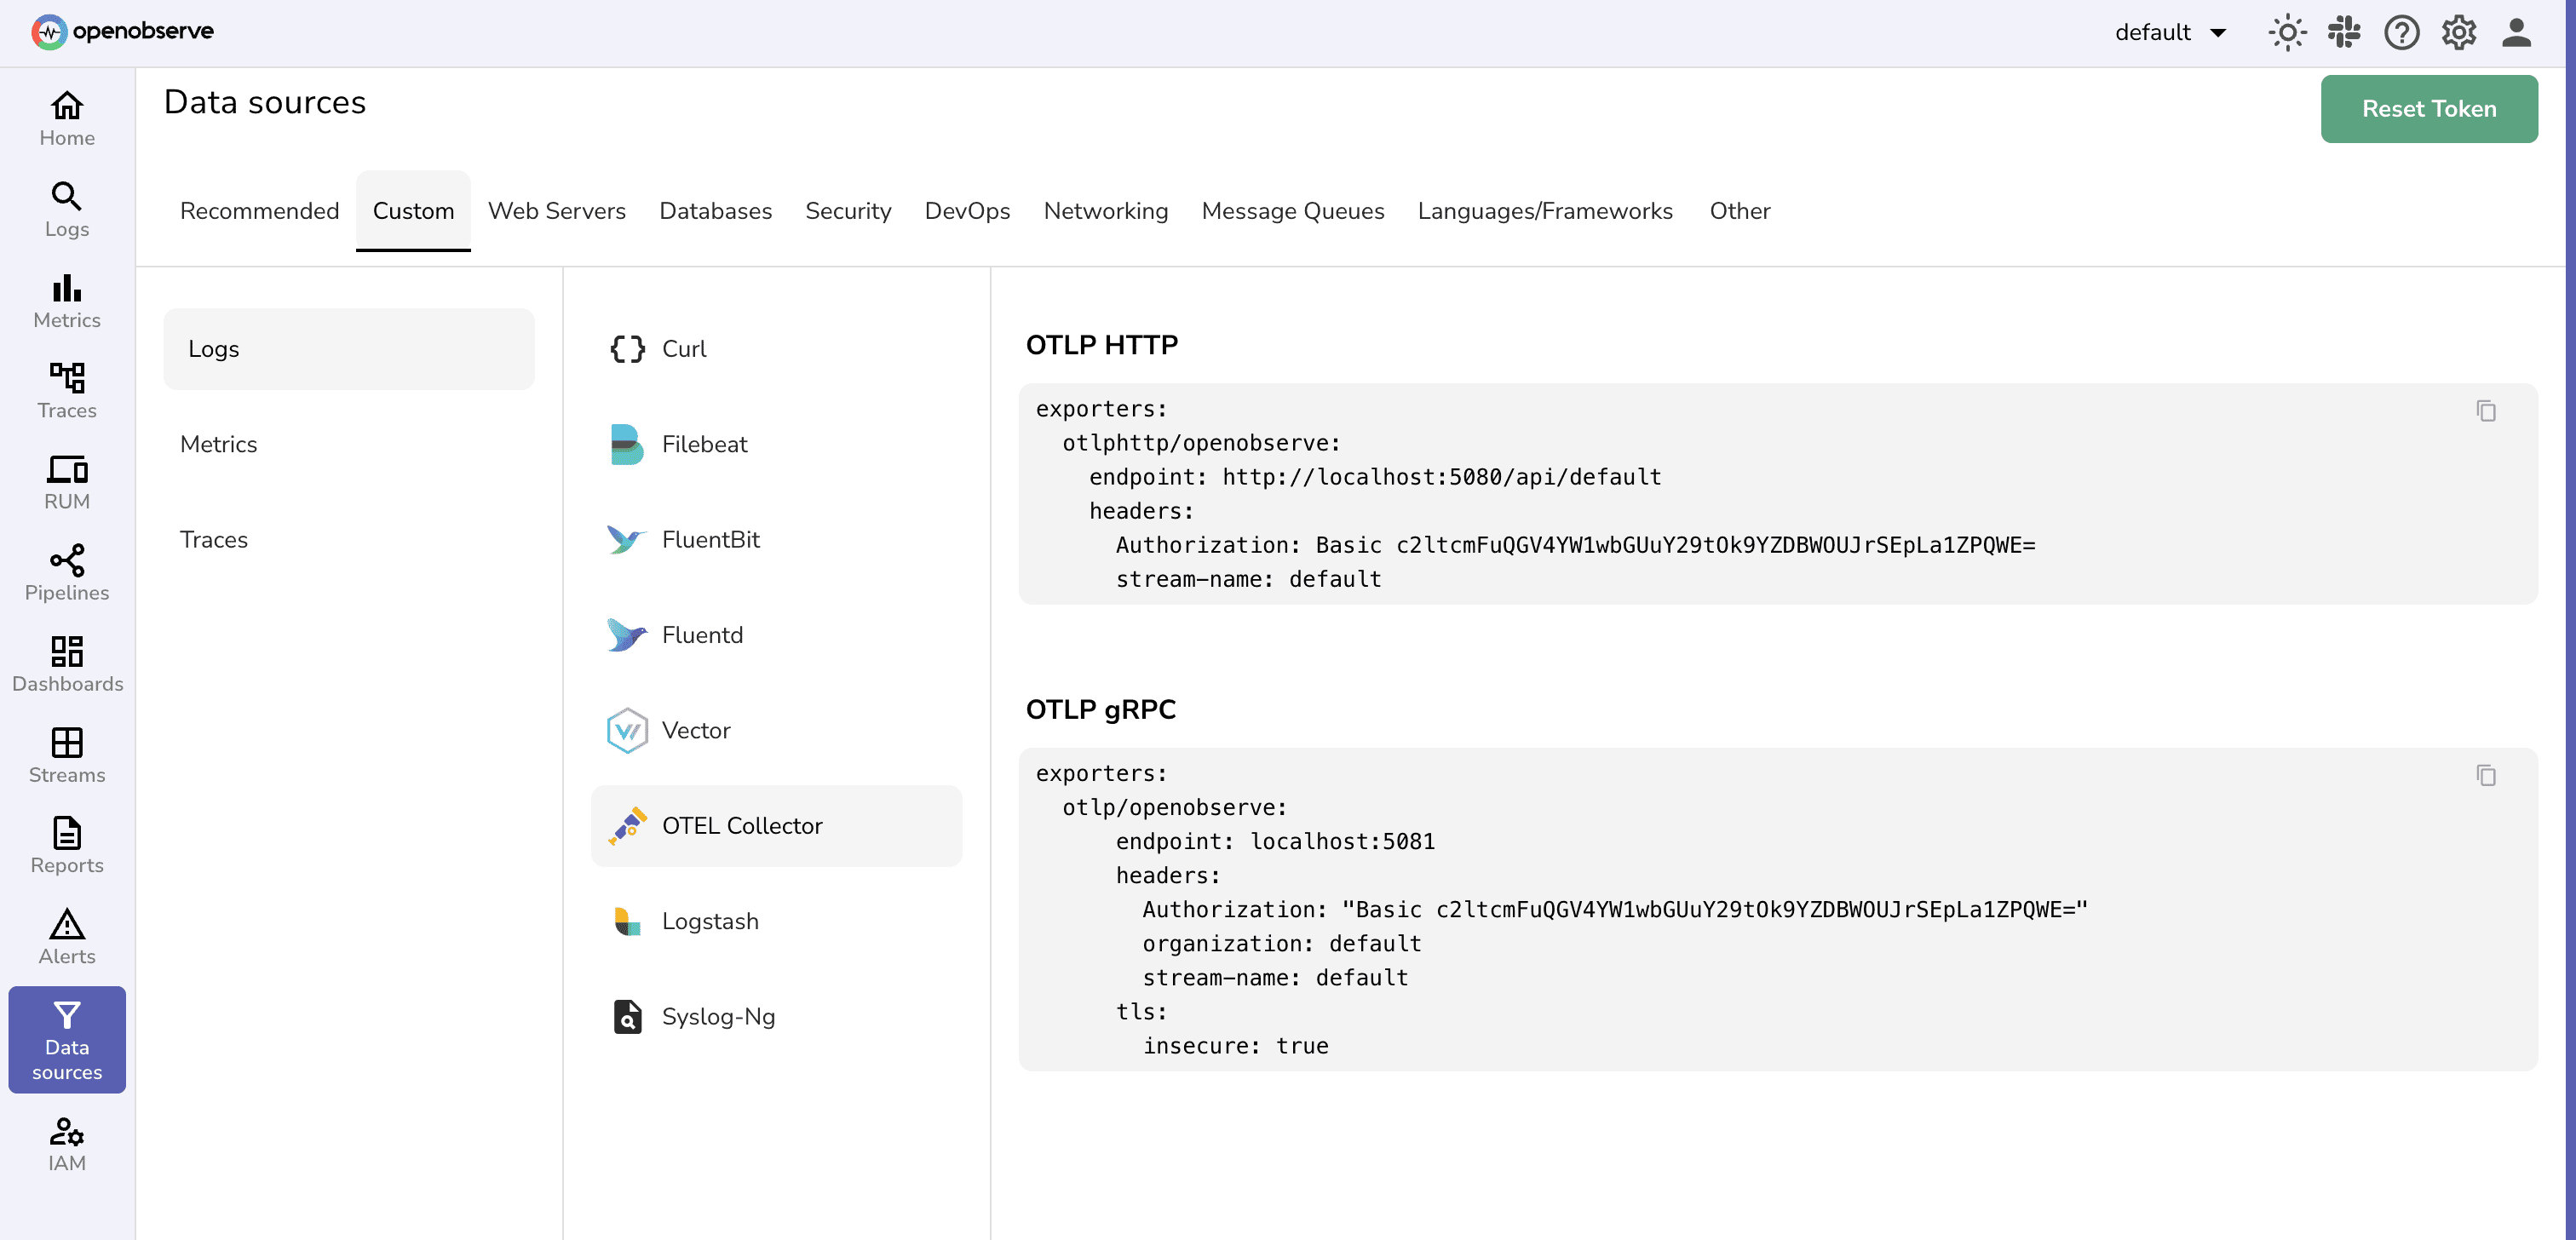
OpenObserve can receive OTLP data from both HTTP and gRPC exporters. For HTTP, you configure the collector with the OpenObserve endpoint and authentication headers.
receivers:
  otlp:
    protocols:
      http:
        endpoint: "0.0.0.0:4318"
      grpc:
        endpoint: "0.0.0.0:4317"
service:
  pipelines:
    traces:
      receivers: [otlp]
      processors: [batch]
      exporters: [logging, otlphttp] # Use `otlp` for gRPC
    metrics:
      receivers: [otlp]
      processors: [batch]
      exporters: [logging, otlphttp]
    logs:
      receivers: [otlp]
      processors: [batch]
      exporters: [logging, otlphttp]
otelcol --config=otel-config.yml
otlphttp with otlp in pipelines if using the gRPC exporter. batch processor improves performance by sending multiple events together.Import tip: start with HTTP, confirm data is flowing, then switch to gRPC if you need lower latency or sustained high throughput.
Integrating OTLP with OpenObserve provides several advantages:
Pair OTLP with OpenObserve’s columnar/object storage so petabyte‑scale signals stay searchable and affordable.
Integrating OpenTelemetry OTLP Exporters with OpenObserve is a powerful way to enhance your telemetry setup. By following the detailed configurations for both OTLP HTTP and OTLP gRPC, you can seamlessly transmit traces, metrics, and logs to OpenObserve, unlocking comprehensive observability features such as advanced visualization and real-time alerting.
This integration not only standardizes your telemetry data transmission but also ensures you have robust tools to monitor and analyze your system's performance.
headers.Authorization: "Bearer <TOKEN>". Passionate about observability, AI systems, and cloud-native tools. All in on DevOps and improving the developer experience.