Learn about the Prometheus agent mode, a solution for efficient metric shipping at remote locations, with improved scalability and performance.
Learn how the MySQL receiver plays a key role in aggregating, filtering, and sampling telemetry data for efficient monitoring.
Our blog provides a detailed overview of top open-source log management tools, stressing on their primary features and usability.
Learn to configure a Splunk Enterprise Receiver using Splunk Web, the command line, or a configuration file.
Understanding the role of APM metrics, we cover essential indicators for peak performance, ensuring application health, and real-time monitoring.
Step-by-step process to configure and activate Splunk HEC Receiver for efficient data collection and management.
Learn how Prometheus counts unique label values using basic queries and methods like `count(count by (label) (metric))`.
Learn the importance of monitoring Oracle DB Receiver in cloud environments and converting query results into actionable metrics.
Learn how to configure Dsquery for effective Active Directory DS Receiver monitoring and schedule regular checks.
The blog post explains how to configure Prometheus Receiver with OpenTelemetry Collector to collect and monitor metrics.
Learn how OpenTelemetry Receiver integrates with Google Cloud Spanner for essential database metric monitoring and transactions.
Learn the significance of efficiently receiving messages a RabbitMQ Receiver in a Spring application.
Understand the role of Docker metrics in monitoring container performance and system health with Docker Stats Receiver.
Setup and configure a Zookeeper Receiver via OpenTelemetry Collector, and get critical monitoring metrics from your Zookeeper installations.
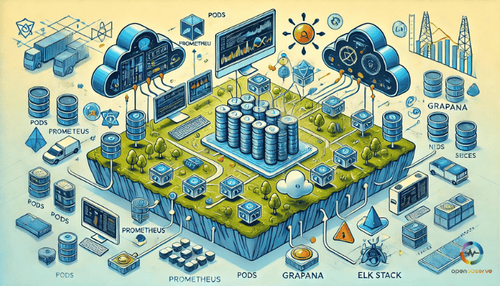
Discover key methods for monitoring Kubernetes like DaemonSets, Heapster and OpenTelemetry for consistent, comprehensive telemetry data.
Explore top Elasticsearch competitors like Algolia, Typesense, and Meilisearch for performance, scalability, and advanced features.
Learn how log searching simplifies understanding large data volumes and enhances effective data management with tools like Middleware and Sumo Logic.
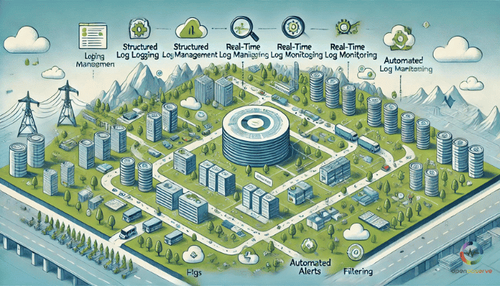
Our blog emphasizes on easier logs management and troubleshooting practices like defining clear logging objectives and structured logs.
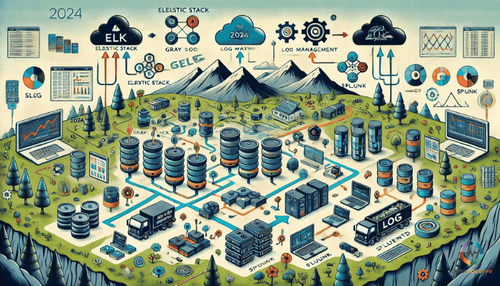
Discover the top log management solutions for 2024, emphasizing on centralized logging, security aspects and scalability.
Dynatrace and AppDynamics' comparison highlights key features like APM, AI-driven analytics, user experience monitoring, cost, and pricing models.
ECS logging is crucial for reliability, performance. Tools like OpenObserve can make log collection and management easier.