Understanding Real User Monitoring (RUM)
Introduction to Real User Monitoring: Enhancing Digital Experiences
Let’s explore the concept of Real User Monitoring (RUM), a crucial component in the field of web and application development. By focusing on how users actually interact with your platforms, you can significantly enhance the user experience and boost customer retention.
Why Real User Monitoring Matters
Real User Monitoring is all about capturing and analyzing every action that a user takes on your website or application. It's not just about tracking page views or clicks; it's about understanding the quality of the experience from your users’ perspective.
Why does this matter?
Because in today's digital age, the user experience is primary. A smooth, responsive, and error-free interaction can make the difference between a loyal customer and one who moves on to your competitor.
Capture Every Click, Swipe, and Scroll
Let’s say you're refining the user interface of an application. With Real User Monitoring, you can see how long they spend on certain pages, how they navigate through your site, and where they encounter issues.
This data is invaluable because it tells you not just what's happening, but how to improve and streamline your user interfaces.
Boosting Customer Retention Through Insight
By understanding user behavior in real-time, you can quickly identify and correct pain points, leading to a more enjoyable experience for the user. Happy users are more likely to return and recommend your site or app to others, directly impacting your site’s success and growth.
In essence, Real User Monitoring equips you with the insights needed to create a user-centric digital environment.
This approach not only retains customers but also attracts new ones by raising the standard of user interaction.
What is Real User Monitoring?
Let's dive into the definition, applications, and metrics involved in RUM to paint a clearer picture of its capabilities and impact.
Defining Real User Monitoring
Real User Monitoring is a technology used to capture and analyze every interaction a user has with a website or application in real time. This includes everything from the moment they open your app or land on your website, to the moment they leave.
The purpose?
To gain a comprehensive understanding of the user experience, uncover problems, and optimize performance based on actual user behavior, not just hypothetical scenarios.
A Focus on User Interactions
At its core, RUM is about collecting data directly from the user's device. Whether they are clicking a button, filling out a form, or just navigating through content, RUM tracks these interactions to provide a detailed view of the user journey across your digital platforms.
Browser-Based vs. Native Mobile Application Monitoring
When it comes to Real User Monitoring, the platform matters. Monitoring user interactions differs significantly between browsers and native mobile applications due to the underlying technologies and usage patterns.
Browser-Based Monitoring
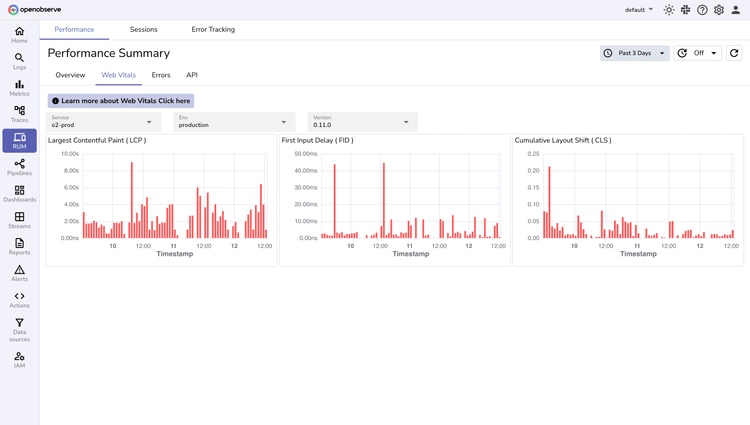
In browser-based environments, RUM can capture metrics such as page load times, interactions with various web elements, and how content loads dynamically with user actions. This data is crucial for optimizing web pages to reduce bounce rates and increase user engagement.
Native Mobile Application Monitoring
For native mobile applications, RUM extends to understanding how the app performs on different devices, how long specific actions take, and how users interact with the application via touch gestures. This is particularly important as mobile users expect lightning-fast responses and minimal latency.
Metrics That Matter
Real User Monitoring collects a variety of metrics that are vital for diagnosing and improving the user experience. Here are a few key metrics:
- Load Actions: How long it takes for pages or screens to become interactive.
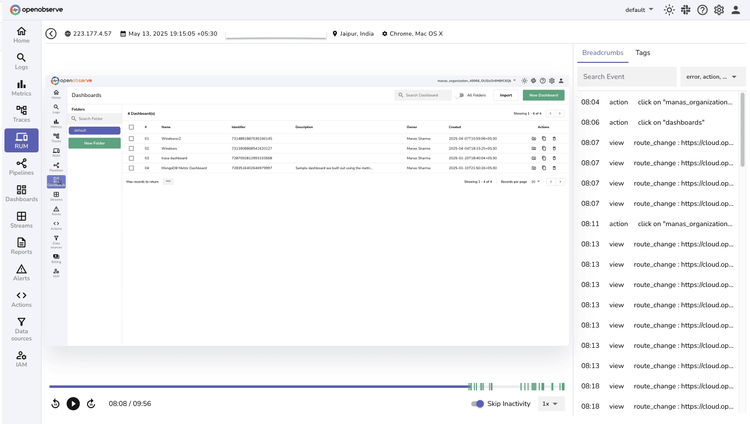
- User Sessions: The sequence of actions a user takes within a session, providing insights into user flows and potential drop-off points.
- Performance Measurements: Includes detailed timing data like network latency, server response times, and rendering speeds.
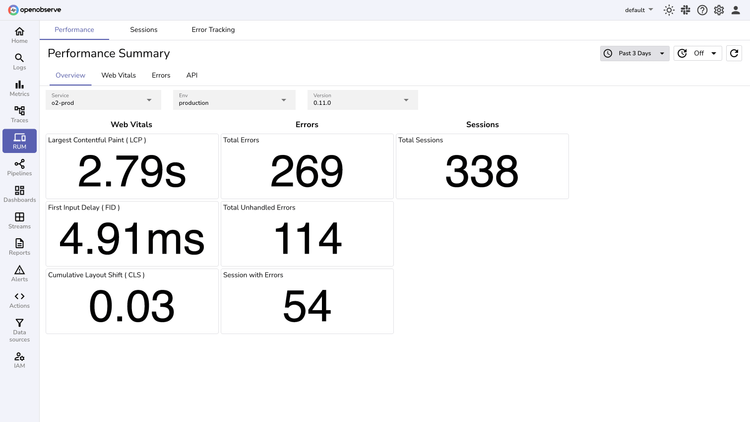
By analyzing these metrics, developers and site managers can pinpoint where users are having a smooth experience and where they are not. This leads to targeted improvements that can dramatically enhance the overall user experience.
Understanding Real User Monitoring is the first step towards making informed decisions that directly enhance user satisfaction and engagement.
As we continue to delve deeper into this topic, remember that each piece of data collected is a stepping stone towards a more refined digital experience.
How Real User Monitoring Works
Here we'll break down how RUM functions from code insertion to the transformation of raw data into actionable insights.
Inserting the Monitoring Code
The backbone of Real User Monitoring is the data collection mechanism, typically achieved through JavaScript code embedded in web pages or secure API calls in mobile apps.
JavaScript Integration for Web
For web applications, a JavaScript snippet is inserted into the header of each webpage. This snippet runs in the user's browser and collects data on their interactions, errors, and timings.
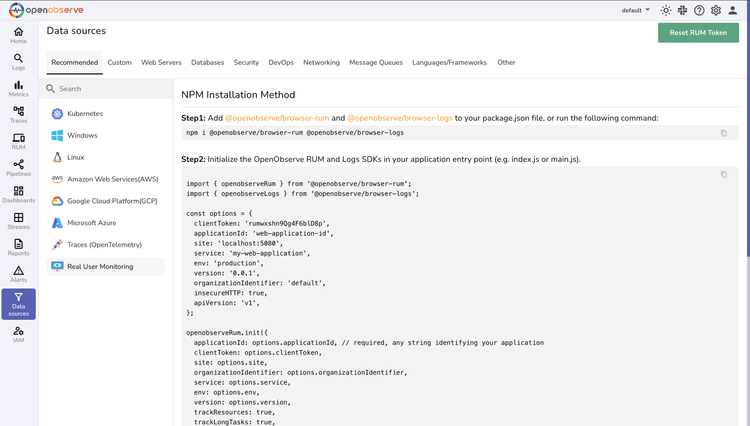
For example, OpenObserve offers Real User Monitoring (RUM) to capture detailed metrics about user experience. By integrating OpenObserve’s JavaScript snippet into your web pages, you can collect valuable data on page load times, user interactions, and any errors encountered. Here’s a simple example of how you might capture and log page load times using OpenObserve:
<script src="https://cdn.openobserve.ai/rum.js"></script> <script> openobserve('init', { projectId: 'your_project_id', apiKey: 'your_api_key' }); window.onload = function() { var loadTime = window.performance.timing.domContentLoadedEventEnd - window.performance.timing.navigationStart; openobserve('logEvent', 'PageLoad', { loadTime: loadTime }); console.log("Page load time is " + loadTime); }; </script>
In this example, openobserve('init', {...}) initializes the OpenObserve RUM script with your project ID and API key. When the page loads, it calculates the load time and logs this event to OpenObserve, enabling you to analyze this data and optimize your web application’s performance.
APIs for Mobile Apps
In mobile applications, developers integrate RUM capabilities through SDKs that interact with APIs to capture detailed data about user sessions, such as screen transitions, button taps, and other interactions.
Configuring Your RUM Tool
The setup of Real User Monitoring tools can vary from automatic configurations, which require minimal user input, to manual setups that allow for more customized data tracking.
Automatic Configuration
OpenObserve Real User Monitoring (RUM) offers automatic detection of user interactions, page views, and network requests. This is ideal for developers who want to start quickly without configuring every detail. By simply adding the OpenObserve RUM script to your web pages, you can effortlessly collect comprehensive metrics on user activity.
Here’s an example of how to set up OpenObserve RUM for automatic configuration:
<script src="https://cdn.openobserve.ai/rum.js"></script> <script> openobserve('init', { projectId: 'your_project_id', apiKey: 'your_api_key', autoTrack: true // Enables automatic tracking of user interactions, page views, and network requests }); </script>
With autoTrack: true, OpenObserve automatically tracks and logs user interactions, page views, and network requests. This means you can quickly start collecting valuable user experience data without the need to manually configure each detail.
Manual Configuration
Manual configuration might involve setting up custom events or interactions to track, which can be crucial for complex applications.
For instance, if you have an e-commerce site, you might want to manually track specific actions like "Add to Cart" button clicks or checkout steps:
document.getElementById('addToCartButton').addEventListener('click', function() { trackUserInteraction('Add to Cart', 'Button Click'); });
From Data to Insights
Once the data is collected, it undergoes a transformation process to convert it into insights that can drive performance improvements.
Data Processing
The collected data is sent to a server where it is processed and analyzed. This might include aggregating data from multiple users to identify common trends and bottlenecks.
Generating Actionable Insights
The final step is translating this aggregated data into actionable insights. RUM tools typically provide dashboards and reports that highlight areas for improvement.
For example, if many users experience slow load times on a specific page, the RUM tool might flag this as a priority for optimization.
By understanding how Real User Monitoring works—from code insertion to generating actionable insights—you can effectively utilize this tool to enhance the performance and usability of your digital products.
This not only improves user satisfaction but also helps maintain a competitive edge in the fast-paced world of tech development.
Real User Monitoring vs Synthetic Monitoring
1. Comparison between real user interactions based RUM and simulated data of synthetic monitoring
2. Advantages of combining RUM with synthetic monitoring for comprehensive application performance analysis
In the realm of web and application performance analysis, Real User Monitoring (RUM) and Synthetic Monitoring are two sides of the same coin, each offering unique insights into your system's operation.
Understanding the differences and synergies between these two approaches can significantly enhance your monitoring strategy.
Understanding the Differences
The primary distinction between Real User Monitoring and Synthetic Monitoring lies in the source and nature of the data they collect.
Feature | Real User Monitoring (RUM) | Synthetic Monitoring |
Data Source | Data collected from actual user interactions in real time. | Data generated from simulations that mimic user actions. |
User Insights | Provides insights based on real user behavior, reflecting genuine user experiences and environment variations. | Offers controlled, predictable inputs which do not reflect real user variance. |
Testing Time | Collects data continuously as users interact with the application. | Conducts tests at scheduled intervals, irrespective of user presence. |
Performance Insights | Identifies real-world performance and usability issues. | Identifies potential downtimes and performance issues before they affect users. |
Use Case | Ideal for understanding true user experience and measuring impact of specific changes in live environments. | Best for benchmarking and maintaining performance standards under controlled conditions. |
Response to Changes | Immediate feedback on changes based on user activities and responses. | Feedback is based on pre-scripted scenarios which may not capture all real user reactions. |
Combining RUM and Synthetic Monitoring
While each type of monitoring offers distinct benefits, combining them can lead to a more robust performance analysis strategy.
Comprehensive Coverage
Synthetic Monitoring allows you to test applications 24/7, even when real users are not present. This is crucial for identifying issues that might not yet have impacted actual users, such as a potential server failure at off-peak hours.
Real-Time Validation
On the other hand, Real User Monitoring provides ongoing validation of the fixes and optimizations you implement based on synthetic tests. By monitoring how real users interact with your application post-optimization, you can measure the actual impact of changes made.
Strategic Insights
Integrating both monitoring types offers a strategic advantage. For example, Synthetic Monitoring might identify a slow-loading page during a nightly test. Subsequent Real User Monitoring could then confirm if the issue persists during peak usage times, allowing for targeted optimizations.
By understanding the complementary nature of Real User Monitoring and Synthetic Monitoring, developers and managers can ensure a comprehensive approach to performance analysis.
Key Metrics Monitored in Real User Monitoring
Real User Monitoring (RUM) is pivotal in optimizing user experiences by providing granular insights into various aspects of application performance.
Understanding which metrics to monitor is essential for developers and product managers aiming to enhance both functionality and user satisfaction.
Core User Experience Metrics
User satisfaction hinges on seamless interaction with your application. Here are key metrics that directly relate to user satisfaction:
User Satisfaction Measures
- Page Load Times: Measures how long it takes for a page to become fully interactive, a direct factor influencing user satisfaction and bounce rates.
- Interaction Details: Tracks fine-grained interactions like clicks, scrolls, and keypresses, helping identify features that engage or frustrate users.
Example of Tracking Page Load Time
window.onload = function() { var loadTime = window.performance.timing.domInteractive - window.performance.timing.navigationStart; console.log('Page fully interactive at: ' + loadTime + 'ms'); };
This snippet helps developers understand the load performance, which is crucial for troubleshooting delays or poor user experience.
Monitoring Performance Indicators
To ensure that your application performs optimally, monitoring these performance indicators is crucial:
Critical Performance Indicators
- Latency: Measures the delay before data begins transferring to the user’s browser or app, indicating network or server issues.
- Traffic: Observes user traffic patterns to identify peak usage times and potential server overload.
- Errors: Tracks errors encountered by users to pinpoint bugs or failed interactions.
- Saturation: Assesses how much of the resource capacity (like CPU or memory) is used, which could impact performance.
Diversity of User Experiences
Understanding how your application performs across different platforms and locations is vital for global reach and accessibility.
Cross-Platform User Experience
- Devices and Browsers: Monitoring how your app performs on various devices and browsers ensures that no user segment faces disadvantages.
- Geographical Locations: Tracking performance across different regions helps identify if location-specific factors like CDN performance are affecting user experience.
By closely monitoring these metrics, you can ensure a high-quality experience for all users, regardless of their access points or locations. Real User Monitoring provides the insights necessary to make informed decisions that can lead to significant improvements in application performance and user satisfaction.
Choosing the Right RUM Solution
Selecting the appropriate Real User Monitoring (RUM) tool is crucial for effectively capturing and utilizing data to enhance user experience and application performance.
A well-chosen RUM solution not only provides deep insights into user interactions but also supports broader business and technical requirements.
Let’s explore the criteria and considerations that should guide your decision when choosing a RUM tool.
Key Criteria for Selecting RUM Tools
When evaluating potential RUM solutions, certain features and capabilities stand out as essential for deep and actionable insights.
Advanced Features
- Session Replay and Error tracking along with the ability to correlate each other are very important in understanding and troubleshooting issues.
- Comprehensive User Session Data: Ensure the tool captures detailed data on user sessions, including every click, scroll, and interaction, to form a complete picture of the user journey.
Example of AI in RUM
An AI-powered RUM tool might analyze user behavior patterns to identify unusual slowdowns or error rates, triggering alerts for teams to investigate further. This proactive approach can significantly reduce downtime and improve user satisfaction.
Considerations for Tool Scalability and Integration
A RUM solution should not only fit your current needs but also grow with your organization and technology stack.
Scalability and Flexibility
- Scalability: The tool should be able to handle increasing amounts of data and users as your application grows without losing performance. Platforms like OpenObserve, which is designed to work at petabyte scale, demonstrate robust scalability that could be crucial for large-scale operations.
- Flexibility: It should work seamlessly with new technologies and platforms as your tech stack evolves.
Integration Capabilities
- Third-party Integrations: A good RUM solution integrates smoothly with other tools in your observability and development ecosystem, such as APM (Application Performance Monitoring) tools, analytics platforms, and cloud services.
OpenObserve’s ability to serve as a seamless replacement for Elasticsearch highlights its integration capabilities, making it an excellent example of a flexible and adaptable RUM solution.\
Understanding User Experience Context
- Contextual Data: The tool should provide context for user actions, such as what happened before an error occurred or how performance issues vary between different user segments.
By incorporating these considerations, you can choose a RUM solution that not only fits well with your technical infrastructure but also enhances your ability to understand and improve the user experience across all touchpoints.
The right RUM tool will empower your teams to make data-driven decisions that optimize performance and foster user satisfaction, ensuring your digital products consistently meet and exceed user expectations.
To get started with OpenObserve, sign up today, or reach out to us and book a demo!
Best Practices for Real User Monitoring Implementation
1. Defining clear objectives for RUM and linking technical goals to business outcomes
2. Ensuring precise instrumentation and regular data review for continuous performance optimization
3. Monitoring across platforms and integrating RUM with application performance monitoring (APM) for a holistic view
Implementing Real User Monitoring (RUM) effectively requires a strategic approach that aligns technical monitoring with broader business objectives.
By following best practices, organizations can ensure that their RUM initiatives not only capture essential data but also drive meaningful improvements across their digital landscapes.
Defining Clear Objectives
The first step in a successful RUM implementation is to define clear and measurable objectives.
Understanding what you aim to achieve with RUM is crucial for tailoring the setup to your specific needs.
Linking Technical Goals to Business Outcomes
- Establish specific, measurable goals such as improving page load times by X% or reducing user dropout rates on key workflows.
- Connect these technical metrics to business outcomes, like increased customer satisfaction, higher conversion rates, or reduced support calls, to demonstrate the value of RUM investments to stakeholders.
Ensuring Precise Instrumentation
The accuracy of your RUM data depends on how well you instrument your applications.
Precise instrumentation helps in capturing the most relevant data without overwhelming the system or the analysis team.
Regular Data Review
- Implement a routine to regularly review the data collected through RUM to ensure it remains relevant and actionable.
- Use these insights to continuously optimize performance, such as adjusting resource allocation based on user load times and interaction patterns.
Holistic Monitoring Across Platforms
RUM should not operate in isolation. For a comprehensive understanding of application performance, it’s important to integrate RUM with other monitoring tools.
Integration with APM
- Combining RUM with Application Performance Monitoring (APM) provides a holistic view of both backend and frontend performance. This integration helps in pinpointing whether issues are arising from the client-side (frontend) or server-side (backend), facilitating more targeted troubleshooting.
- Monitor across different platforms (web, mobile, desktop) to ensure consistent performance and user experience regardless of the access point.
Example of Integrated Monitoring
Using a unified platform that supports both RUM and APM can simplify data correlation and analysis.
For instance, seeing that a spike in error rates detected by RUM correlates with a specific release can prompt immediate rollbacks or hotfixes.
By adhering to these best practices, you can ensure that your Real User Monitoring implementation is robust, insightful, and directly contributes to enhanced user experiences and business outcomes.
Accurate data collection, coupled with strategic analysis and integration with other monitoring tools, will provide the depth of insight needed to make informed decisions and maintain a competitive edge in application performance.
Conclusion
As technologies evolve, RUM's role in digital strategy becomes increasingly critical. Implementing RUM not only helps resolve immediate issues but also paves the way for anticipating user needs with upcoming innovations in AI and machine learning.
Continuously exploring and integrating RUM practices will ensure your digital platforms remain responsive and user-centric. Let's leverage RUM to its full potential, ensuring we consistently deliver superior digital experiences.
In essence, embracing RUM is about staying ahead, being proactive, and continually enhancing user engagement across all digital touchpoints.