Explore latest insights and updates
Set up OpenObserve Report Server to turn dashboards into scheduled PDF emails. Learn env vars, SMTP (Gmail/SES), and Docker run.
Learn how Prometheus metrics counts unique label values using basic queries and methods like `count(count by (label) (metric))`.
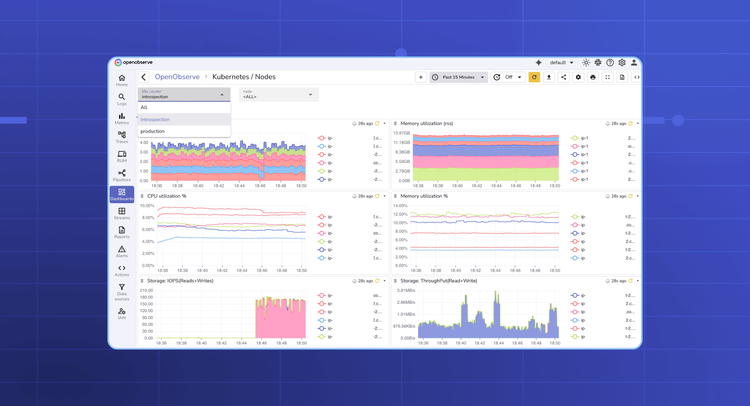
A practical guide to observability dashboards: what to track, how to design panels, and how to build them with examples for logs, metrics, and traces.
This guide explains OpenTelemery OTLP Exporters, provides an overview and setup with simple step-by-step instructions.
Learn how to collect HTTP metrics with Telegraf and send them to OpenObserve: copy‑paste configs, verification steps, and production best practices.
Learn how to design an enterprise observability strategy built on efficient logging, cost control, and unified insights to scale with complex systems.
Learn how to forward syslog-ng logs to OpenObserve using the openobserve-log() HTTP destination, test your pipeline, and tune batching, workers, and ports for production.
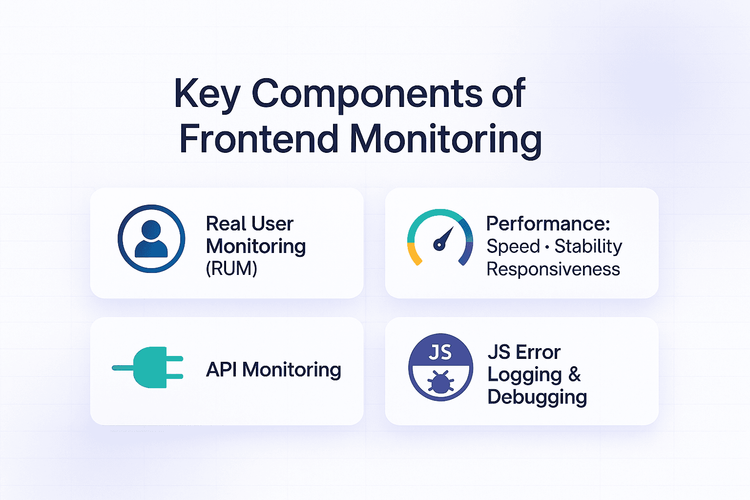
Learn frontend monitoring basics: RUM, performance metrics, error logging, and SEO impact. See how OpenObserve unifies monitoring in one platform.
Stream AWS Lambda logs to OpenObserve without CloudWatch. See setup, env vars, ARNs for x86/arm64, SQL queries, and troubleshooting for real-time observability.
Improve reliability and UX: 6 best practices for web app monitoring with OpenObserve: RED KPIs, RUM/API/infra, SQL alerts, continuous monitoring, DevOps.
Monitor Oracle Database performance with OpenTelemetry and OpenObserve. Collect metrics, logs, and build dashboards for real-time insights.
Master SLO-based alerting in OpenObserve. Easily set reliability targets, track error budgets, and cut alert noise with SQL-driven monitoring.
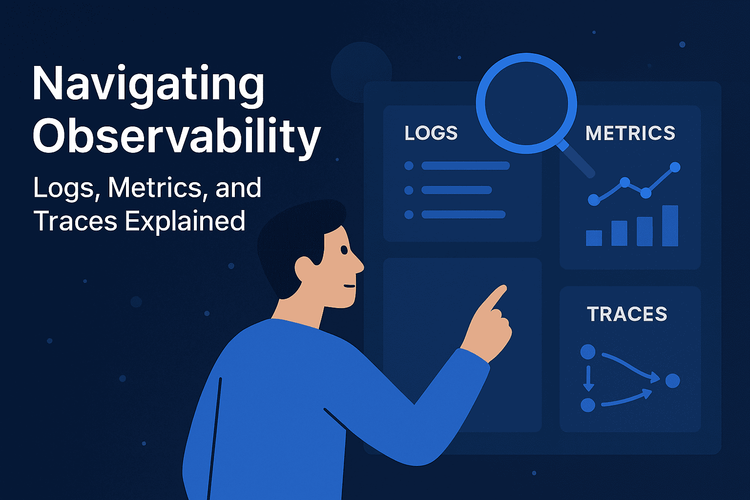
Learn how metrics, logs & traces work together to troubleshoot faster, reduce downtime and improve reliability in modern cloud-native apps.
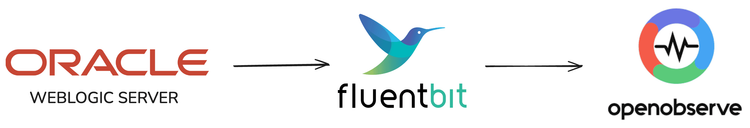
Send logs from Oracle WebLogic to OpenObserve for fast search, longer retention, and cost efficiency with minimal setup using Fluent Bit.
Send logs from Google Cloud Run to OpenObserve for fast search, longer retention, and lower costs, and using just a few lines of code.
OpenObserve is now available on AWS Marketplace! Discover how teams can streamline observability with faster deployment, simplified billing, and seamless integration within their AWS infrastructure.
Efficient log parsing with OpenObserve unlocks real-time analytics, troubleshooting, and alerting through VRL, flexible pipelines, and seamless ingestion.
How to send data from OpenObserve Pipelines to Splunk using the Splunk HTTP Event Collector (HEC) in 5 easy steps.
Avatar achieved SOC 2 compliance, improved uptime to 99.99%, and saved 60% on observability costs with OpenObserve's unified monitoring platform.
OpenObserve is transitioning to a fully usage-based pricing model effective June 2nd, 2025, eliminating minimum fees and the free tier. The new pay-as-you-go structure charges $0.30 per GB for log, metric, and trace ingestion, with additional fees for queries, pipelines, and advanced features like RUM and error tracking. Existing free-tier customers receive a 30-day exemption period, while current standard-tier customers will have their flat monthly fees removed after 30 days. New customers can access a 14-day free trial. The company emphasizes that their open-source version remains completely free for self-hosting, providing users with flexibility to choose between managed cloud services or self-managed deployments. This pricing change aims to create a more transparent, scalable cost structure that aligns charges with actual resource consumption while supporting OpenObserve's continued development and platform improvements.Description - OpenObserve announces usage-based pricing starting June 2025. Free tier ends, pay-as-you-go begins at $0.30/GB ingestion. 30-day transition period for existing users. Self-hosting remains free.
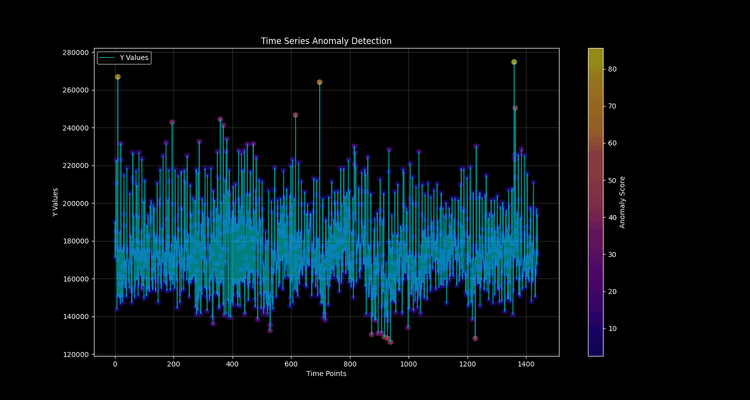
This comprehensive guide explains how to implement real-time anomaly detection using OpenObserve and the Random Cut Forest algorithm for time series data. Learn what anomaly detection is, how OpenObserve streamlines monitoring, and step-by-step instructions for setting up a robust anomaly detection system. Discover common challenges, troubleshooting tips, and best practices for scalable, cost-effective anomaly detection solutions.