OpenTelemetry
Quickly and easily instrument OpenTelemetry for metrics, logs, and traces.
Why use OpenObserve for OpenTelemetry?
Automatically route and transform all telemetry data through a unified OpenTelemetry collector with minimal configuration.
Instant Instrumentation
Deploy production-ready observability in minutes with zero-config scripts that automatically collect your telemetry data.
Intelligent Data Streaming
Automatically route and transform all telemetry data through a unified OpenTelemetry collector with minimal configuration.
Complete Observability
Get full-stack observability across your entire infrastructure with minimal configuration or maintenance overhead.
OpenObserve ♥️‘s OpenTelemetry
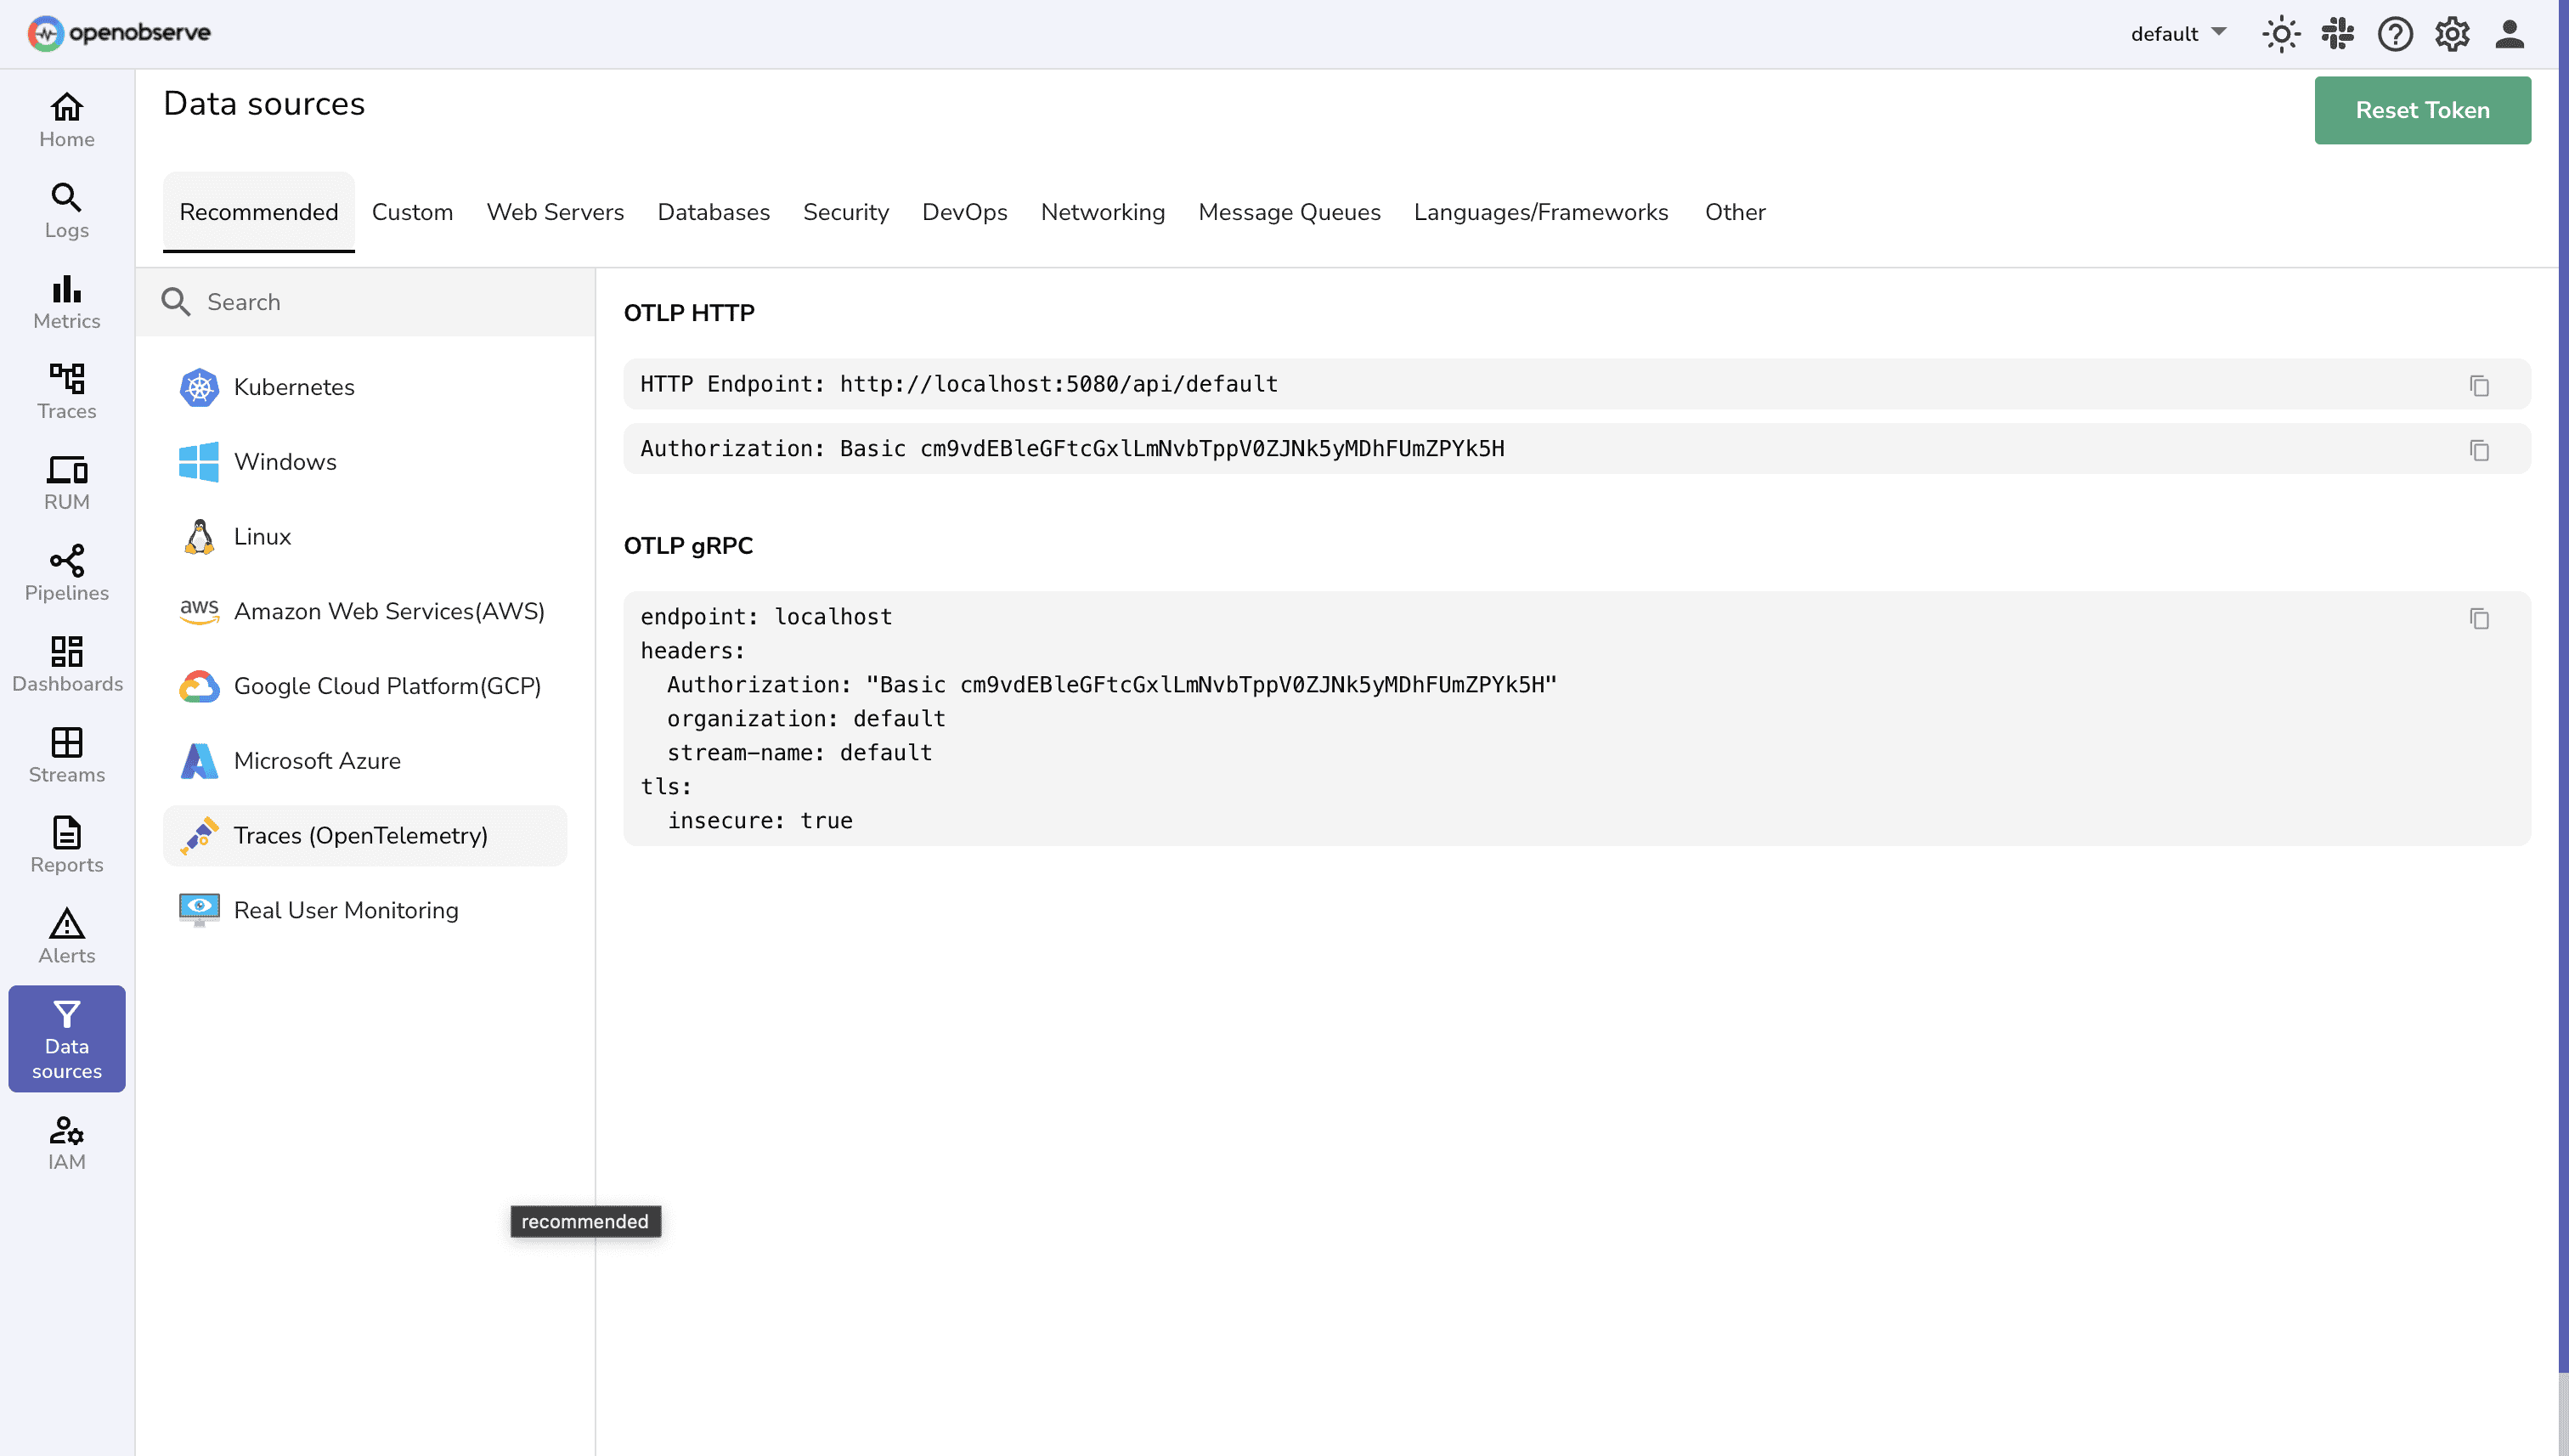
Data Collection
Flexible Integration Options
Deploy in minutes with your choice of standard OpenTelemetry instrumentation or our pre-configured collector for straightforward data ingestion.
Complete Signal Correlation
Capture and contextualize metrics, logs, and traces through a unified pipeline that preserves relationships between all telemetry signals.
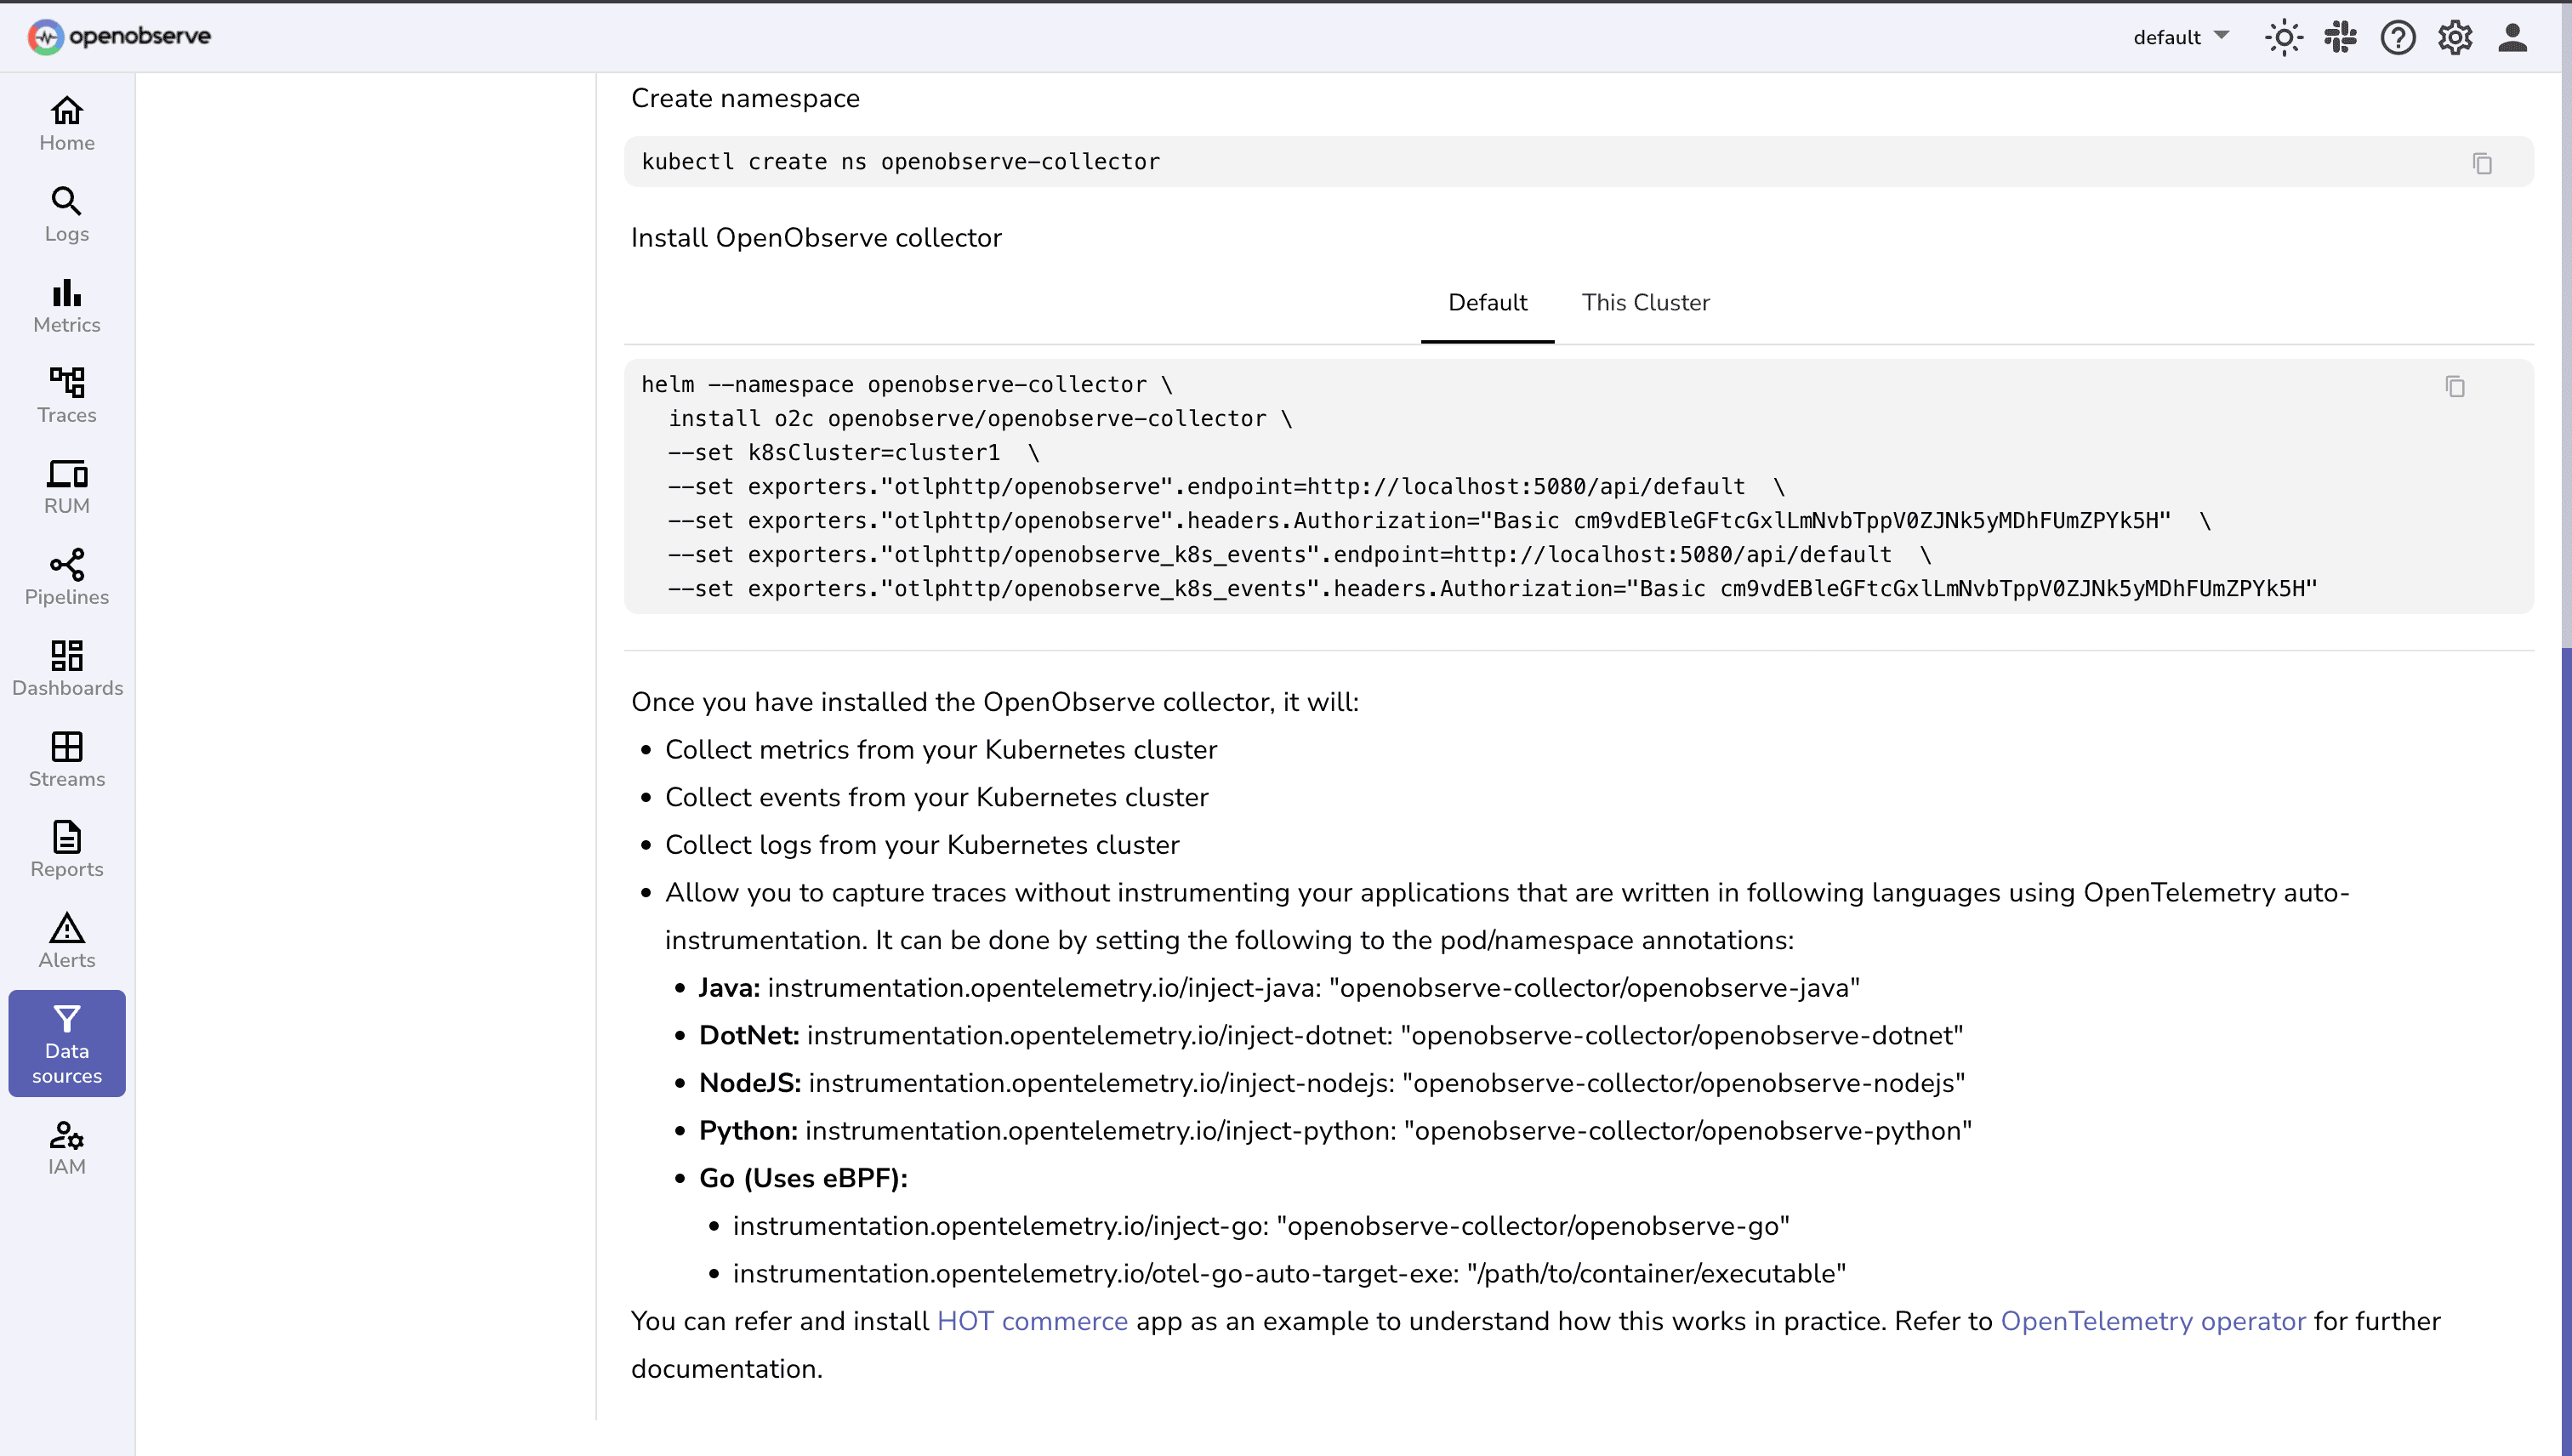
Instrumentation Options
Zero-Code Instrumentation
Enable distributed tracing instantly with automatic instrumentation for supported frameworks and libraries—no code changes required.
Precision Instrumentation
Implement custom instrumentation for granular insights with complete control over data collection and structure.
Data Processing
Universal Format Support
Process all OpenTelemetry data formats through native OTLP protocol integration with built-in conversions for industry-standard formats.
Powerful Query Flexibility
Unlock actionable insights using familiar SQL and PromQL with robust support for complex aggregations and time-series analysis.

Operational Insights
Real-Time Visibility
Monitor application and infrastructure metrics with real-time visibility into system health and performance.
Accelerated Root Cause Detection
Slash troubleshooting time by following distributed traces across services, identifying exactly where and why requests slow down.
OpenTelemetry Integration FAQs
Ready to get started?
Try OpenObserve today for more efficient and performant observability.