End-to-End Guide: Configuring and Monitoring Zookeeper with OpenTelemetry Receiver

Chaitanya Sistla
December 24, 2024
3 min read
Don’t forget to share!
Try OpenObserve Cloud today for more efficient and performant observability.
Apache Zookeeper is a centralized service for maintaining configuration information, naming, providing distributed synchronization, and group services. Monitoring Zookeeper is critical to ensure its availability and performance. In this guide, we will install Zookeeper on Ubuntu, configure the OpenTelemetry (OTel) Contrib Receiver for Zookeeper metrics, and visualize the metrics in OpenObserve by creating meaningful dashboards.
Monitoring Zookeeper is crucial for the following reasons:
sudo apt update && sudo apt upgrade -y
sudo apt install openjdk-11-jdk -y
java -version
wget https://dlcdn.apache.org/zookeeper/zookeeper-3.9.3/apache-zookeeper-3.9.3-bin.tar.gz
tar -xvzf apache-zookeeper-3.9.3-bin.tar.gz
sudo mv apache-zookeeper-3.9.3-bin /usr/local/zookeeper
zoo.cfg:sudo touch /usr/local/zookeeper/conf/zoo.cfg
tickTime=2000
dataDir=/opt/zookeeper/data
clientPort=2181
maxClientCnxns=60
4lw.commands.whitelist=mntr,ruok,conf,envi,stat
sudo mkdir -p /var/lib/zookeeper
/opt/zookeeper/bin/zkServer.sh start
/opt/zookeeper/bin/zkServer.sh status
wget https://github.com/open-telemetry/opentelemetry-collector-releases/releases/download/v0.116.1/otelcol-contrib_0.116.1_linux_amd64.deb
sudo dpkg -i otelcol-contrib_0.116.1_linux_amd64.deb
sudo vi /etc/otelcol-contrib/config.yaml
Add the following configuration:
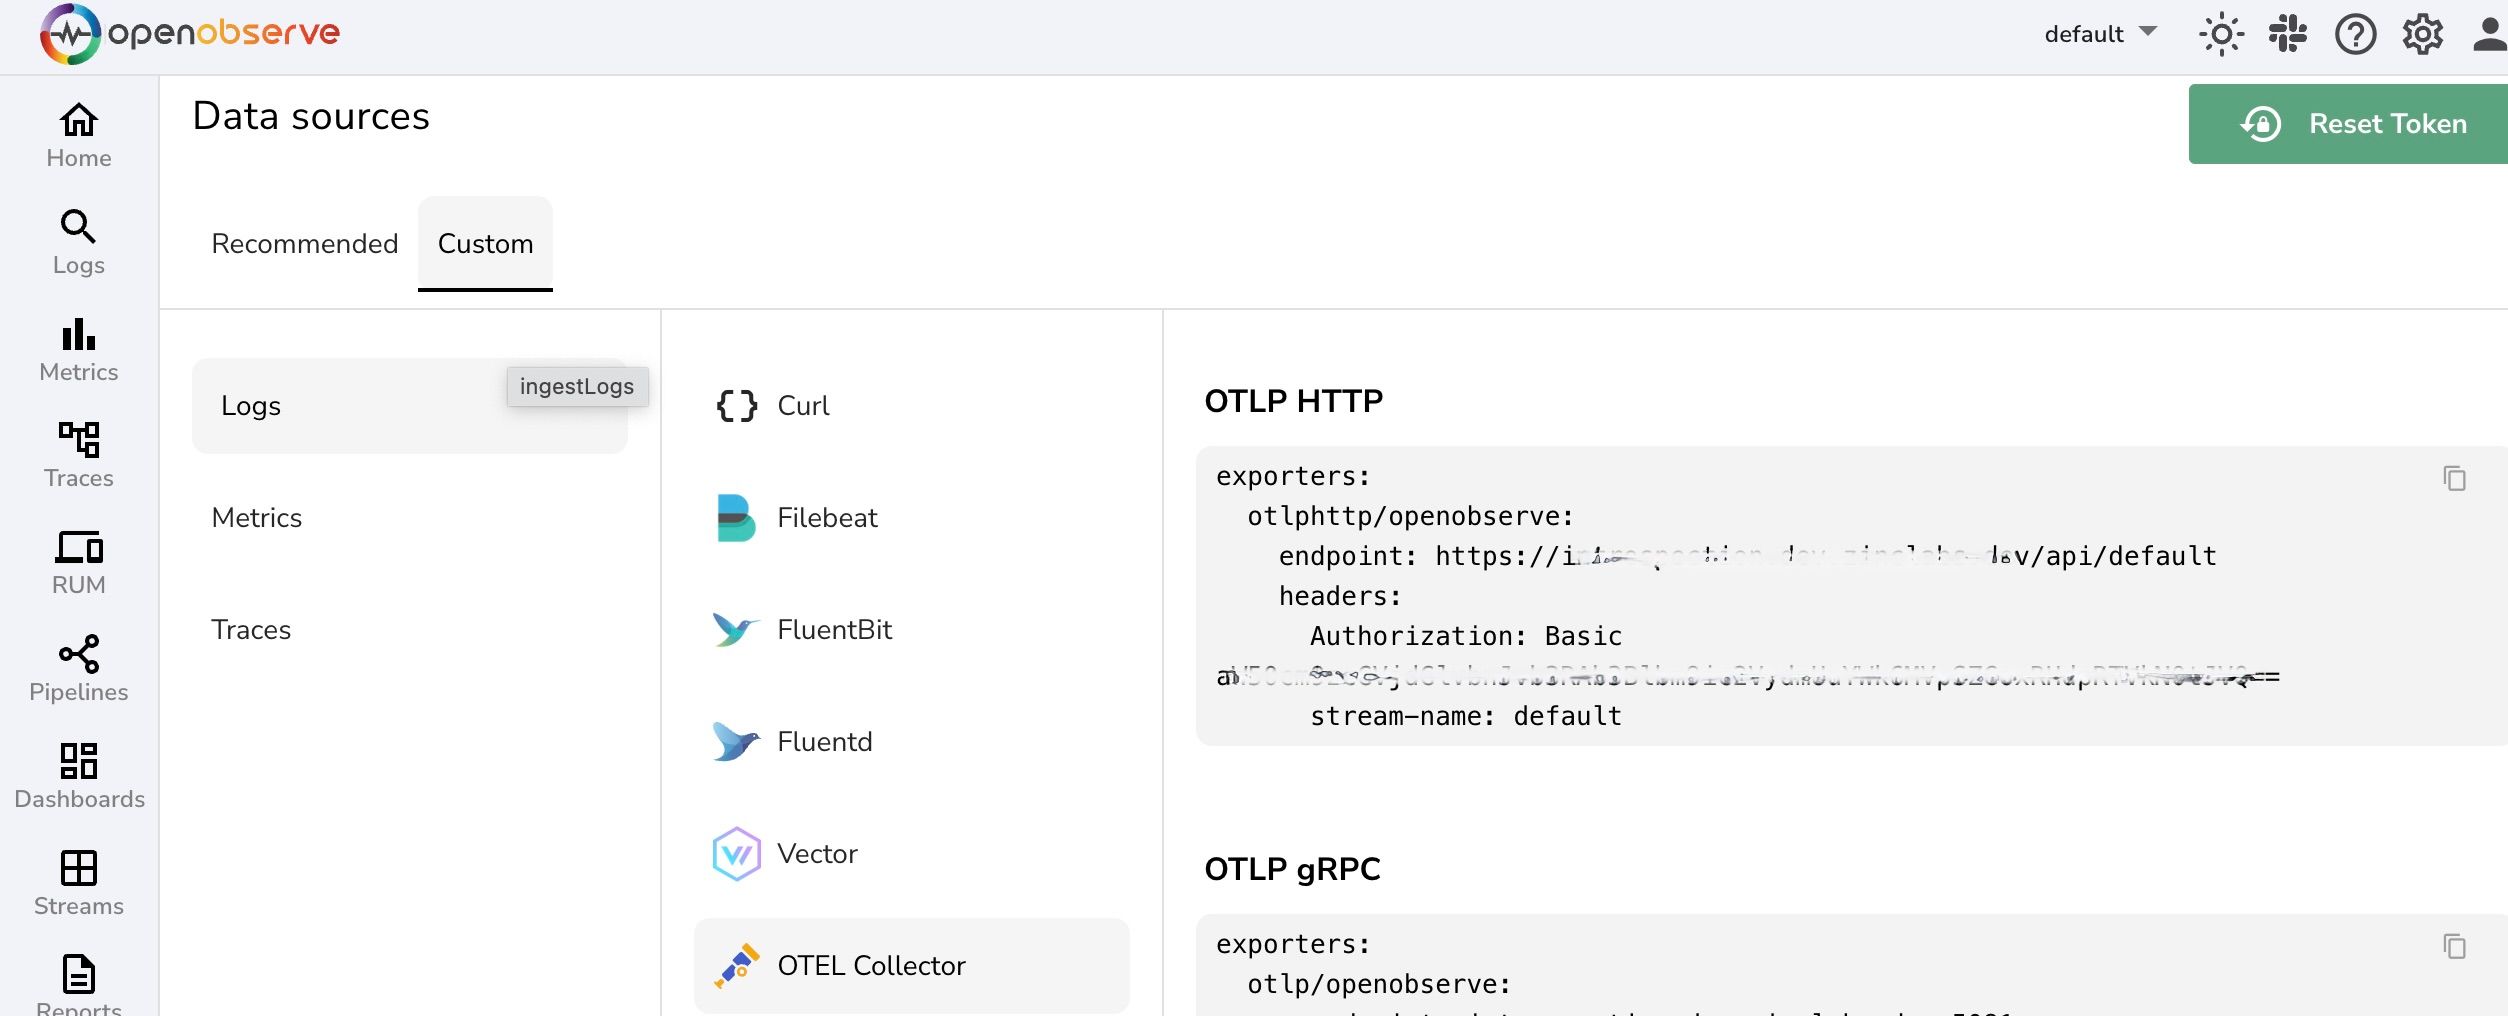
Make sure to replace OPENOBSERVE_ENDPOINT, OPENOBSERVE_TOKEN and OPENOBSERVE_STREAM with your platform's details that are found within OpenObserve data sources section.
receivers:
  zookeeper:
    endpoint: "localhost:2181"

exporters:
  otlphttp/openobserve:
    endpoint: OPENOBSERVE_ENDPOINT
    headers:
      Authorization: OPENOBSERVE_TOKEN
      stream-name: OPENOBSERVE_STREAM

service:
  pipelines:
    metrics:
      receivers: [zookeeper]
      exporters: [otlphttp/openobserve]
sudo systemctl start otelcol-contrib
sudo systemctl status otelcol-contrib
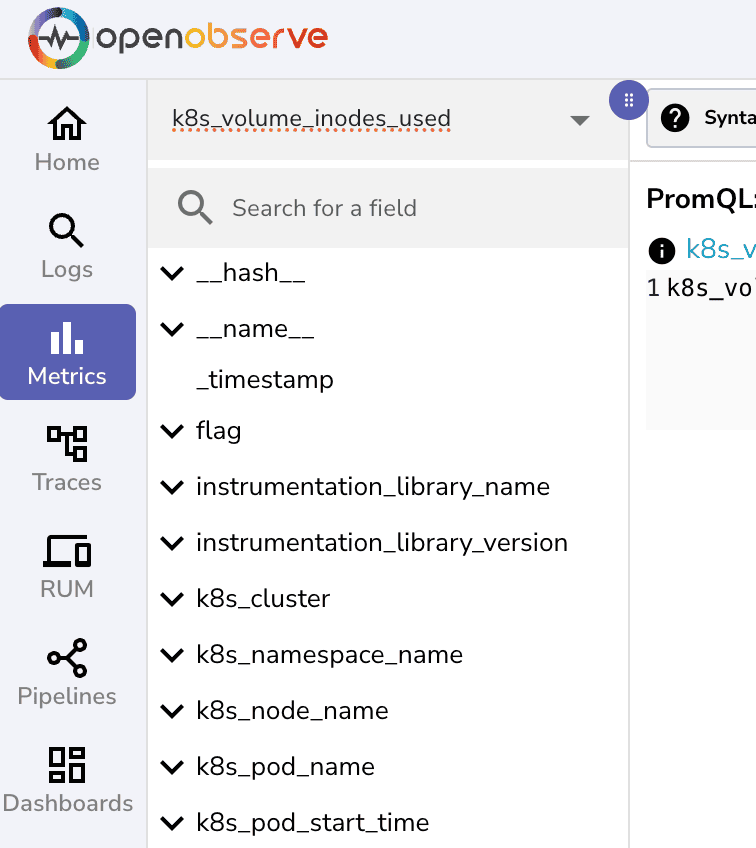
Go to OpenObserve dashboard -> metrics and search for zookeeper
By following this guide, you’ve successfully set up Apache Zookeeper on Ubuntu, configured the OpenTelemetry Contrib Receiver for metrics ingestion, and built insightful dashboards in OpenObserve. These steps provide a robust monitoring solution for your Zookeeper cluster, ensuring better observability and reliability.
For additional customizations, you can expand the dashboards to include latency, disk I/O, and other critical metrics using OpenTelemetry and OpenObserve.
Chaitanya Sistla is a Principal Solutions Architect with 17X certifications across Cloud, Data, DevOps, and Cybersecurity. Leveraging extensive startup experience and a focus on MLOps, Chaitanya excels at designing scalable, innovative solutions that drive operational excellence and business transformation.