Azure Monitoring
Gain deep insights into your cloud infrastructure performance, troubleshoot issues efficiently, and optimize your operations.

Why Use OpenObserve for Azure Monitoring?
Deep Azure Observability
Gain deep visibility into the many layers of your Azure environment for faster troubleshooting and proactive issue prevention.
Telemetry Cost Optimization
Slash Azure telemetry storage costs with OpenObserve’s efficient compression and retention.
Almost Too-easy Integration
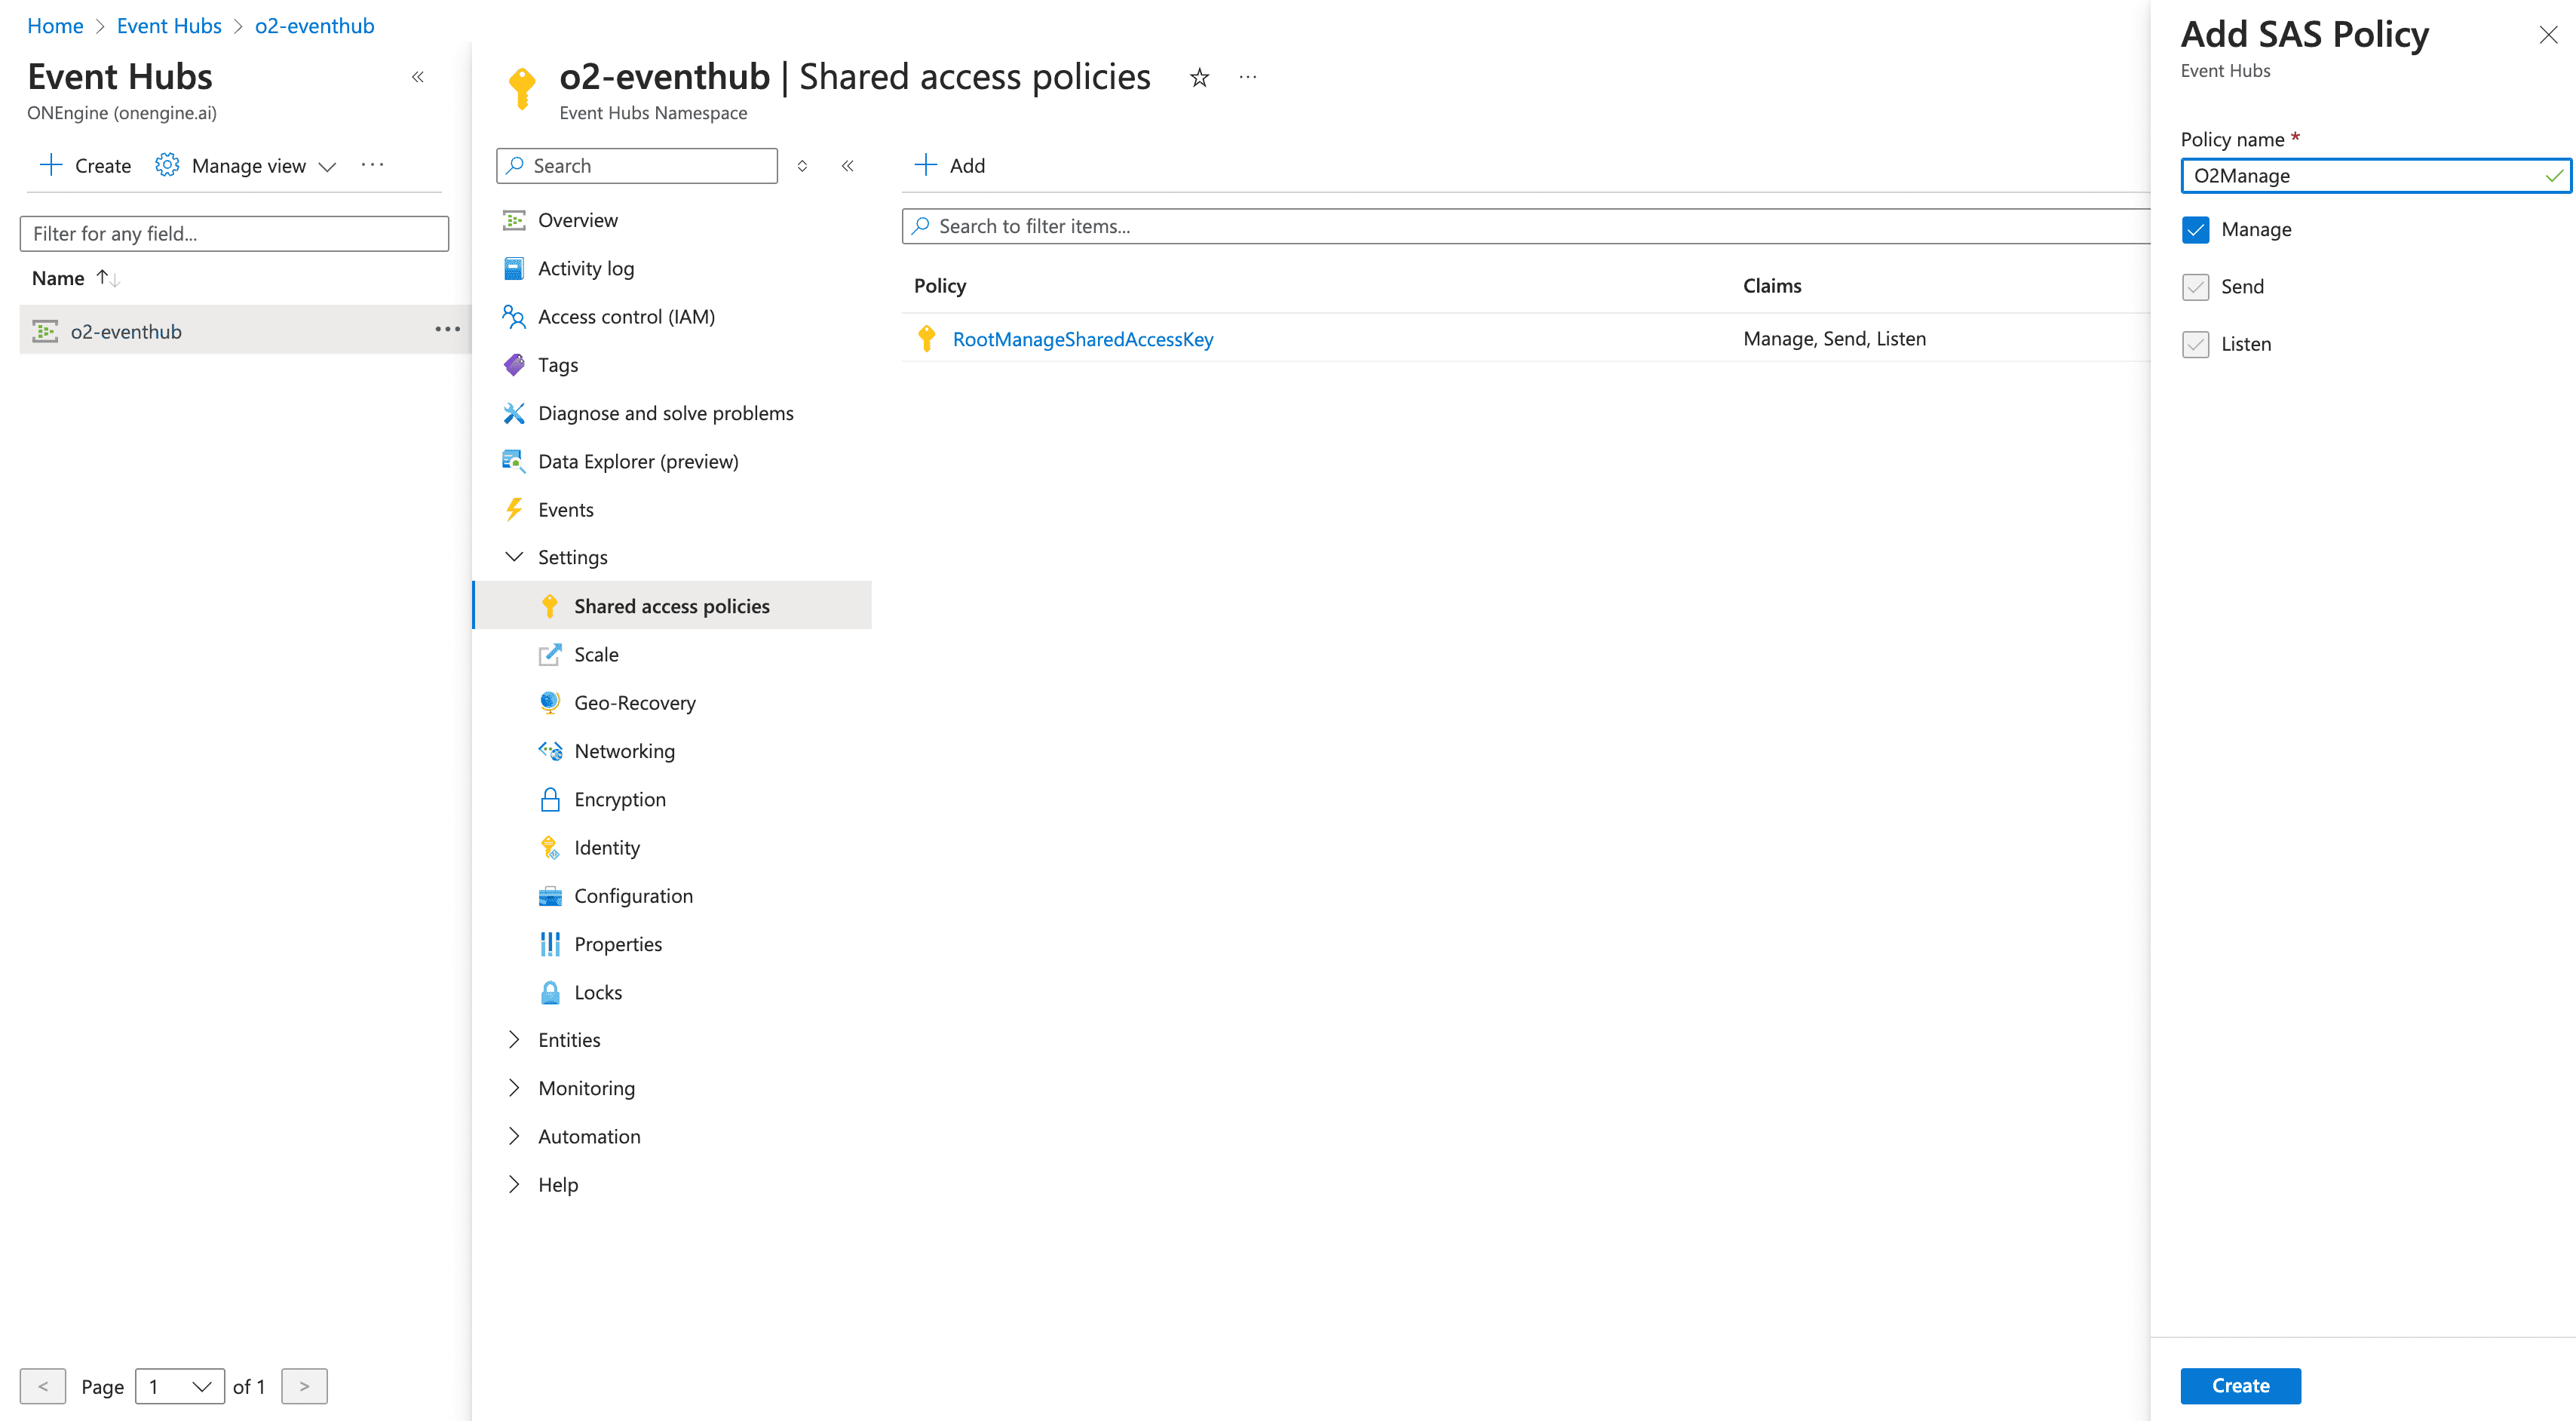
Effortlessly monitor your Azure services with Azure Monitor Diagnostic Settings and Event Hubs exports.
OpenObserve’s Key Azure Monitoring Capabilities
Real-Time Visibility & Insights
Continuous Data Collection
Capture every Azure signal as it happens through Event Hubs, Diagnostic Settings, and Azure Monitor integrations. Monitor your entire cloud environment with zero blind spots, maintaining complete visibility across all resources.
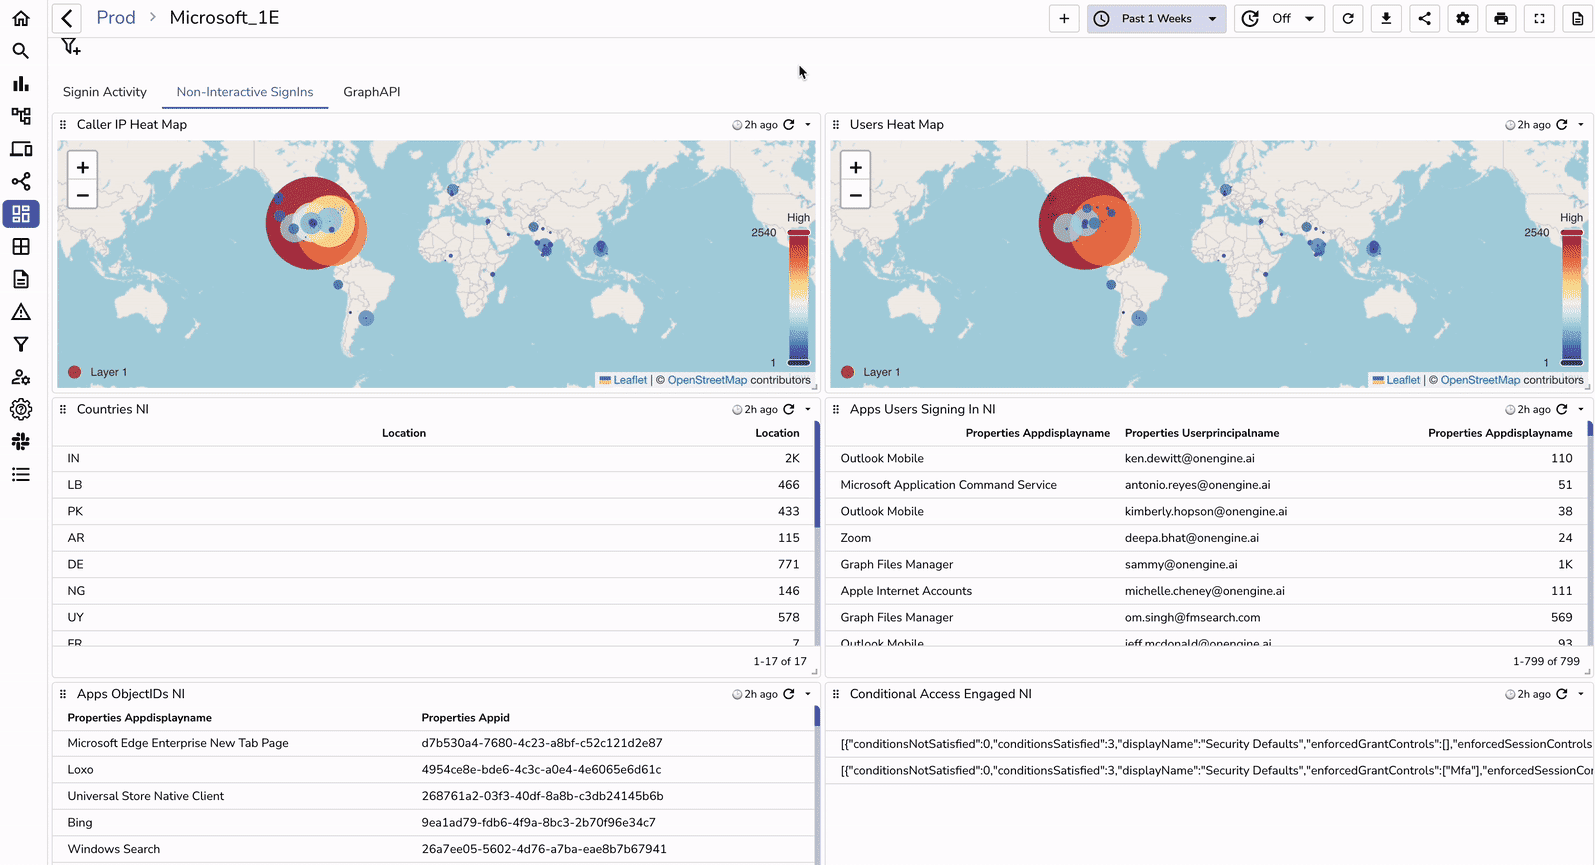
Prebuilt Dashboards
Instantly grok Azure metrics with ready-to-use and customizable visualizations. Spot trends, identify anomalies, and make decisions with confidence using real-time, interactive dashboards.
Efficient Data Processing
Automated Log Parsing
Turn raw Azure logs into structured insights using Vector Remap Language (VRL). Parse, enrich, and transform chaotic data into clear insights without complex coding or configuration.
Advanced Query Capabilities
Unlock hidden patterns in your Azure environment using SQL queries.
Service Coverage & Integration
Multi-service Support
Monitor your entire Azure ecosystem with specialized tooling for every service. Track network traffic with NSG Flow Logs, audit activities with Azure Activity Log, and gain complete visibility across your infrastructure.
Unified Analytics
Connect insights across multiple Azure services with powerful SQL queries. Correlate events and metrics to reveal the true story behind incidents, dramatically reducing mean time to resolution.
Cost-Effective Monitoring
Resource Usage Tracking
Optimize cloud spending with resource monitoring across VMs, Azure SQL Databases, Functions, and more. Convert usage data into action plans that eliminate waste while maintaining performance.
Efficient Storage
Store your data with flexible retention policies. Balance historical insights with infrastructure costs, maintaining complete visibility without unnecessary expense.
Azure Monitoring FAQs
Ready to get started?
Try OpenObserve today for more efficient and performant observability.