Explore latest insights and updates
Learn how to set up logs, metrics, and traces for a new microservice in under 30 minutes. A step-by-step guide to achieving full observability quickly and efficiently.
Learn how OpenObserve's RUM module automatically detects rage clicks, dead clicks, and error clicks turning invisible UX pain into actionable signals you can see in session replays, query with SQL, and alert on.
Complete guide to AI anomaly detection in observability. Discover how machine learning algorithms detect unusual patterns, handle seasonality, and catch issues traditional thresholds miss.
When the OpenChoreo team needed an observability backend for their CNCF sandbox Internal Developer Platform, they chose OpenObserve. Here's why and what it means for Kubernetes teams everywhere.
Learn how to monitor autonomous AI agents in production using observability best practices. Track agent behavior, logs, traces, and performance with tools like OpenTelemetry to ensure reliability, transparency, and control at scale.
Learn how to implement distributed tracing in a Java Spring Boot microservices application using the OpenTelemetry Java Agent and OpenObserve. Covers zero-code auto-instrumentation, JVM metrics, cross-service trace propagation, flamegraphs, and Gantt charts , with working source code and curl examples.
Explore how OpenObserve detects anomalies in logs, metrics, and traces to help SREs identify issues early and take action before incidents escalate.
Learn how AI-assisted monitoring using MCP enhances observability with intelligent alerts, anomaly detection, and automated insights for faster incident response.
Discover powerful open source tools for LLM observability. Track prompts, analyze outputs, reduce latency, and improve reliability of your AI applications.
Learn how to implement structured logging in production. Improve debugging, searchability, and observability with best practices and real-world examples.
Discover 15 essential SRE tools in 2026 for monitoring, alerting, tracing, and incident response. Compare top platforms to improve reliability and reduce downtime.
Discover how AI incident management transforms production operations by reducing MTTR by 90%, automating root cause analysis, and cutting alert noise by 80%. Learn how log clustering, trace correlation, and LLM-powered RCA work
Struggling with SLOs? Learn how to set meaningful Service Level Objectives that reflect real user impact. Avoid common mistakes, define better SLIs, and build effective SLO-based alerting.
Discover how AIOps transforms IT operations with AI-powered anomaly detection, event correlation, and automated remediation. Learn the core capabilities, use cases, and how observability data drives intelligent operations.
Learn how to measure and dramatically reduce Mean Time to Resolution (MTTR) using AI-powered observability. Discover the four phases that inflate MTTR and how modern teams achieve faster incident resolution with intelligent detection, triage, diagnosis, and remediation
We rewrote the XDrain log pattern extraction algorithm in Rust, achieving 40x performance improvements over Python. Learn how we used prefix trees, systematic sampling, and memory-bounded LRU caches to process 361,000 logs/sec in real-time.
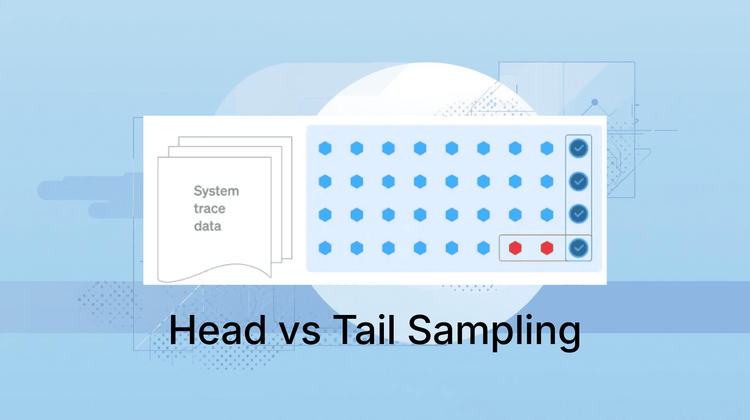
Learn the difference between head-based and tail-based sampling in observability. Compare pros, cons, and use cases to choose the right strategy for tracing.
Learn what the Prometheus cardinality bomb is, why high-cardinality metrics break your monitoring, and how to detect, prevent, and fix it effectively.
Struggling with alert fatigue? Learn how to reduce noisy alerts, improve signal quality, and build effective alerting strategies that actually help teams respond faster.
Explore the top observability tools and platforms in 2026. Compare features, use cases, and alternatives to Datadog for logs, metrics, and traces in this complete guide.
AI Assistant and LLM Observability are now live on OpenObserve Cloud. v0.70.0 brings a rebuilt Service Graph, visual query builder, Incident Timeline, and more.