Monitoring GitHub Metrics in Real-Time with OpenTelemetry and OpenObserve

Chaitanya Sistla
April 03, 2025
6 min read
Don’t forget to share!
Try OpenObserve Cloud today for more efficient and performant observability.
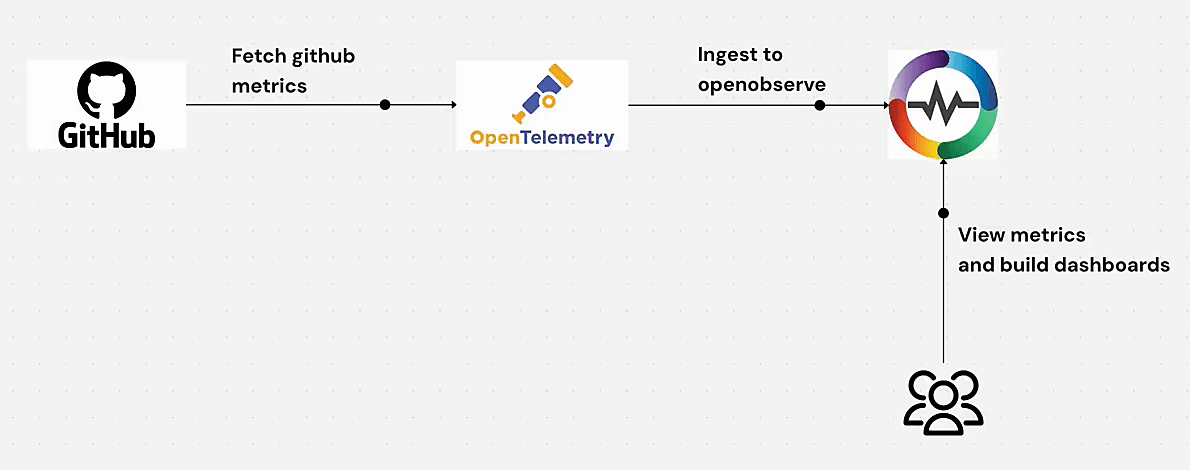
Are you looking to gain deeper insights into your GitHub repository activities? In this comprehensive guide, we'll walk through how to set up an end-to-end monitoring solution using OpenTelemetry Collector and OpenObserve to track GitHub metrics for better development analytics.
Software development teams rely heavily on GitHub for version control and collaboration. But how do you monitor and analyze GitHub activities across your organization effectively? This is where OpenTelemetry and OpenObserve come in.
In this tutorial, we'll demonstrate how to:
This solution provides real-time monitoring of your GitHub repositories, including private repos and PR activities - giving you valuable insights into your development workflow.
The first step is to install the OpenTelemetry Collector Contrib package, which includes the GitHub receiver:
wget https://github.com/open-telemetry/opentelemetry-collector-releases/releases/download/v0.123.1/otelcol-contrib_0.123.1_linux_amd64.deb
sudo dpkg -i otelcol-contrib_0.123.1_linux_amd64.deb
This installs the collector as a system service that can be managed via systemctl.
Next, we need to configure the collector to scrape GitHub metrics and send them to OpenObserve. Open the configuration file:
sudo vi /etc/otelcol-contrib/config.yaml
Replace the content with the following configuration:
extensions:
    bearertokenauth/github:
        token: <PAT> # Replace with your GitHub Personal Access Token

receivers:
    github/private-repo:
        initial_delay: 1s
        collection_interval: 60s
        scrapers:
            scraper:
                #metrics:  #Optional
                #vcs.contributor.count:
                # enabled: true
        github_org: <Your Org>
        search_query: "org:<Your Org> is:private"
        auth:
            authenticator: bearertokenauth/github

    github/pr-open:
        initial_delay: 1s
        collection_interval: 60s
        scrapers:
            scraper:
                #metrics:  #Optional
                #vcs.contributor.count:
                # enabled: true
        github_org: <Your Org>
        search_query: "org:<Your Org> is:pr is:open"
        auth:
            authenticator: bearertokenauth/github

exporters:
    otlphttp/openobserve:
        endpoint: OPENOBSERVE_ENDPOINT
        headers:
            Authorization: Basic <token> # Replace with your OpenObserve Basic auth token

service:
    extensions: [bearertokenauth/github]
    telemetry:
        logs:
            level: debug
    pipelines:
        metrics:
            receivers: [github/private-repo, github/pr-open]
            exporters: [otlphttp/openobserve]
github/private-repo: Collects metrics from private repositoriesgithub/pr-open: Tracks open pull requestsImportant: Replace
<PAT>with your GitHub Personal Access Token and<token>with your OpenObserve Basic auth token. Also ensure your OpenObserve stream is set to github to be able to import the prebuilt dashboard.
After configuring the collector, restart the service to apply the changes:
sudo systemctl restart otelcol-contrib
Verify that the service is running correctly:
sudo systemctl status otelcol-contrib
You should see output indicating that the collector is running without errors. If there are issues, check the logs:
sudo journalctl -u otelcol-contrib -f
Once the collector is running, it will start sending GitHub metrics to your OpenObserve instance. To view these metrics:
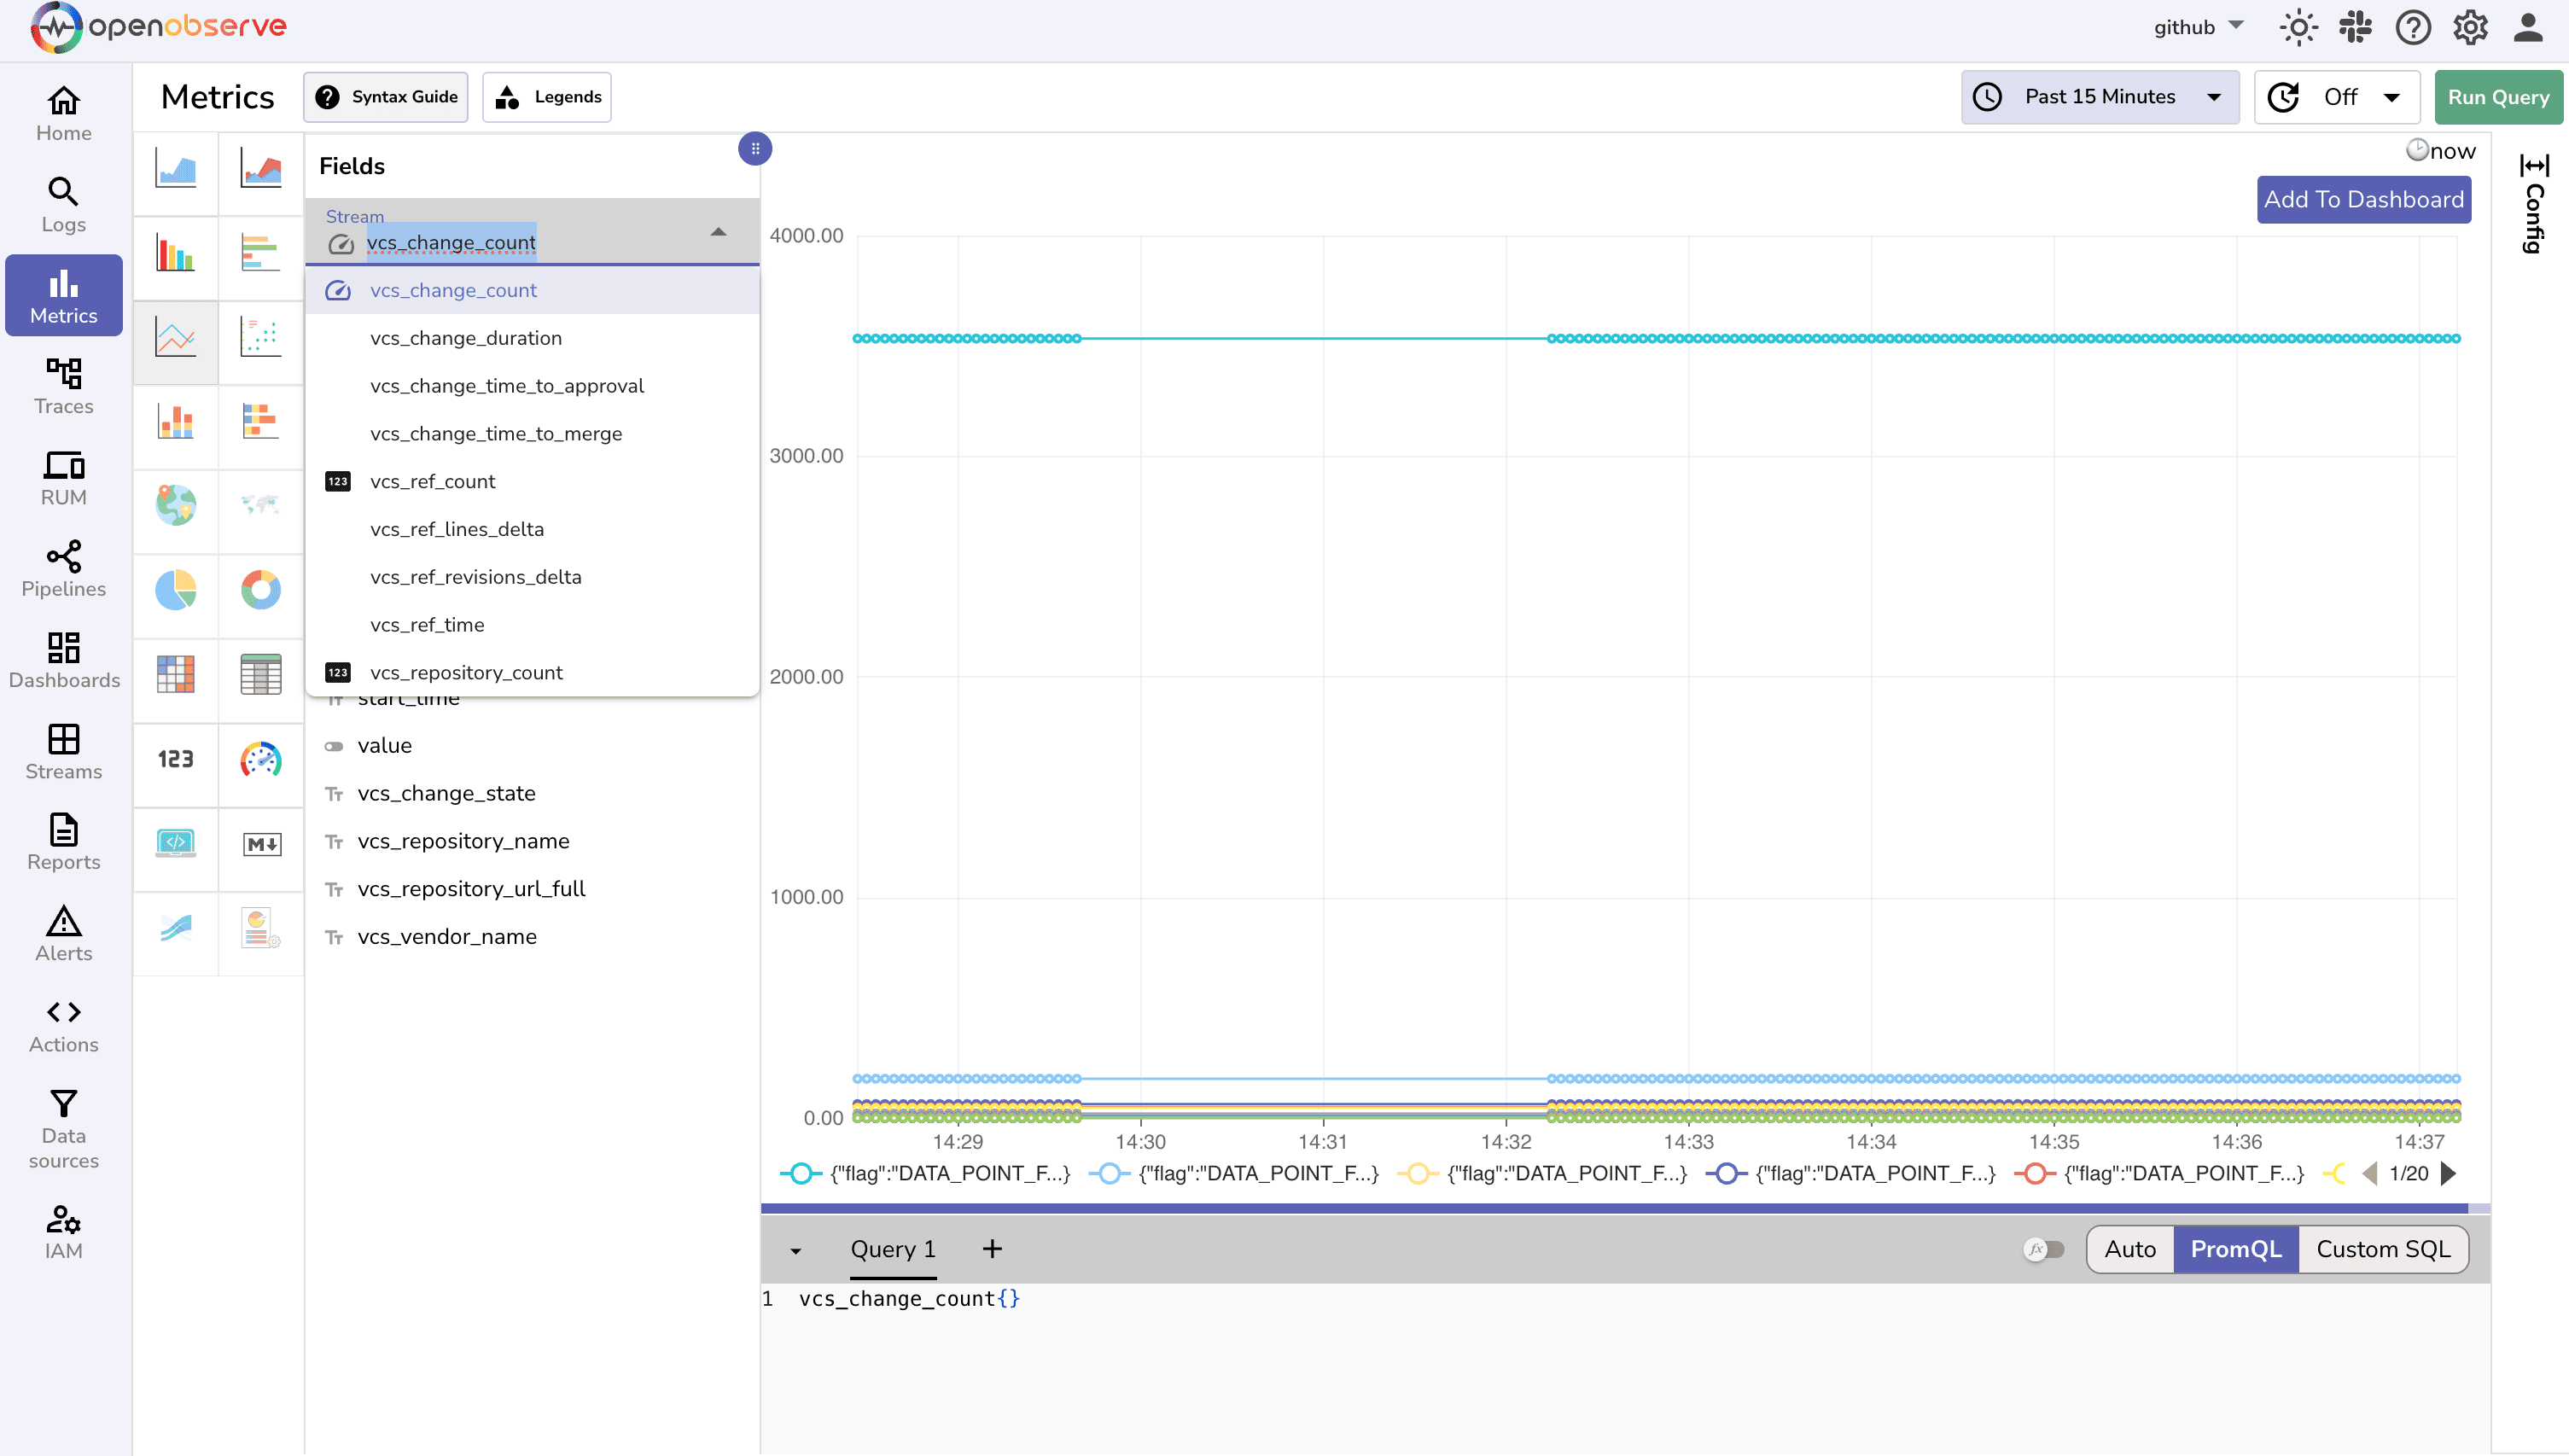
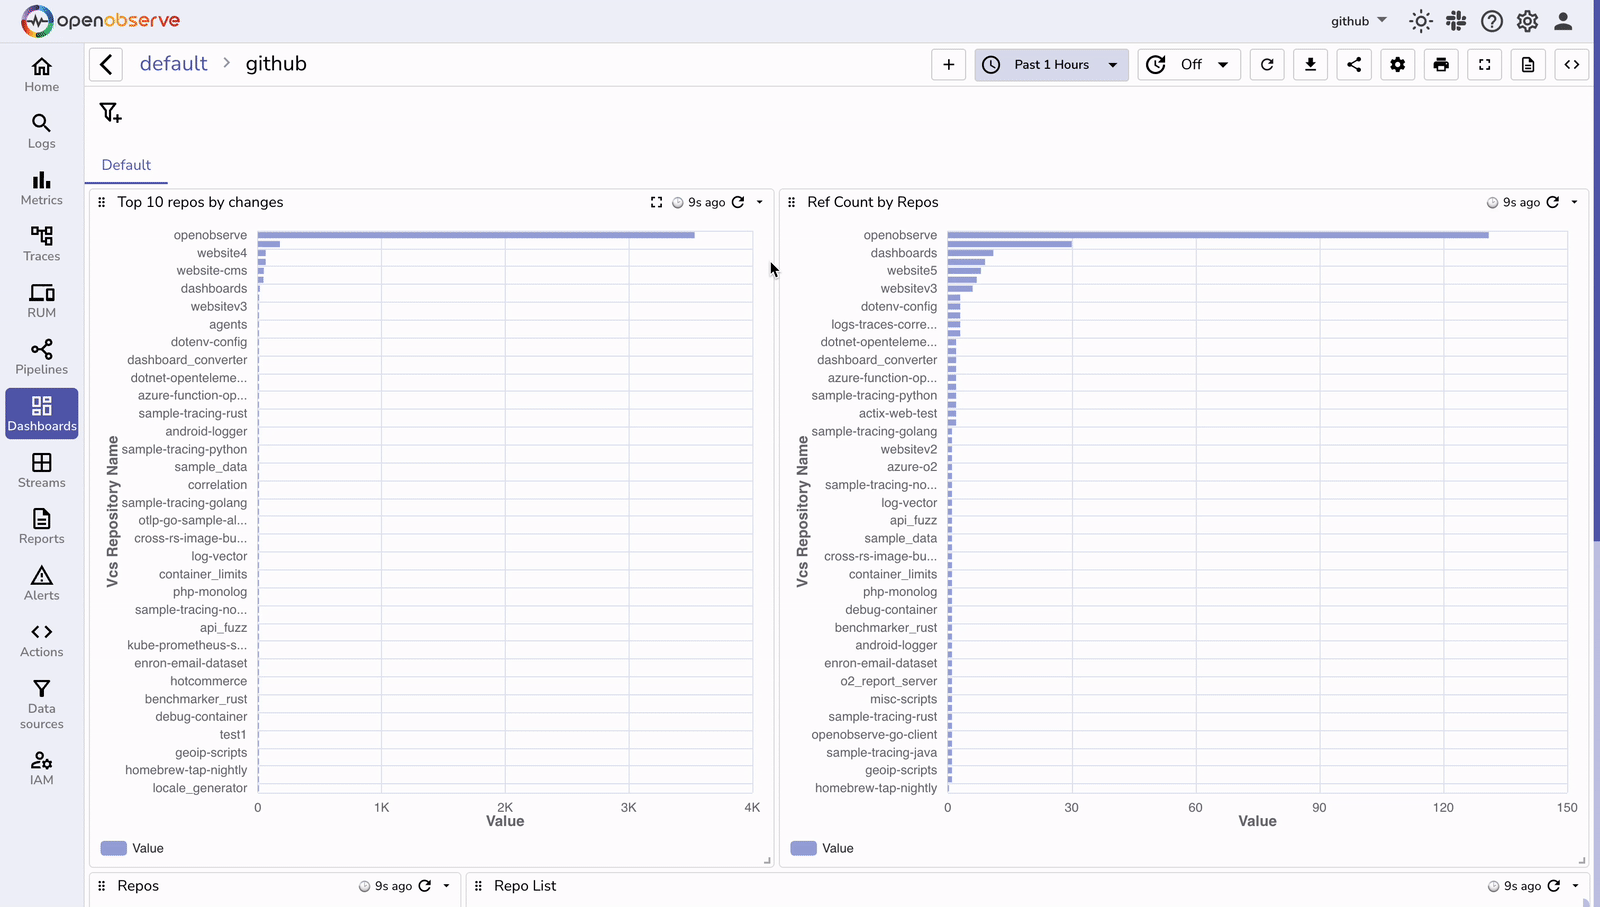
To get the most out of your GitHub metrics, import the pre-built dashboard into OpenObserve:
The pre-built dashboard provides visualizations for:
The GitHub receiver collects a wide range of metrics, including:
These metrics provide valuable insights into your development process, team productivity, and code quality.
Monitor how quickly your team is moving by tracking:
Keep an eye on code quality indicators:
Understand how your team works together:
You can modify the search_query parameter to filter specific repositories:
search_query: "org:<YOUR_ORG> repo:<YOUR_REPO> is:private"
For more or less frequent updates, modify the collection_interval:
collection_interval: 300s # Collect every 5 minutes
Uncomment and modify the metrics section to enable only specific metrics:
metrics:
    vcs.contributor.count:
        enabled: true
    vcs.pull_request.open:
        enabled: true
If you're not seeing data in OpenObserve:
sudo journalctl -u otelcol-contrib -fGitHub API has rate limits. If you hit these limits:
collection_interval to reduce API callsSetting up GitHub metrics monitoring with OpenTelemetry and OpenObserve provides valuable insights into your development process. By following this guide, you've created an end-to-end monitoring solution that helps you understand your GitHub activity better.
This monitoring setup can help you identify bottlenecks in your development process, track team productivity, and ensure code quality standards are maintained.
Ready to take your GitHub metrics monitoring to the next level? Consider expanding your telemetry by integrating with CI/CD systems and code quality tools for a complete view of your development pipeline.
Get Started with OpenObserve Today!
Sign up for a free trial of OpenObserve on our website. Check out our GitHub repository for self-hosting and contribution opportunities.
Happy monitoring!
Chaitanya Sistla is a Principal Solutions Architect with 17X certifications across Cloud, Data, DevOps, and Cybersecurity. Leveraging extensive startup experience and a focus on MLOps, Chaitanya excels at designing scalable, innovative solutions that drive operational excellence and business transformation.