Comprehensive Guide to Monitoring Kafka Metrics with OpenTelemetry Collector

Chaitanya Sistla
March 12, 2025
5 min read
Don’t forget to share!
Try OpenObserve Cloud today for more efficient and performant observability.
Apache Kafka is a widely used distributed event streaming platform that requires robust monitoring for optimal performance and reliability. OpenTelemetry (OTel) provides an open-source observability framework, and the otelcol-contrib (OpenTelemetry Collector Contrib) is an extended version that includes various receivers and exporters. In this guide, we will set up Kafka monitoring using OpenTelemetry Collector Contrib and export the metrics to OpenObserve for visualization.
Monitoring Kafka is essential for maintaining system health, ensuring data integrity, and optimizing performance. Here are key reasons why Kafka monitoring is critical:
By integrating OpenTelemetry Collector Contrib, we gain deeper insights into Kafka performance, message throughput, consumer lag, and topic health.
To begin, install Kafka on your system:
For a more detailed setup, you can follow kafka documentation.
sudo apt update && sudo apt upgrade -y
sudo apt install openjdk-11-jdk -y
java -version
wget https://dlcdn.apache.org/kafka/3.9.0/kafka_2.13-3.9.0.tgz
tar -xzf kafka_2.13-3.9.0.tgz
cd kafka_2.13-3.9.0
Start ZooKeeper and Kafka services:
bin/zookeeper-server-start.sh config/zookeeper.properties &
bin/kafka-server-start.sh config/server.properties &
To verify if Kafka is running correctly, execute the following command:
bin/kafka-broker-api-versions.sh --bootstrap-server localhost:9092
If Kafka is correctly set up, you should see a list of supported API versions.
Create multiple test Kafka topics to simulate different use cases:
bin/kafka-topics.sh --create --topic quickstart-events-1 --partitions 3 --bootstrap-server localhost:9092
bin/kafka-topics.sh --create --topic quickstart-events-2 --partitions 10 --bootstrap-server localhost:9092
bin/kafka-topics.sh --create --topic quickstart-events-3 --partitions 16 --bootstrap-server localhost:9092
bin/kafka-topics.sh --create --topic openobserve --partitions 2 --bootstrap-server localhost:9092
bin/kafka-topics.sh --create --topic quickstart-events --bootstrap-server localhost:9092
To confirm the topics were created successfully, run:
bin/kafka-topics.sh --list --bootstrap-server localhost:9092
Download and install the OpenTelemetry Collector Contrib package:
wget https://github.com/open-telemetry/opentelemetry-collector-releases/releases/download/v0.116.1/otelcol-contrib_0.116.1_linux_amd64.deb
sudo dpkg -i otelcol-contrib_0.116.1_linux_amd64.deb
Edit the configuration file:
sudo vi /etc/otelcol-contrib/config.yaml
Add the following content to configure the Kafka metrics receiver and OpenObserve exporter:
receivers:
  kafkametrics:
    brokers: localhost:9092
    protocol_version: 2.0.0
    scrapers:
      - brokers
      - topics
      - consumers
      - producer
      - messages

exporters:
  otlphttp/openobserve:
    endpoint: OPENOBSERVE_ENDPOINT
    headers:
      Authorization: OPENOBSERVE_TOKEN
      stream-name: OPENOBSERVE_STREAM

service:
  pipelines:
    metrics:
      receivers: [kafkametrics]
      exporters: [otlphttp/openobserve]
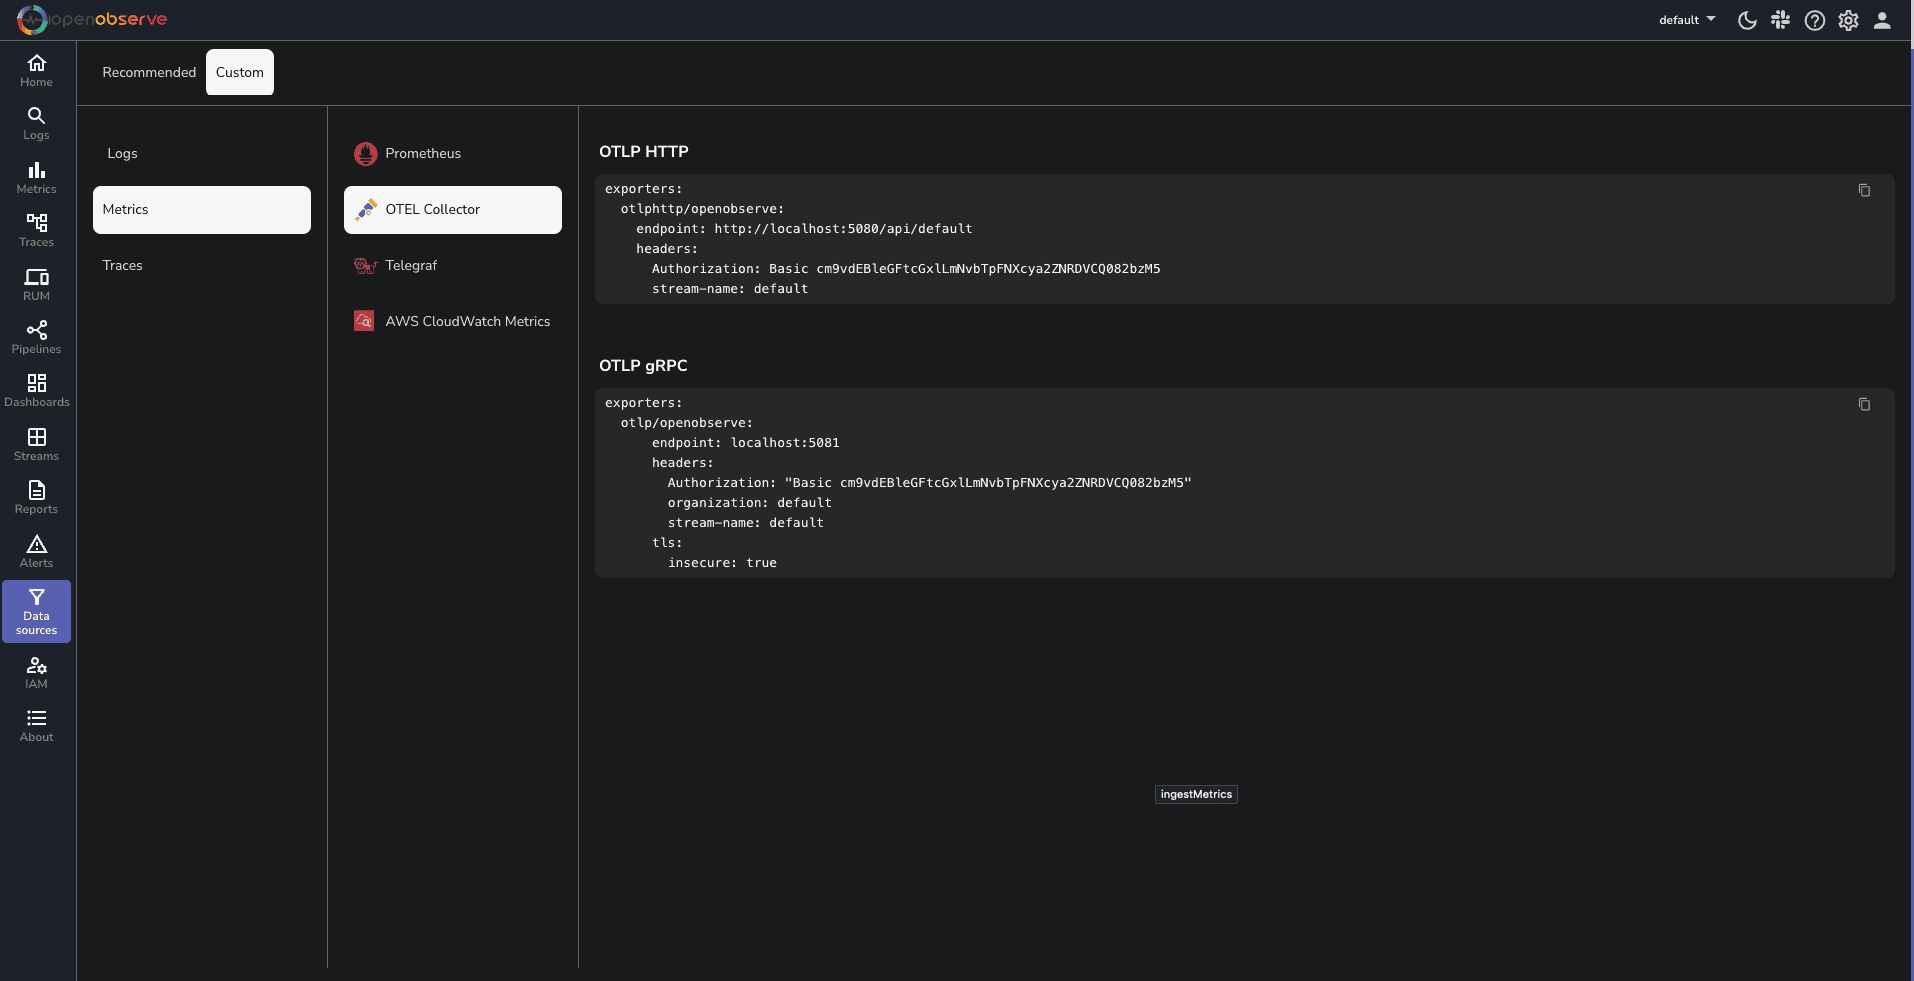
Replace OPENOBSERVE_ENDPOINT, OPENOBSERVE_TOKEN and OPENOBSERVE_STREAM with your OpenObserve credentials, which you can find in your OpenObserve dashboard under Data Sources -> Custom -> Metrics -> Otel Collector.
sudo systemctl start otelcol-contrib
sudo systemctl status otelcol-contrib
To confirm that OpenTelemetry Collector Contrib is successfully collecting Kafka metrics, check the logs:
journalctl -u otelcol-contrib --no-pager -n 50
If everything is configured correctly, you should see log messages indicating that metrics are being collected and exported.
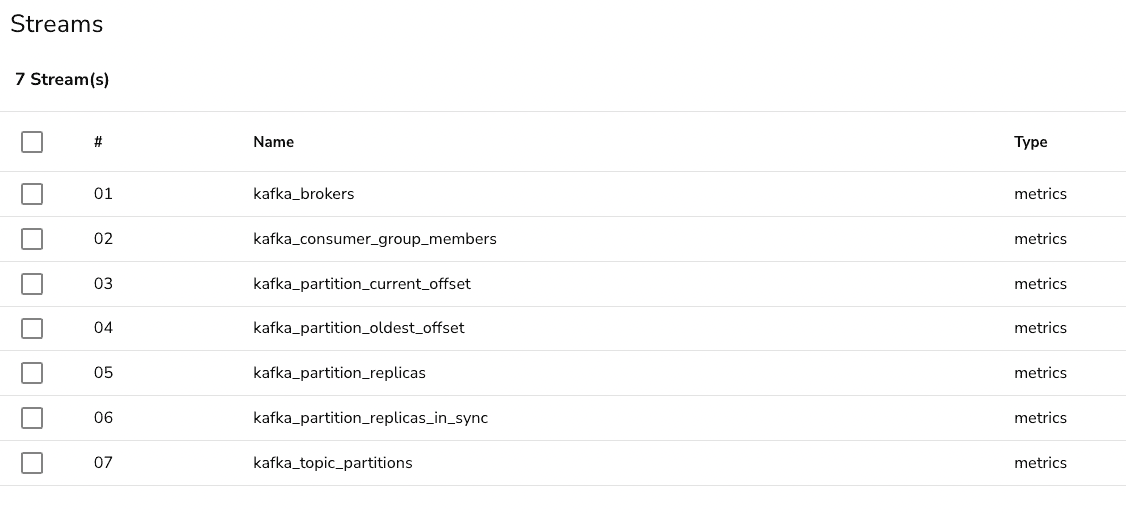
To visualize Kafka metrics, Download and configure a prebuilt dashboard supporting the following metrics:
| Aspect | Without OpenObserve | With OpenObserve |
|---|---|---|
| Issue Detection | Manual, reactive troubleshooting | Automated alerts and proactive monitoring |
| Performance Insights | Limited visibility into Kafka internals | Comprehensive dashboards for real-time analysis |
| Consumer Lag Tracking | Requires custom scripts and manual queries | Prebuilt metrics and visualizations |
| Scaling Decisions | Trial and error based on rough estimates | Data-driven scaling strategies with historical insights |
| Data Integrity Checks | Hard to track in-sync replicas and offsets | Clear visibility into partitions, replicas, and offsets |
| Audit and Compliance | Requires external logging and complex setups | Centralized monitoring for compliance tracking |
By following this guide, you have successfully installed and configured Kafka, set up OpenTelemetry Collector Contrib, and exported Kafka metrics to OpenObserve. Monitoring Kafka with OpenTelemetry helps in tracking performance issues, ensuring system reliability, and optimizing event streaming operations.
With real-time Kafka monitoring in place, you can:
Stay observant of Kafka metrics to maintain a healthy event-driven architecture and enhance your distributed streaming ecosystem.
Get Started with OpenObserve Today!
Sign up for a 14 day trial.
Check out our GitHub repository for self-hosting and contribution opportunities.
Chaitanya Sistla is a Principal Solutions Architect with 17X certifications across Cloud, Data, DevOps, and Cybersecurity. Leveraging extensive startup experience and a focus on MLOps, Chaitanya excels at designing scalable, innovative solutions that drive operational excellence and business transformation.