How to Ingest and Analyze NATS Logs and Metrics for Better Observability

Chaitanya Sistla
March 17, 2025
6 min read
Don’t forget to share!
Try OpenObserve Cloud today for more efficient and performant observability.
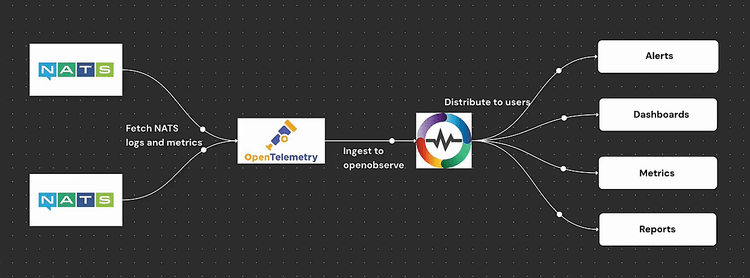
NATS is a high-performance, cloud-native messaging system designed for distributed applications, microservices, and IoT systems. As NATS plays a crucial role in ensuring seamless communication between services, monitoring its logs and metrics is essential for various reasons:
Without proper logging and monitoring, organizations risk undetected failures, slow response times, and security vulnerabilities in their NATS deployments. OpenObserve provides a centralized logging and metrics platform that makes it easier to collect, analyze, and visualize NATS logs and metrics for real-time observability.
To get started, we will install and run a NATS server on an Ubuntu system.
sudo apt update && sudo apt upgrade -y
sudo apt install -y wget unzip
wget https://github.com/nats-io/nats-server/releases/download/v2.10.26/nats-server-v2.10.26-linux-amd64.zip
unzip nats-server-v2.10.26-linux-amd64.zip
cd nats-server-v2.10.26-linux-amd64
sudo mv nats-server /usr/local/bin/
nats-server -js
The -js flag enables JetStream, which provides message persistence and stream processing capabilities.
By default, NATS logs events to stdout, but we can configure it to log to a file for better observability. Additionally, we will enable metrics using the Prometheus NATS exporter.
sudo mkdir -p /etc/nats
sudo nano /etc/nats/nats.conf
Add the following configuration:
pid_file: "/var/run/nats-server.pid"
http: 8222

log_file: "/var/log/nats-server.log"
logtime: true
debug: true
trace: true
This configuration ensures that:
nats-server -c /etc/nats/nats.conf
To verify logs are being generated:
tail -f /var/log/nats-server.log
Run the following command to start the Prometheus NATS exporter:
docker run -p 7777:7777 natsio/prometheus-nats-exporter:latest -D -jsz=all -accstatz -connz_detailed -gatewayz -healthz -connz -varz -channelz -serverz -subz http://<NATS_SERVER_IP>:8222
This will expose NATS metrics on port 7777.
To collect and publish both logs and metrics to OpenObserve, we will use the OpenTelemetry (OTEL) Collector.
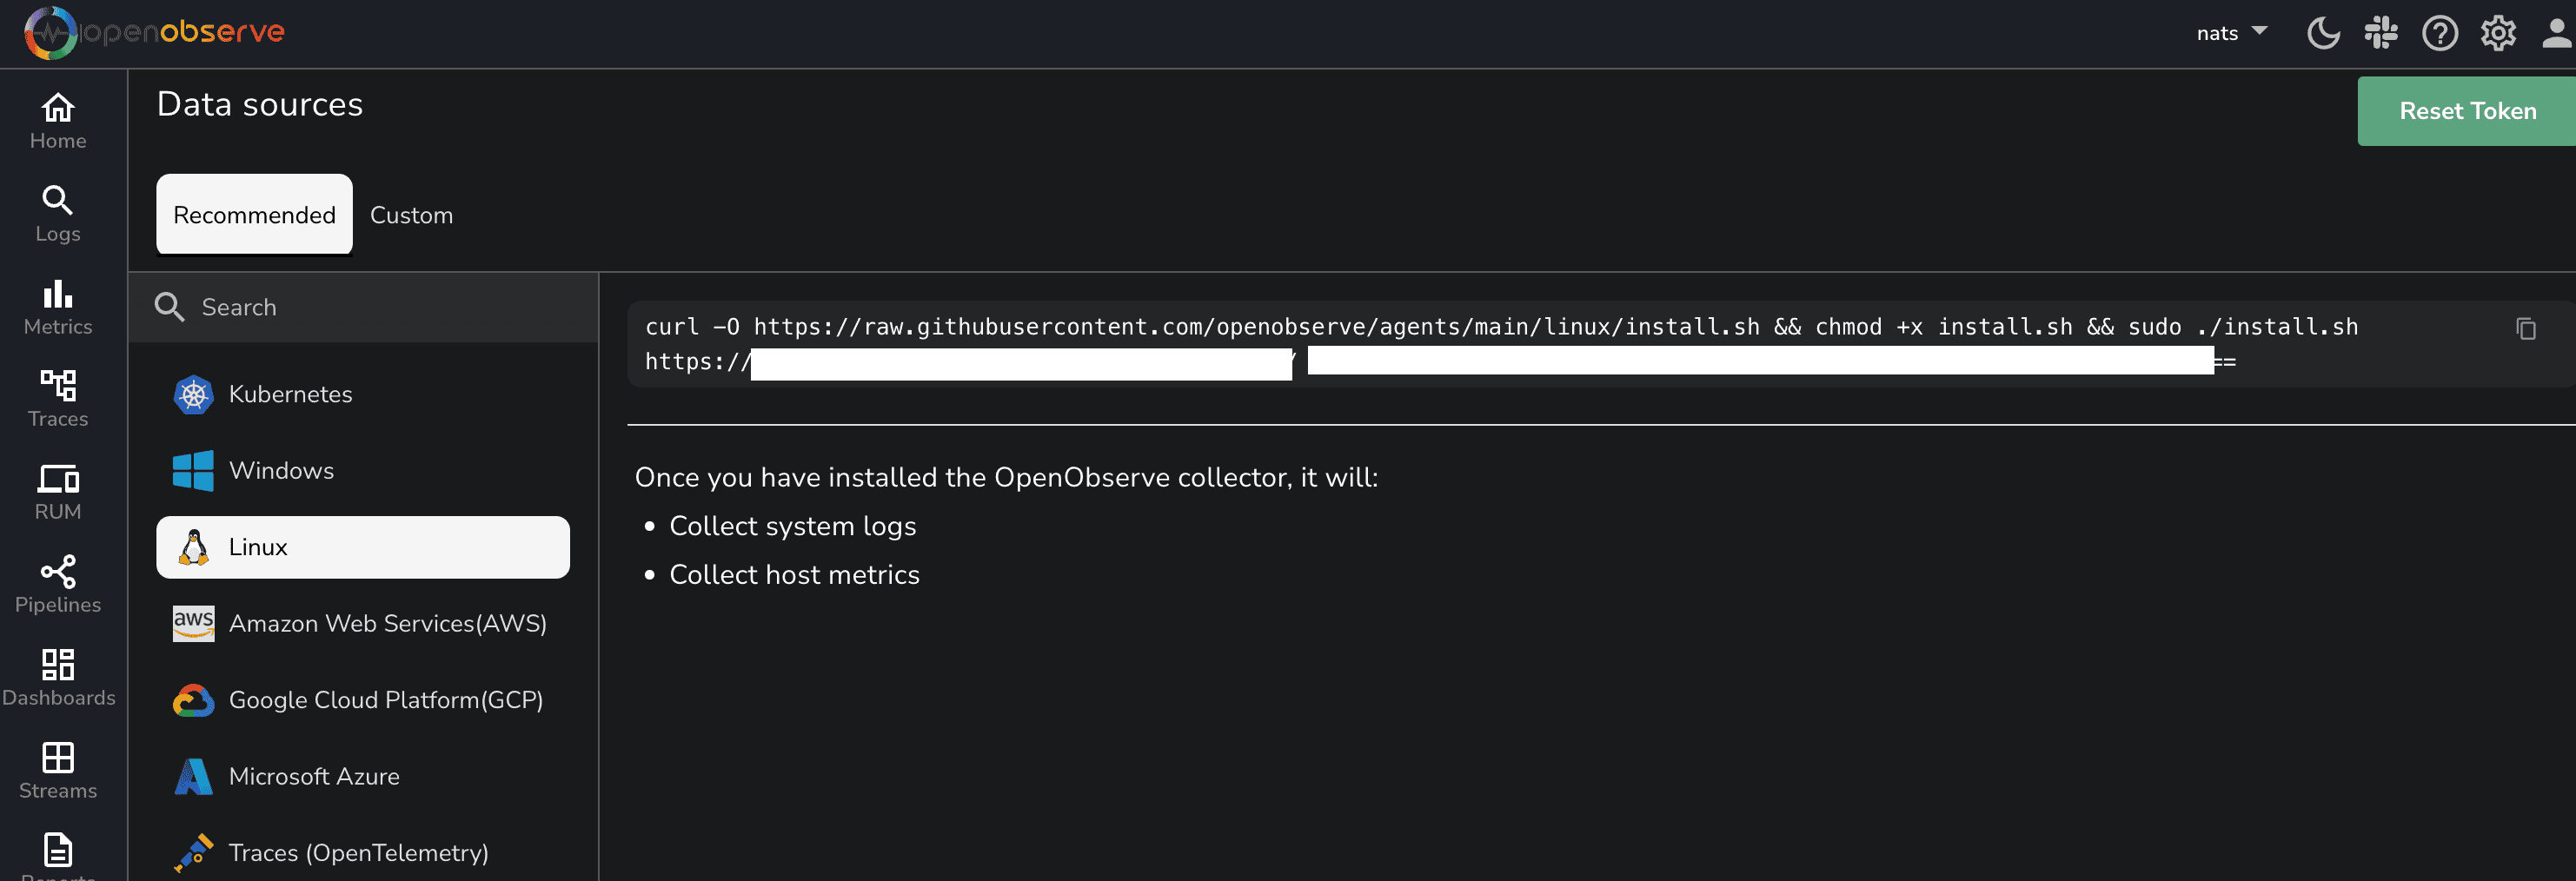
curl -O https://raw.githubusercontent.com/openobserve/agents/main/linux/install.sh && chmod +x install.sh && sudo ./install.sh OPENOBSERVE_HTTP_ENDPOINT OPENOBSERVE_TOKEN
You can find the above details from OpenObserve datasources page as shown below.
Create a configuration file:
sudo vi /etc/otelcol-config.yaml
Add the following configuration:
receivers:
  filelog/std:
    include: [ /var/log/nats-server.log ]
    start_at: beginning
  prometheus:
    config:
      scrape_configs:
        - job_name: 'nats'
          scrape_interval: 5s
          static_configs:
            - targets: ['localhost:7777']
processors:
  batch:
    timeout: 5s

exporters:
  otlphttp/openobserve:
    endpoint: OPENOBSERVE_ENDPOINT
    headers:
      Authorization: "OPENOBSERVE_TOKEN"
      stream-name: nats

service:
  pipelines:
    metrics:
      receivers: [prometheus]
      processors: [batch]
      exporters: [otlphttp/openobserve]
    logs:
      receivers: [filelog/std]
      processors: [batch]
      exporters: [otlphttp/openobserve]
systemctl restart otel-collector
To verify logs and metrics are being sent:
journalctl -u otelcol -f
nats benchTo generate traffic for NATS, run the following command:
nats bench test --pub 10 --sub 10 --msgs 1000000 --size 128
This will:
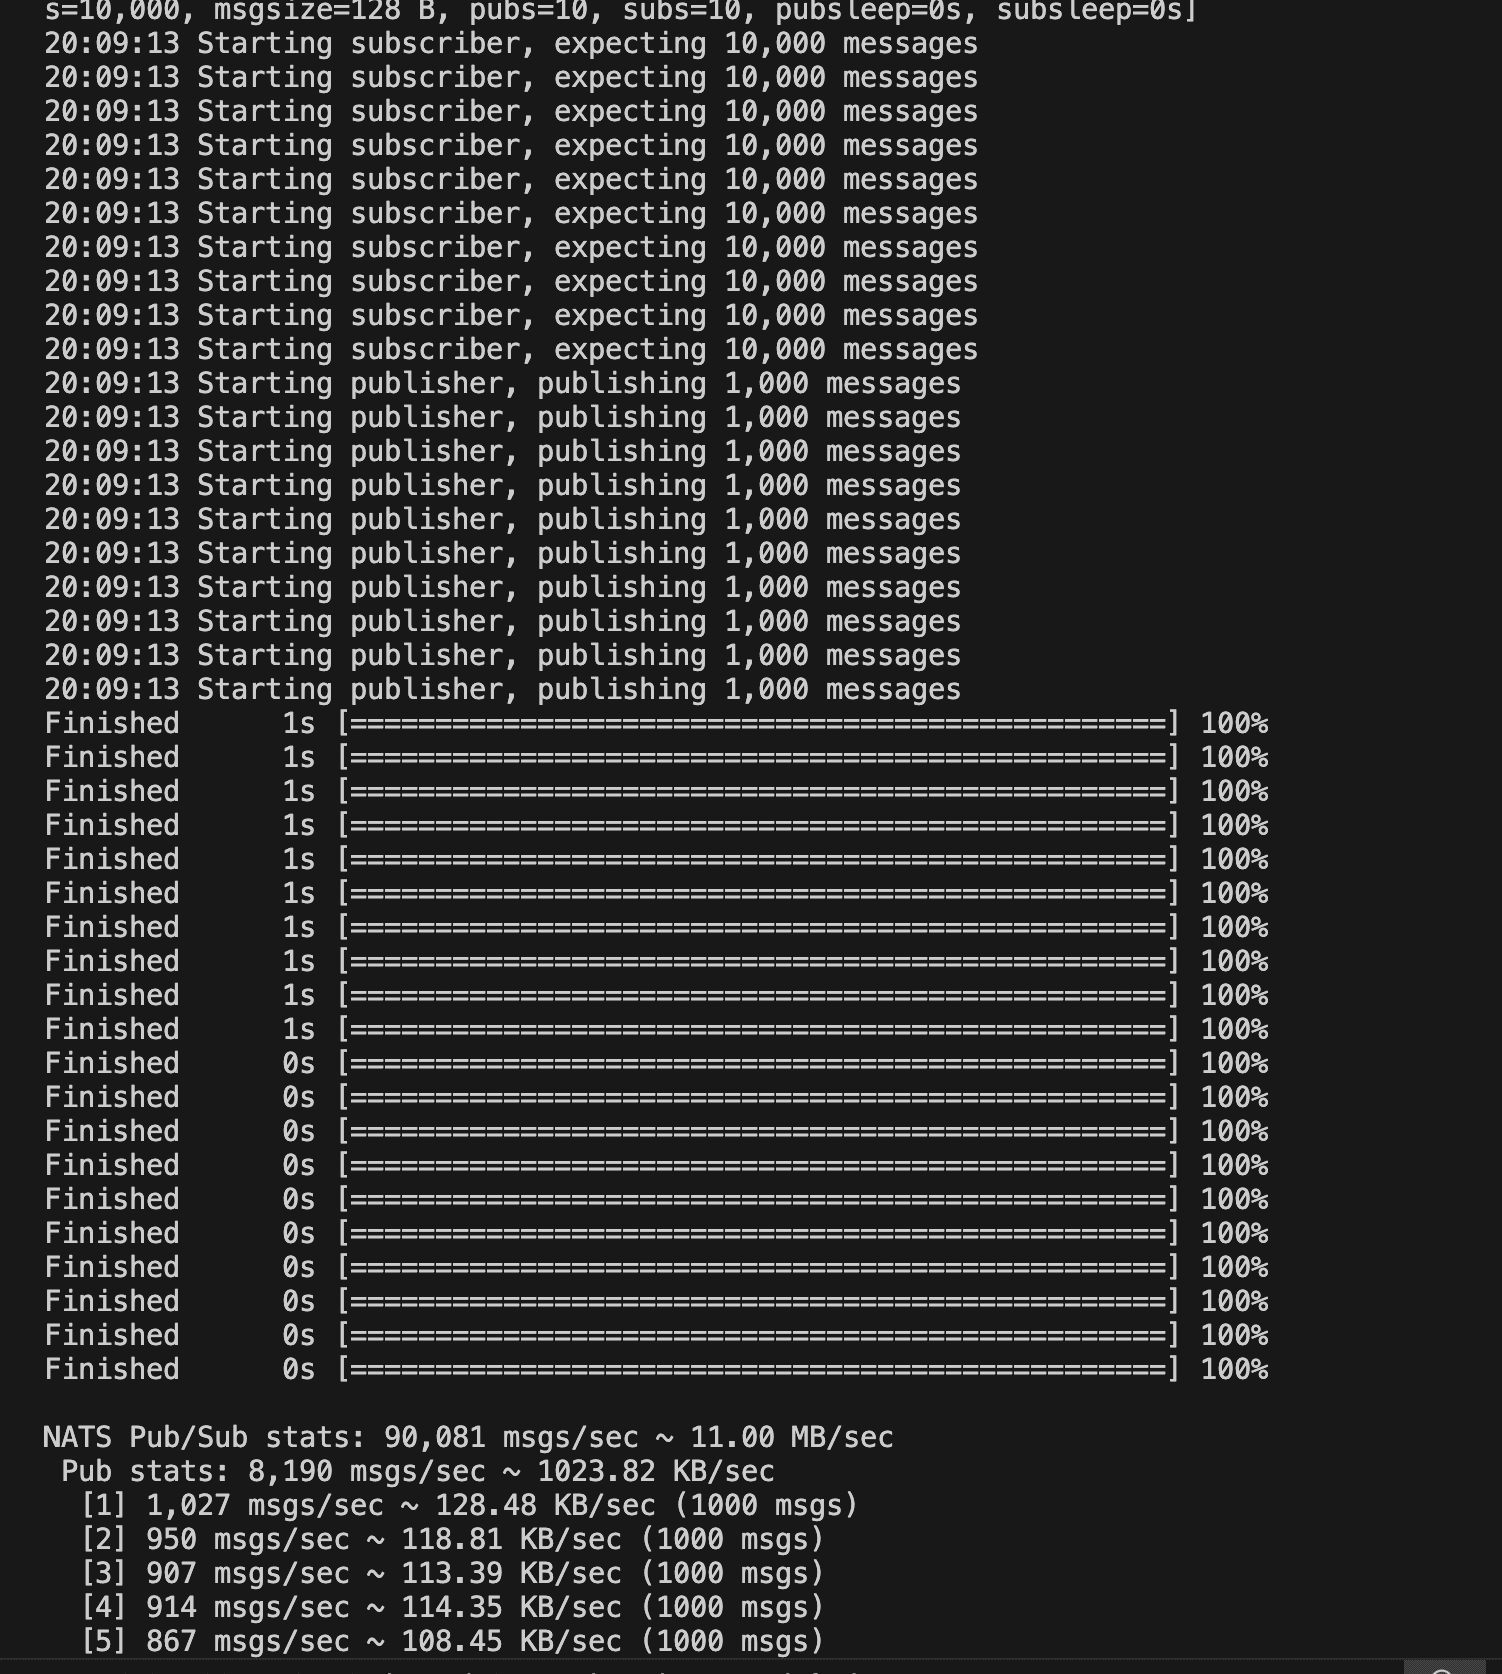 This benchmark tool helps simulate real-world traffic and measure NATS performance.
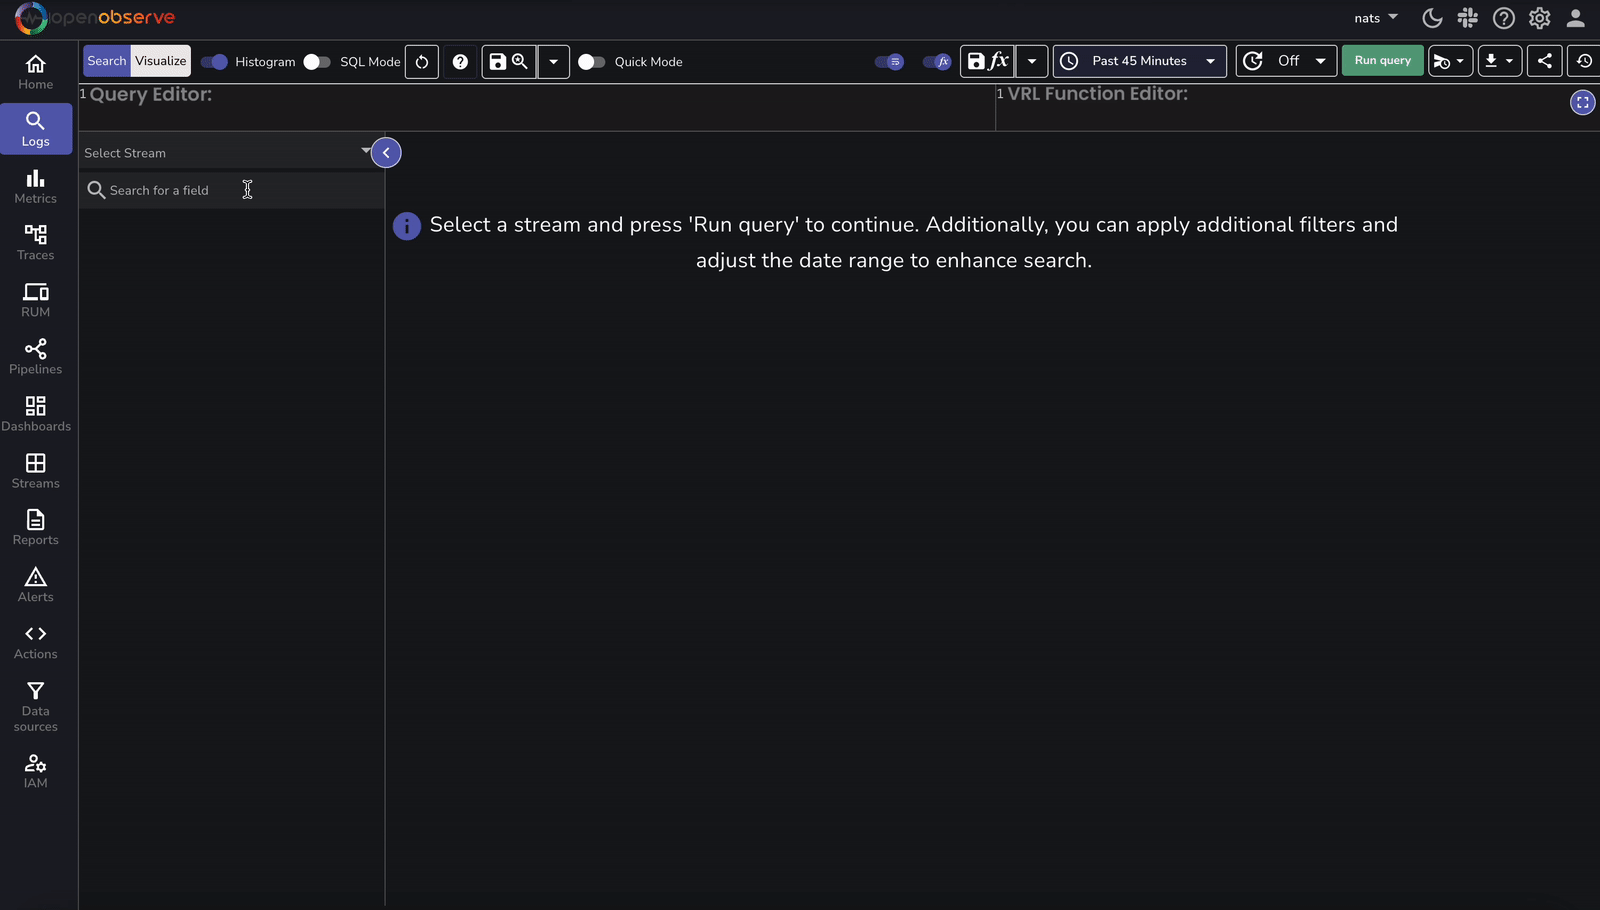
Once logs and metrics are flowing into OpenObserve, we can query and visualize them.
A pre-configured dashboard is available to visualize real-time logs and metrics. This dashboard provides:
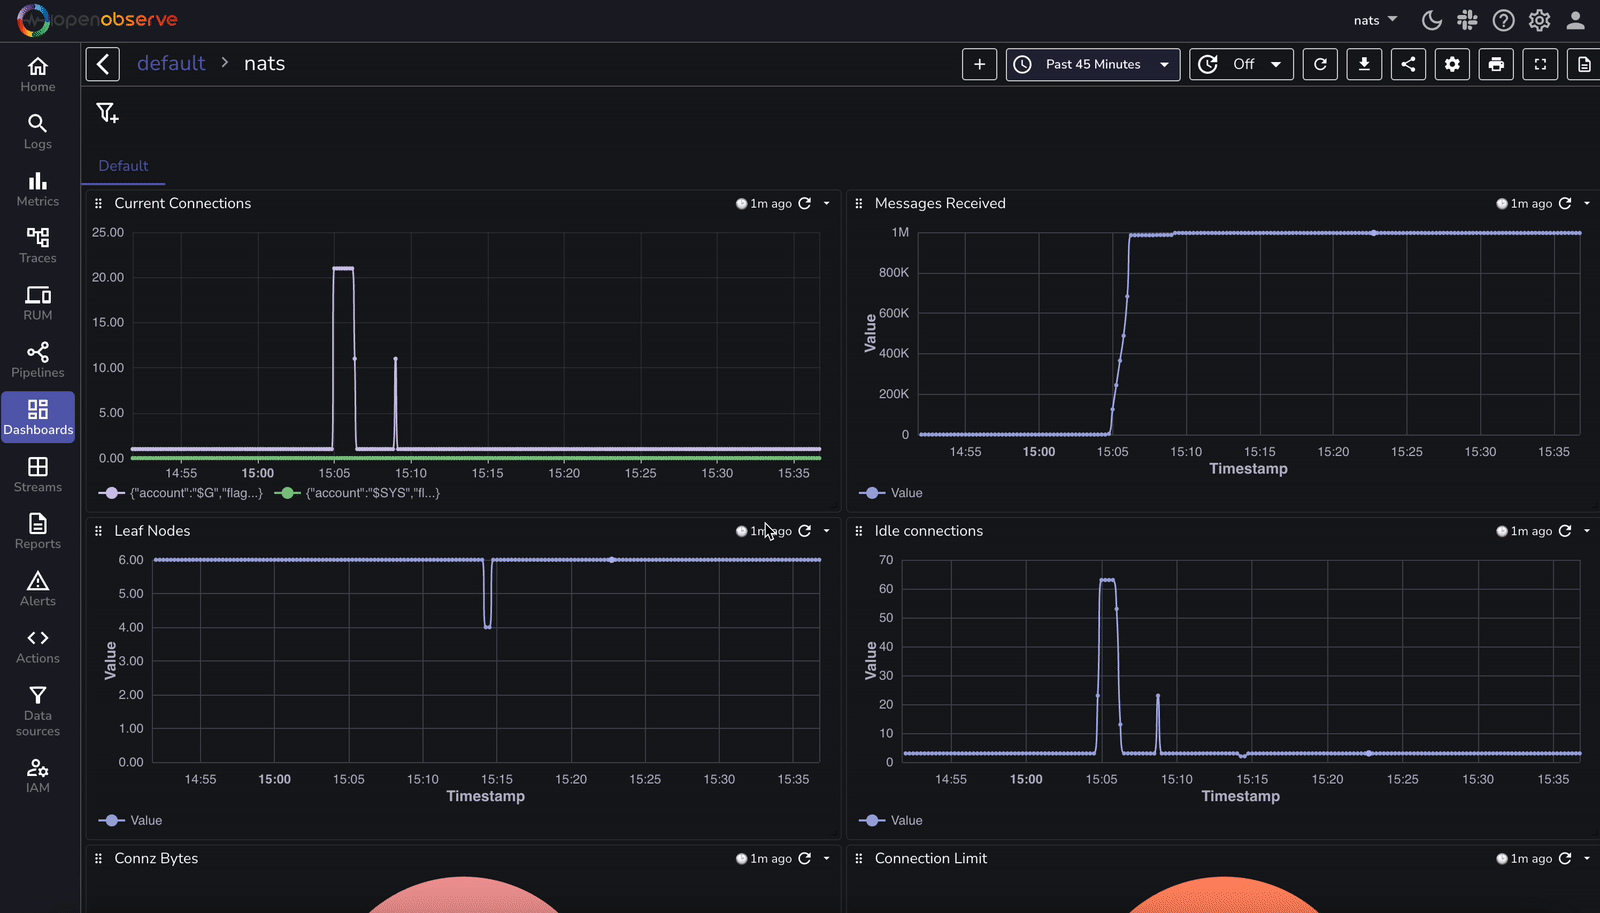
This dashboard can be imported into OpenObserve for immediate insights into your NATS deployment.
Here's a detailed comparison for monitoring NATS without OpenObserve vs. with OpenObserve:
| Feature | Without OpenObserve | With OpenObserve |
|---|---|---|
| Log Collection | Requires setting up a custom logging mechanism | Logs are collected using OpenTelemetry (OTEL) Collector |
| Log Storage | Logs stored in local files or separate logging system | Centralized log storage in OpenObserve |
| Log Search & Analysis | Manual searching through logs, difficult correlation | Fast, full-text search with query capabilities |
| Metric Collection | Requires Prometheus setup and additional exporters | Metrics collected via OTEL collector with built-in support |
| Metric Visualization | Requires setting up Grafana and custom dashboards | Prebuilt OpenObserve dashboards for NATS |
| Alerting & Notifications | Requires separate alerting tools (e.g., Prometheus Alertmanager) | Built-in alerting with custom thresholds and notifications |
| Log & Metric Correlation | Logs and metrics stored separately, requiring manual correlation | Unified view for logs, metrics, and traces in OpenObserve |
| Data Retention | Limited by local storage constraints | Scalable storage with retention policies in OpenObserve |
| Query & Insights | Complex queries require additional tools | SQL-like queries for deep insights |
| Scalability | Requires managing storage and scaling manually | OpenObserve scales automatically for large workloads |
This table highlights how OpenObserve simplifies and enhances NATS monitoring by integrating logs, metrics, and tracing into a single, scalable platform.
By integrating NATS logs and metrics with OpenObserve via OpenTelemetry, you gain:
Get Started with OpenObserve Today!
Sign up for a free trial of OpenObserve on our website. Check out our GitHub repository for self-hosting and contribution opportunities.
Chaitanya Sistla is a Principal Solutions Architect with 17X certifications across Cloud, Data, DevOps, and Cybersecurity. Leveraging extensive startup experience and a focus on MLOps, Chaitanya excels at designing scalable, innovative solutions that drive operational excellence and business transformation.


