Monitor Your PostgreSQL Performance via OpenTelemetry Collector

Manas Sharma
December 16, 2024
7 min read
Don’t forget to share!
Try OpenObserve Cloud today for more efficient and performant observability.
Are you tired of juggling multiple tools to monitor your PostgreSQL database performance? Look no further! In this blog post, we’ll guide you through using OpenTelemetry and OpenObserve to streamline your monitoring process efficiently.
Monitoring your PostgreSQL performance is crucial for ensuring your database runs smoothly and efficiently. Effective monitoring helps you:
With OpenTelemetry and OpenObserve, you can collect and analyze telemetry data from your PostgreSQL database, making it easier to optimize performance and troubleshoot issues.
Before we dive into the tutorial, ensure you have the following:
First, ensure your PostgreSQL server is running and accessible. If you're running it locally, it should be available at localhost:5432. We'll create a role named myuser with the password mypassword. You can choose different credentials, but remember them for the upcoming steps.
To create the role, enter the PostgreSQL shell and execute:
CREATE ROLE myuser WITH LOGIN PASSWORD 'mypassword';


Next, we need to install the OpenTelemetry Collector.
NOTE: The default Otel Collector doesn't have all the receivers, including the Postgres one we are going to use to collect data from the DB. It has support for receivers like Jaeger, Prometheus etc. So, instead of using opentelemetry-collector, we are going to use opentelemetry-collector-contrib.*
Visit the OpenTelemetry Collector Contrib Releases page.
Download the latest release for your machine. You can use the following command in your terminal, replacing X.Y.Z with the latest version number:
curl --proto '=https' --tlsv1.2 -fOL https://github.com/open-telemetry/opentelemetry-collector-releases/releases/download/v0.115.1/otelcol-contrib_0.115.1_darwin_arm64.tar.gz
tar -xvf otelcol-contrib_0.115.1_darwin_arm64.tar.gz
sudo mv otelcol-contrib /usr/local/bin/
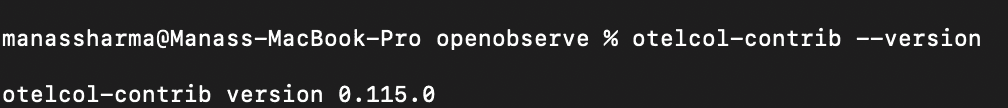
otelcol-contrib --version
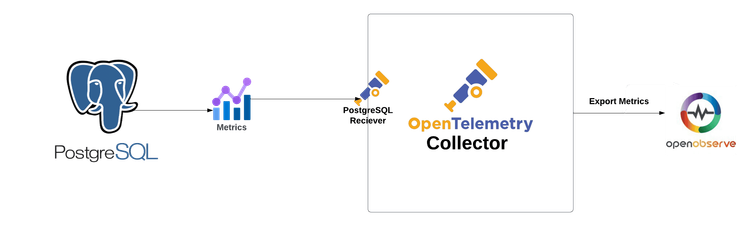
Receivers in the OpenTelemetry Collector are responsible for collecting telemetry data from various sources. They act as the entry point for data into the collector, allowing it to gather metrics, logs, and traces from different systems. Each receiver is designed to handle specific types of data and protocols.
The PostgreSQL receiver is specifically designed to collect performance metrics from PostgreSQL databases. This is particularly useful for monitoring database performance, identifying bottlenecks, and optimizing queries. By using this receiver, you can gain insights into database health and operational metrics, which can help in troubleshooting and performance tuning.
The following settings are required to create a database connection:
The following settings are optional:
endpoint (default = localhost:5432): The endpoint of the PostgreSQL server. Whether using TCP or Unix sockets, this value should be in the format host:port. If transport is set to unix, the endpoint will be internally translated from host:port to /host.s.PGSQL.port.
transport (default = tcp): The transport protocol being used to connect to PostgreSQL. Available options are tcp and unix.
databases (default = []): The list of databases for which the receiver will attempt to collect statistics. If an empty list is provided, the receiver will attempt to collect statistics for all non-template databases.
exclude_databases (default = []): List of databases which will be excluded when collecting statistics.
Here’s a basic sample configuration for the PostgreSQL receiver:
receivers:
  postgresql:
    endpoint: localhost:5432
    transport: tcp
    username: otel
    password: ${env:POSTGRESQL_PASSWORD}
    connection_pool:
      max_idle_time: 10m
      max_lifetime: 0
      max_idle: 2
      max_open: 5
Next, you’ll need to create a configuration file named config.yaml. This file defines how the Collector will behave, including what data it will receive, how it will process that data, and where it will send it.
receivers:
  postgresql:
    endpoint: localhost:5432
    transport: tcp
    username: myuser
    password: ${env:POSTGRESQL_PASSWORD}
    databases:
      - postgres
    connection_pool:
      max_idle_time: 10m
      max_lifetime: 0
      max_idle: 2
      max_open: 5

processors:
  memory_limiter:
    check_interval: 1s
    limit_percentage: 75
    spike_limit_percentage: 15
  batch:
    send_batch_size: 10000
    timeout: 10s

exporters:
  otlphttp/openobserve:
    endpoint: http://localhost:5080/api/default
    headers:
      Authorization: Basic cm9vdEBleGFtcGxlLmNvbTpSYUJaRVFJTWRSVlJxWGFy
      stream-name: default

service:
  pipelines:
    metrics:
      receivers: [postgresql]
      processors: [memory_limiter, batch]
      exporters: [otlphttp/openobserve]
Receivers: The postgresql receiver collects data from your PostgreSQL instance. Ensure the endpoint, username, and password match the credentials you set earlier.
Processors: The memory_limiter and batch processors manage and optimize the data flow to the exporters.
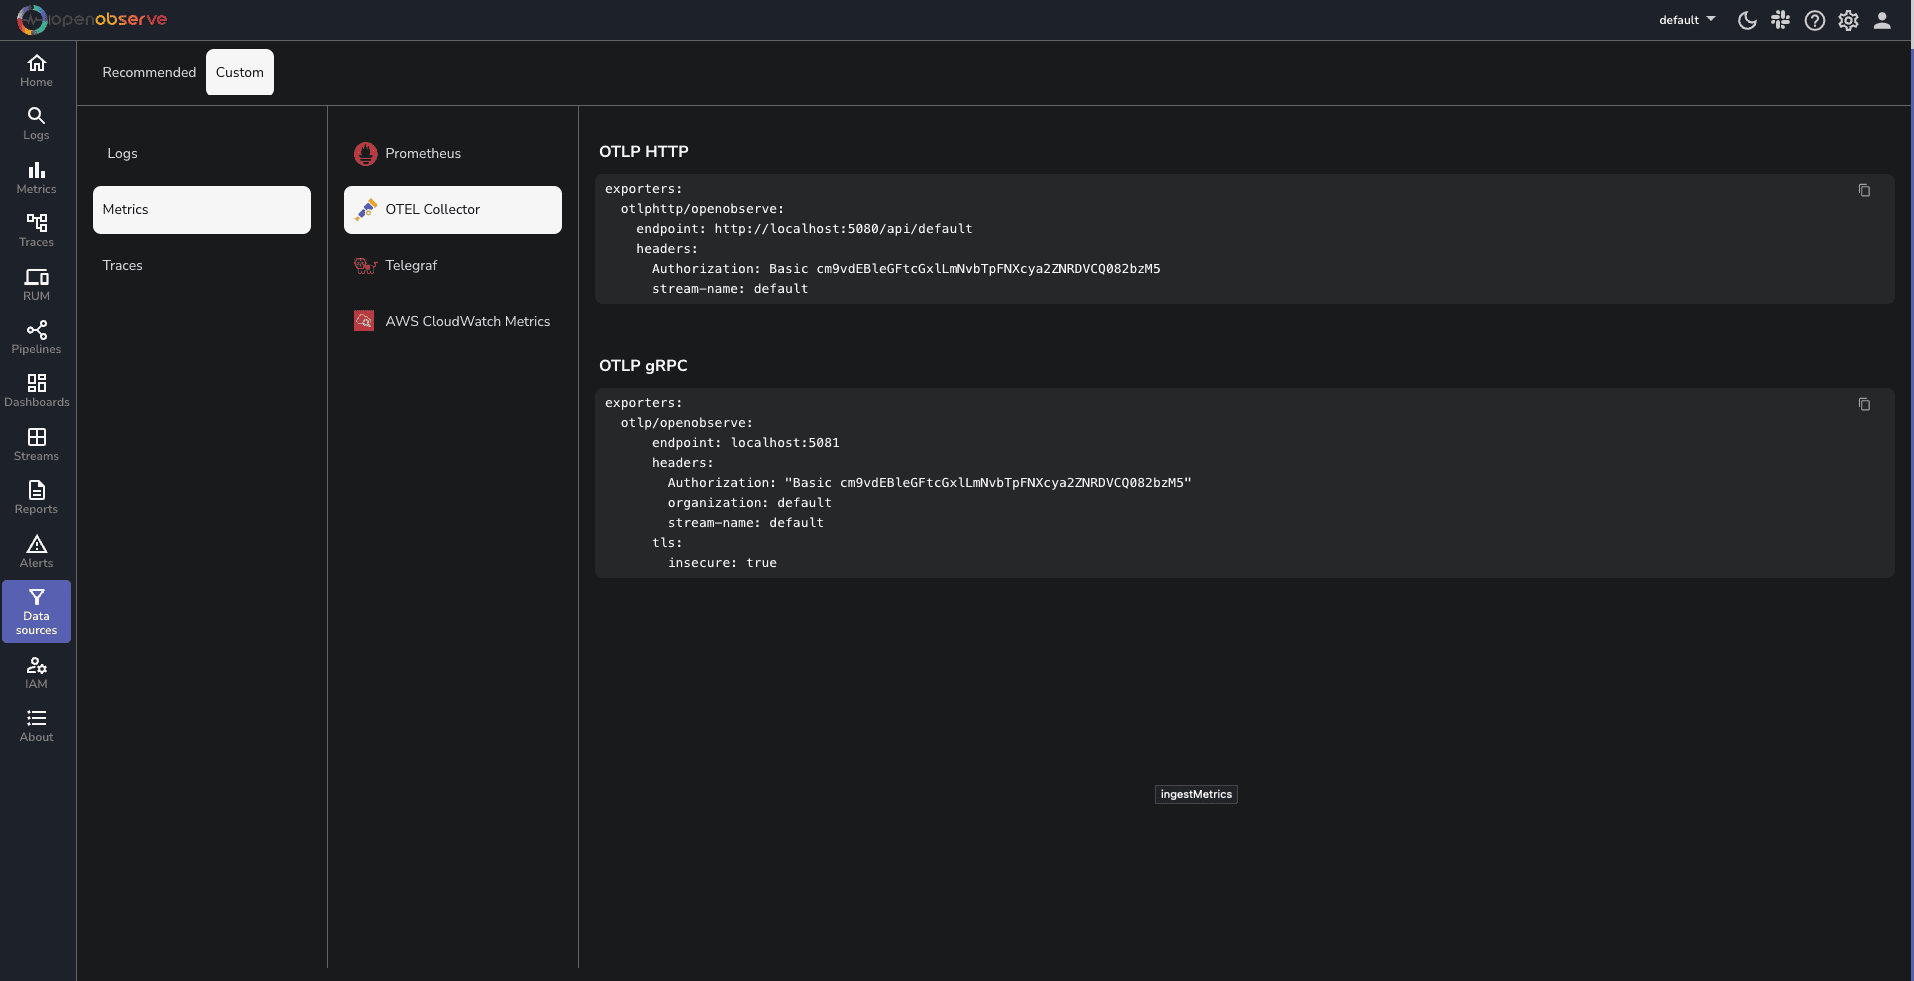
Exporters: The otlphttp/openobserve exporter sends the collected telemetry data to OpenObserve. Replace YOUR_API_ENDPOINT and YOUR_AUTH_TOKEN with your actual OpenObserve API endpoint and authentication token, which you can find in your Data Sources -> Custom - > Metrics -> Otel Collector
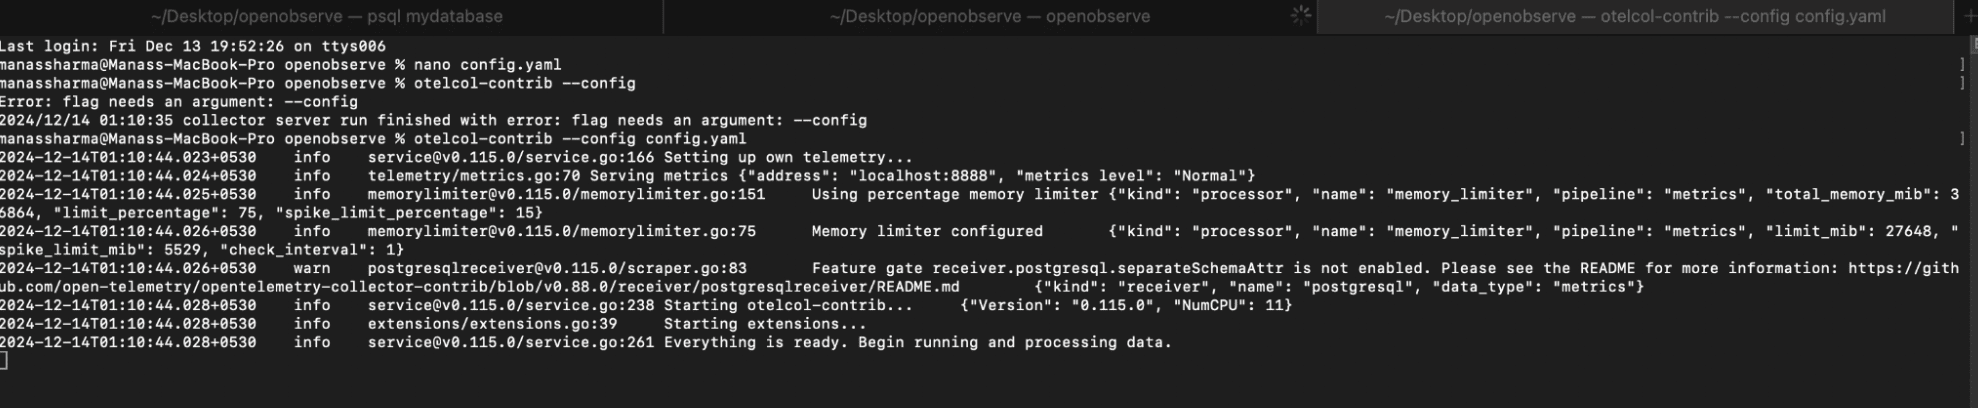
To run the OpenTelemetry Collector with the specified configuration, execute the following command in your terminal:
otelcol-contrib --config /path/to/your/config.yaml
Replace /path/to/your/config.yaml with the actual path to your configuration file.
You will get a Output similar to this Screenshot
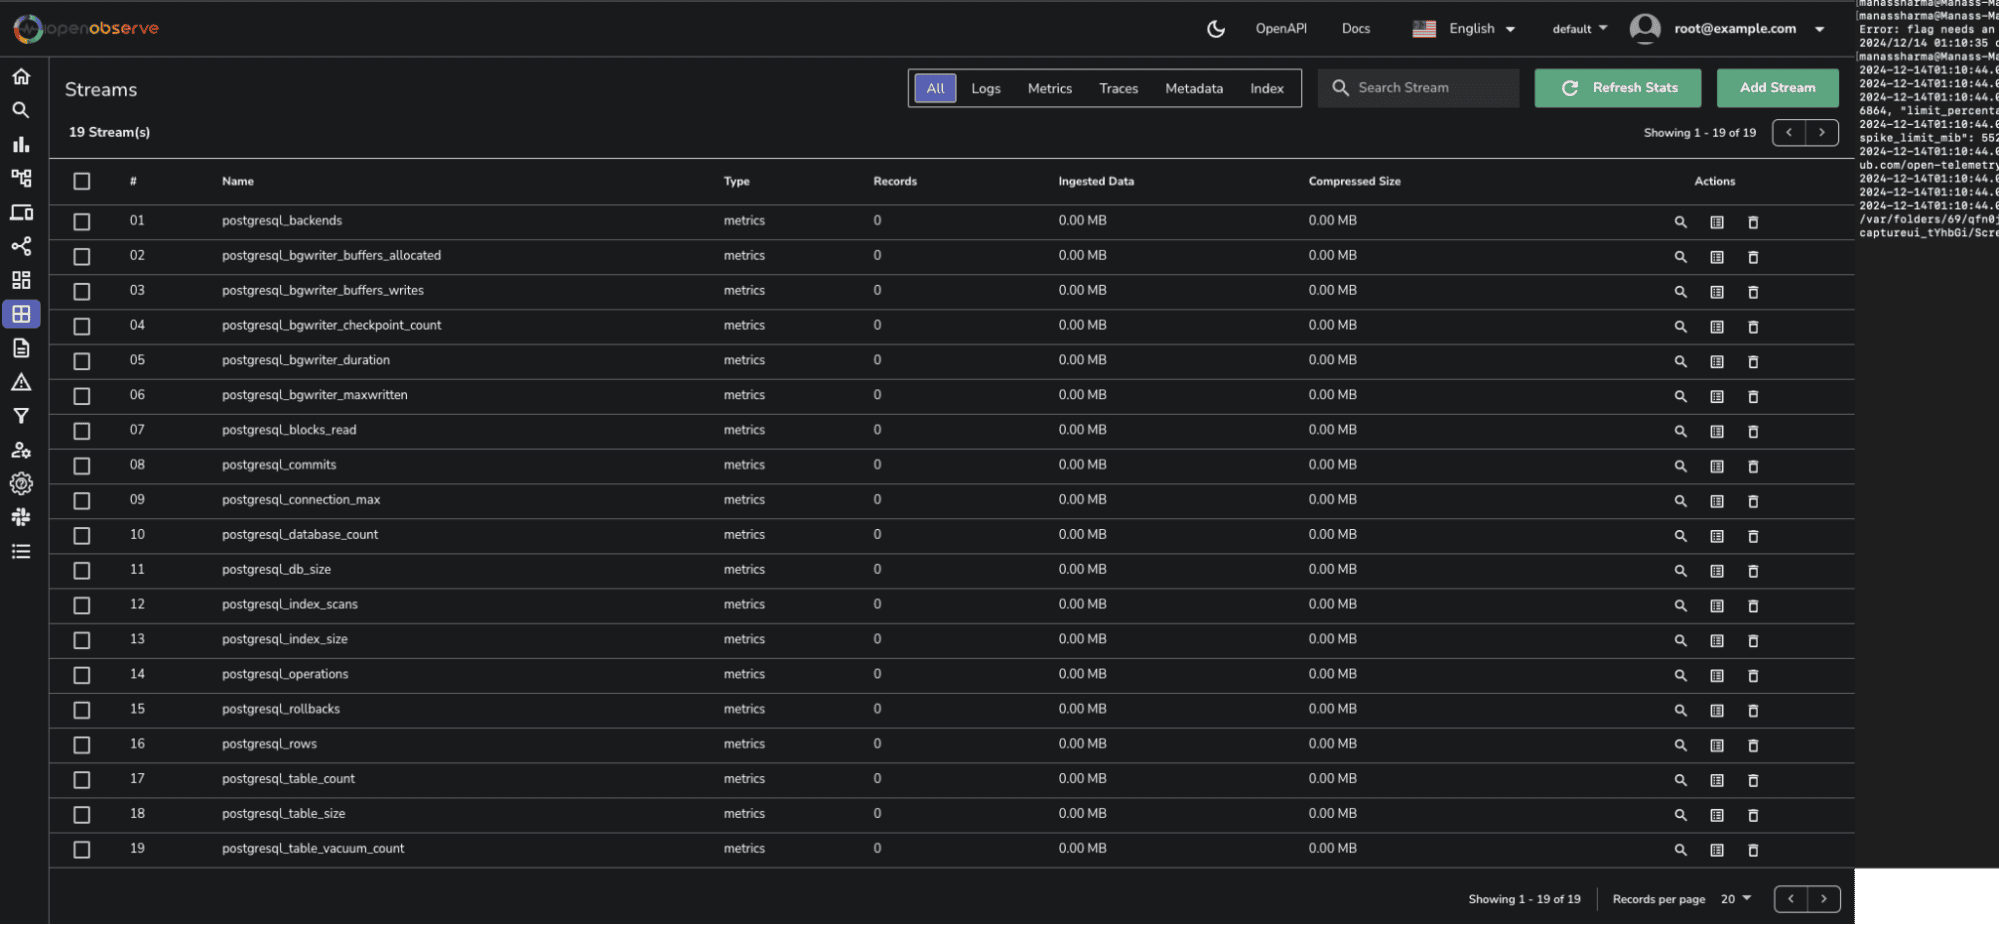
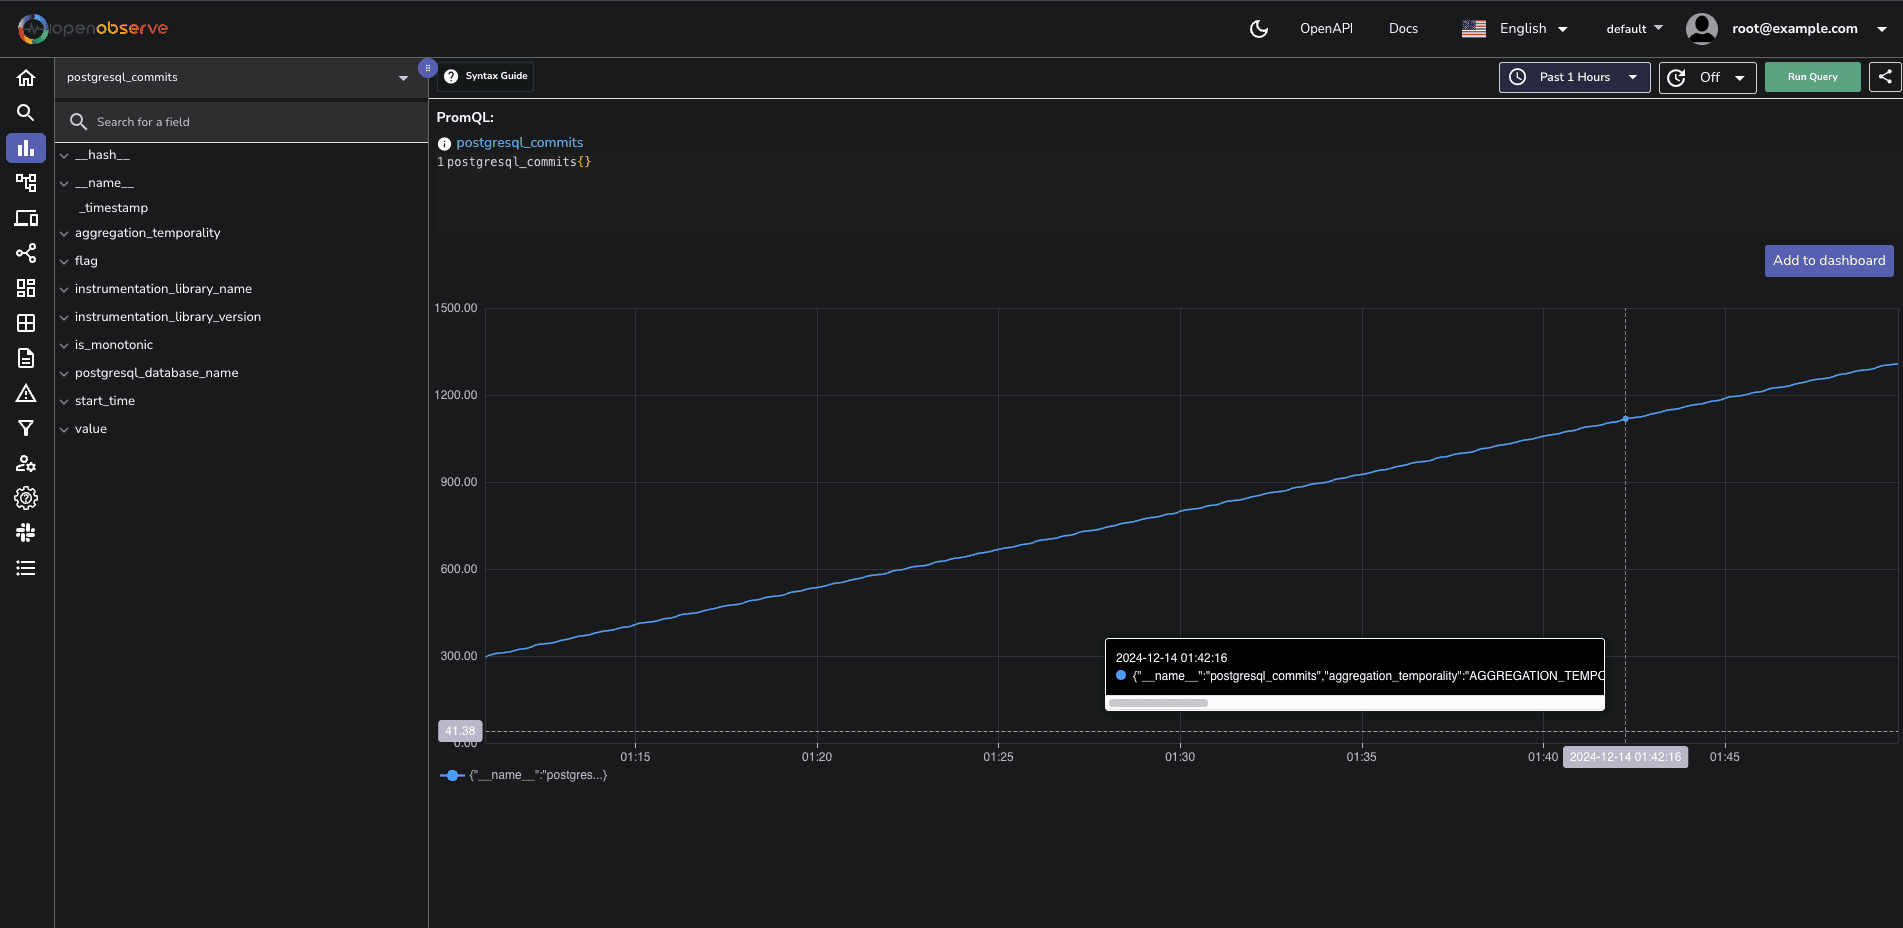
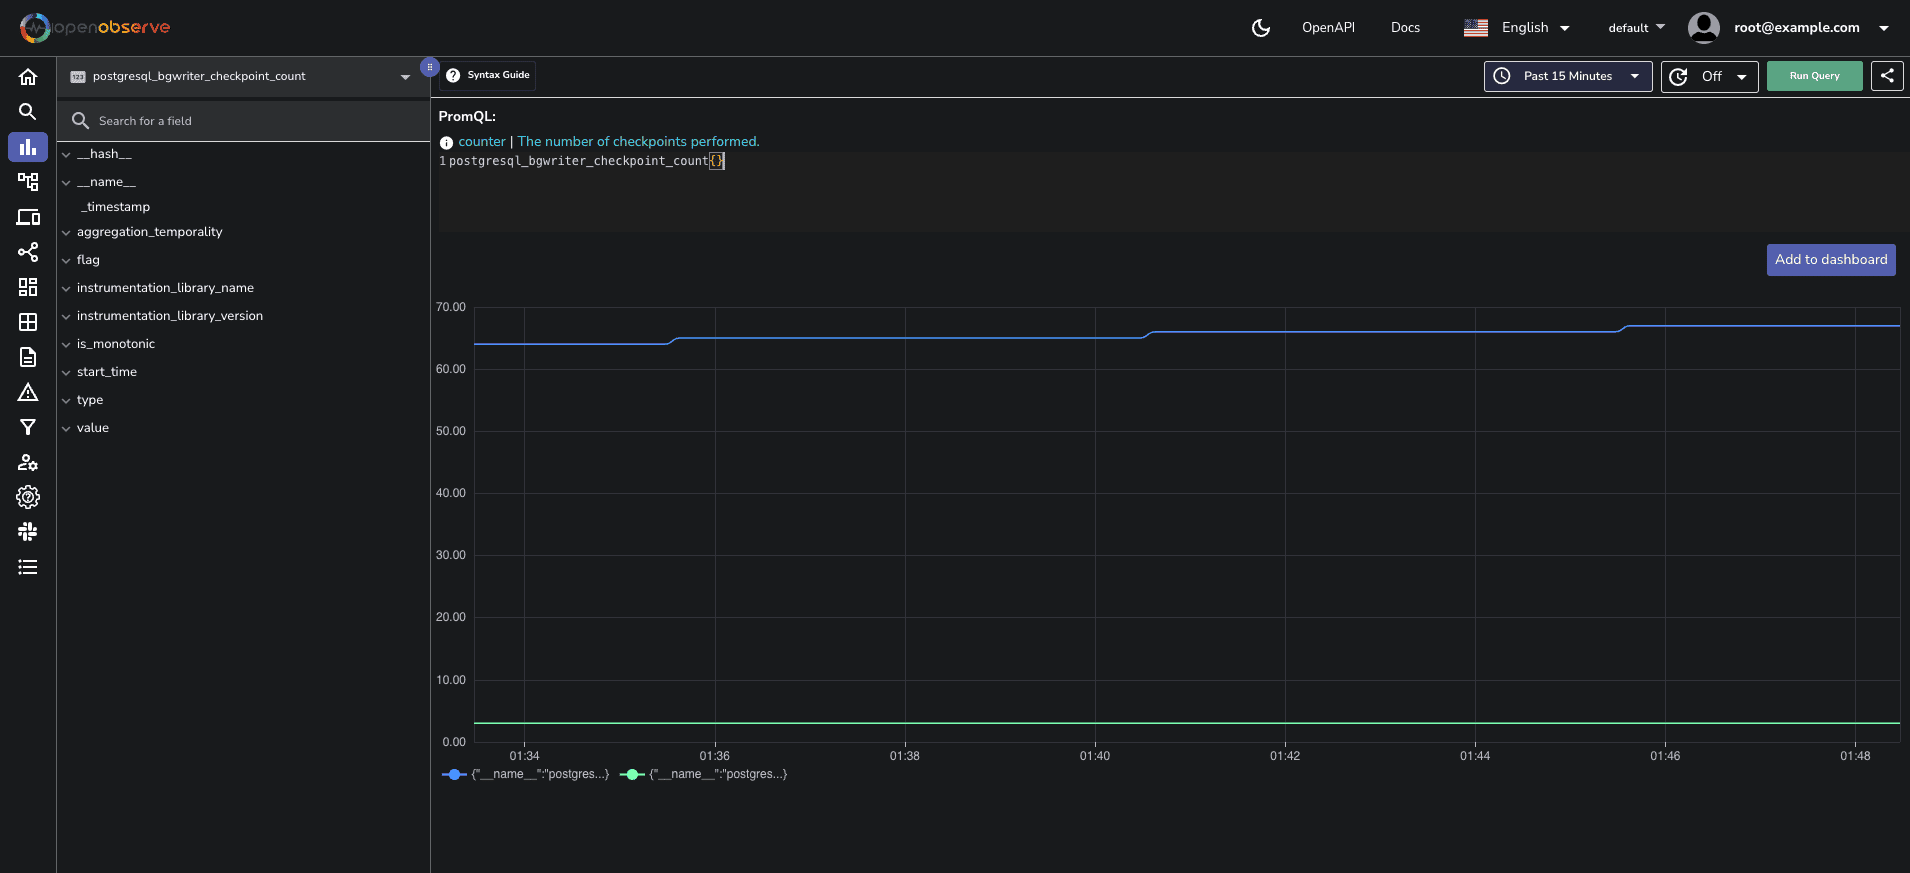
Now that your setup is complete, head over to the OpenObserve dashboard. Click on the Streams button in the sidebar to view the collected data streams. If you don’t see your data, refresh the stats. You can use the search bar to filter for PostgreSQL data.
Viewing PostgreSQL dashboard
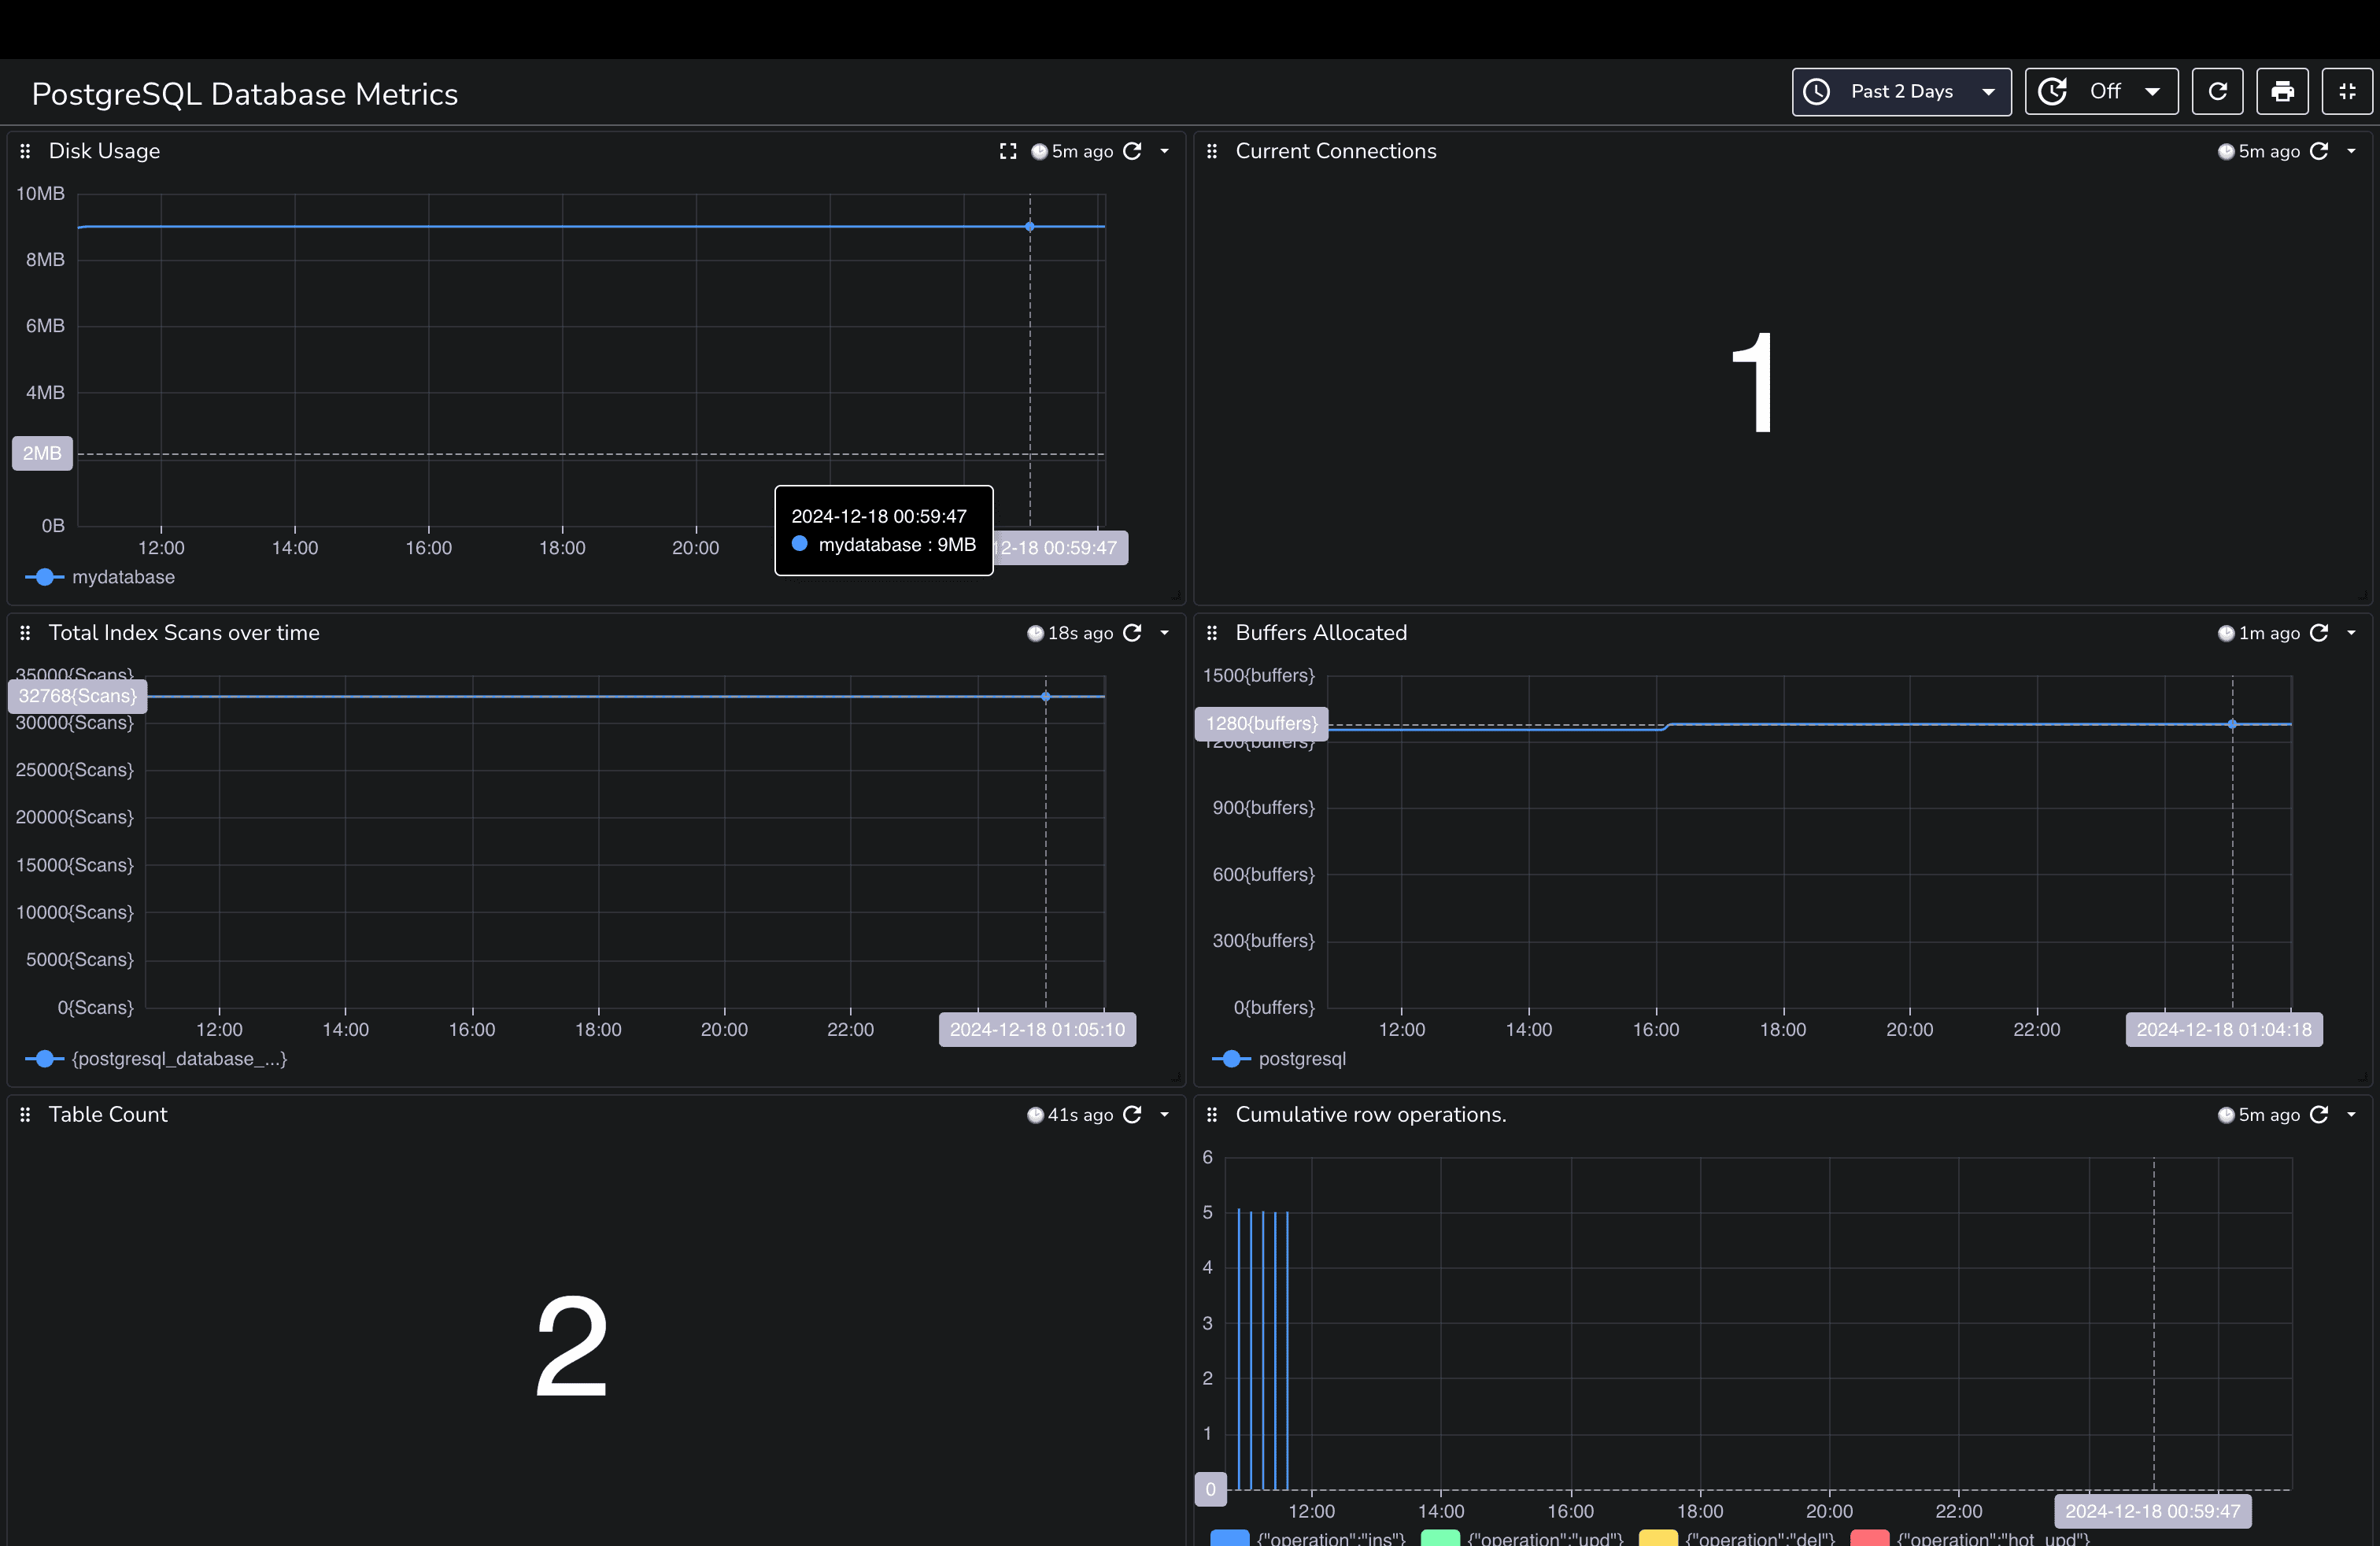
Each panel is designed to provide insights into different aspects of your PostgreSQL database, helping you monitor performance and health effectively. You can download the dashboards here.
When working with the OpenTelemetry Collector to monitor metrics from a PostgreSQL database, one common issue that may arise is the inability of the PostgreSQL server to send metrics due to SSL not being enabled by default. This can lead to connection errors and hinder your monitoring capabilities. In this section, we will detail the steps to enable SSL on your PostgreSQL server, ensuring a secure connection for metrics collection.
To enable SSL on your PostgreSQL server, follow these systematic steps:
First, you need to locate and edit the postgresql.conf file. The location of this file can vary, but it is typically found in the PostgreSQL data directory. To find the data directory, execute the following command in your PostgreSQL client:
SHOW data_directory;
nce you have identified the data directory, open the postgresql.conf file using your preferred text editor. For example, using nano:
nano /path/to/your/postgresql.conf
Within the postgresql.conf file, scroll down to the SSL configuration section. If SSL is not already configured, you can add the following settings. This configuration assumes you have already generated your SSL certificate (server.crt) and key (server.key) and placed them in the PostgreSQL data directory.
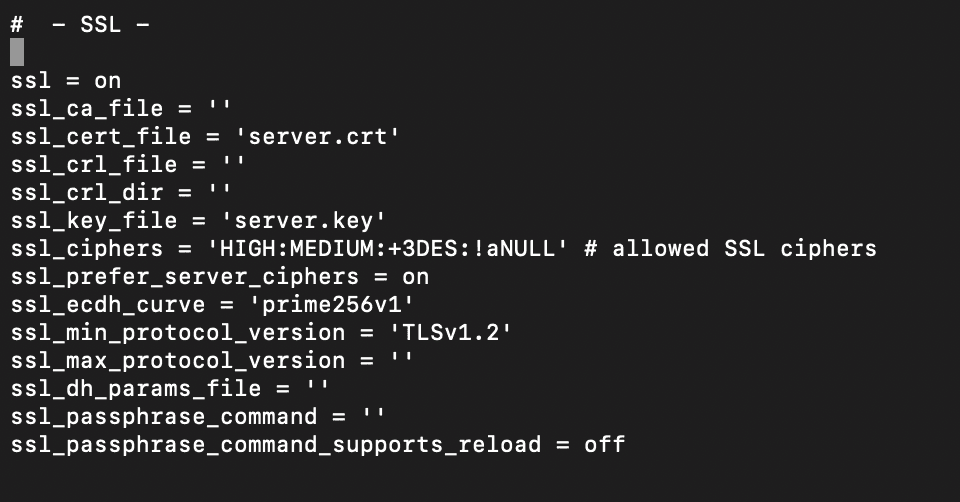
After updating the configuration:
Save and Exit: If you are using nano, press CTRL + X, then Y, and finally Enter to save the changes.
Restart PostgreSQL: To apply the changes, restart the PostgreSQL service. Depending on your system setup, you can use one of the following commands:
brew services restart postgresql
Once PostgreSQL has restarted, connect to your database and run the following command to verify that SSL is enabled:
SHOW ssl;
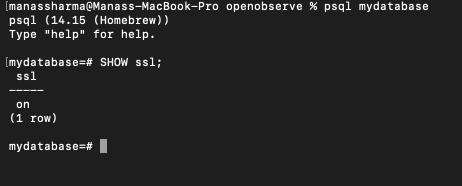
This command should return on, confirming that SSL is successfully enabled.
Congratulations! You’ve successfully set up a monitoring system for your PostgreSQL database using OpenTelemetry and OpenObserve. With this powerful combination, you can gain insights into your database performance and make informed decisions to optimize your applications.
Thank you for reading this guide!
Happy monitoring! 🚀
Manas is a passionate Dev and Cloud Advocate with a strong focus on cloud-native technologies, including observability, cloud, kubernetes, and opensource. building bridges between tech and community.


