Monitor Your MongoDB Metrics with OpenTelemetry and OpenObserve

Manas Sharma
January 03, 2025
6 min read
Don’t forget to share!
Try OpenObserve Cloud today for more efficient and performant observability.
Are you looking to enhance your MongoDB monitoring capabilities without the complexity of juggling multiple tools? In this blog post, we’ll guide you through the process of using OpenTelemetry and OpenObserve to effectively monitor your MongoDB metrics. By leveraging the MongoDB receiver of the OpenTelemetry Collector, you can collect metrics, build insightful dashboards, and generate alerts to ensure optimal performance.
MongoDB is a popular NoSQL database known for its flexibility, scalability, and high performance. It stores data in a document-oriented format, which makes it ideal for handling unstructured data. With features like horizontal scaling through sharding and robust replication capabilities, MongoDB is widely used in modern applications that require high throughput and quick data access.
Whether you're building applications for real-time analytics, content management, or Internet of Things (IoT) solutions, monitoring MongoDB is crucial to ensure optimal performance and resource utilization.
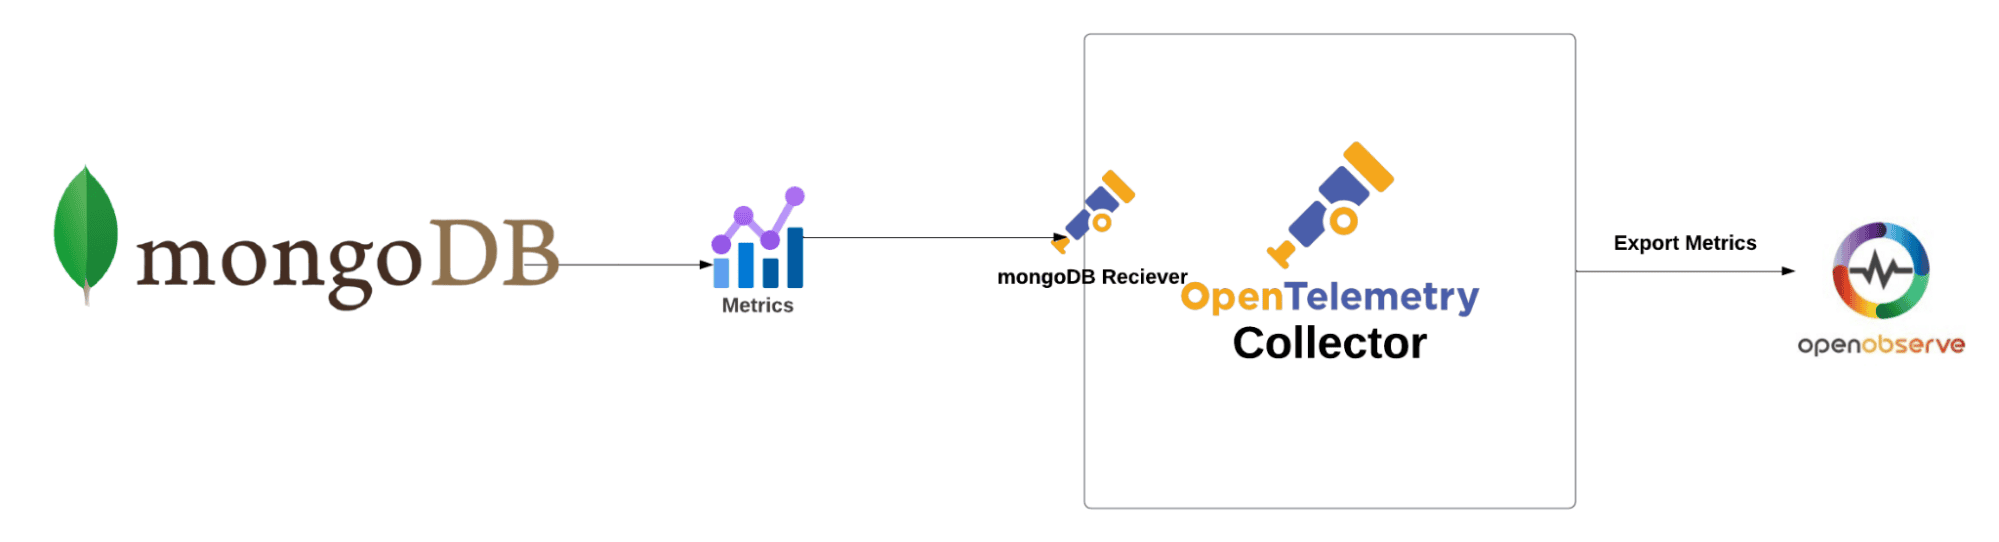
To effectively monitor MongoDB, we will utilize the OpenTelemetry Collector with the MongoDB receiver. This setup allows us to collect metrics from MongoDB instances and push them to OpenObserve, enabling us to visualize performance data and respond proactively to issues.
The MongoDB receiver fetches stats from a MongoDB instance using the Golang Mongo driver. Stats are collected via MongoDB's dbStats and serverStatus commands. The purpose of this receiver is to allow users to monitor metrics from standalone MongoDB clusters, including non-Atlas managed MongoDB servers.
Configuration:
hosts (default: [localhost:27017]): List of host:port or Unix domain socket endpoints.
mongod instance.mongod instances in the replica set configuration. If the replica_set field is specified, nodes will be autodiscovered.mongos hosts.username: If authentication is required, the user with clusterMonitor permissions can be provided here.
password: If authentication is required, the password can be provided here.
collection_interval (default: 1m): The interval at which metrics are collected. This value must be a string readable by Golang's time.ParseDuration. Valid time units are ns, us (or µs), ms, s, m, h.
initial_delay (default: 1s): Defines how long this receiver waits before starting.
replica_set: If the deployment of MongoDB is a replica set, this allows users to specify the replica set name for autodiscovery of other nodes.
timeout (default: 1m): The timeout for running commands against MongoDB.
tls: Controls TLS settings. By default, insecure settings are rejected, and certificate verification is enabled.
direct_connection: If true, the driver will not attempt to autodiscover other nodes and will connect directly to the specified host.
Here’s a sample configuration for the MongoDB receiver:
receivers:
  mongodb:
    hosts:
      - endpoint: localhost:27017
    username: otel
    password: password123
    collection_interval: 60s
    initial_delay: 1s
    tls:
      insecure: true
      insecure_skip_verify: true
Before diving into the setup, ensure you have the following:
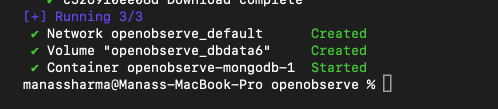
localhost:27017. You can verify all the MongoDB components are running too, see screenshot below for reference.Note: The MongoDB receiver supports versions 4.0 and above, including 5.0, 6.0, and 7.0.
Basic Understanding of OpenTelemetry: Familiarity with OpenTelemetry concepts will help you navigate the setup.
An Operational OpenObserve Instance: Ensure you have OpenObserve installed and running to visualize your metrics.
Next, we need to install the OpenTelemetry Collector.
NOTE: The default Otel Collector doesn't have all the receivers, including the MongoDB one we are going to use to collect data from the DB. It has support for receivers like Kafka, Prometheus, Jaeger, etc. So, instead of using opentelemetry-collector, we are going to use opentelemetry-collector-contrib.
Visit the OpenTelemetry Collector Contrib Releases page.
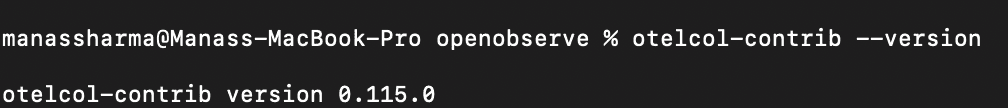
Download the latest release for your machine. You can use the following command in your terminal to download the Otel-Collector for macOS, replacing v0.115.1 with the latest version number:
curl --proto '=https' --tlsv1.2 -fOL https://github.com/open-telemetry/opentelemetry-collector-releases/releases/download/v0.115.1/otelcol-contrib_0.115.1_darwin_arm64.tar.gz
tar -xvf otelcol-contrib_0.115.1_darwin_arm64.tar.gz
sudo mv otelcol-contrib /usr/local/bin/
otelcol-contrib --version
Receivers in the OpenTelemetry Collector are responsible for collecting telemetry data from various sources. They act as the entry point for data into the collector, allowing it to gather metrics, logs, and traces from different systems. Each receiver is designed to handle specific types of data and protocols.
Next, you’ll need to create a configuration file named config.yaml. This file defines how the Collector will behave, including what data it will receive, how it will process that data, and where it will send it.
receivers:
  mongodb:
    hosts:
      - endpoint: localhost:27017
    username: otel
    password: password123
    collection_interval: 60s
    initial_delay: 1s
    tls:
      insecure: true
      insecure_skip_verify: true
processors:
  batch:
    send_batch_size: 10000
    timeout: 10s

exporters:
  otlphttp/openobserve:
    endpoint: YOUR_API_ENDPOINT
    headers:
      Authorization: Basic YOUR_AUTH_TOKEN
      stream-name: default

service:
  pipelines:
    metrics:
      receivers: [mongodb]
      processors: [batch]
      exporters: [otlphttp/openobserve]
Receivers: The MongoDB receiver collects metrics from your MongoDB instance. Ensure the hosts, username, and password match your MongoDB configuration.
Processors: The batch processors help manage and optimize data flow to exporters.
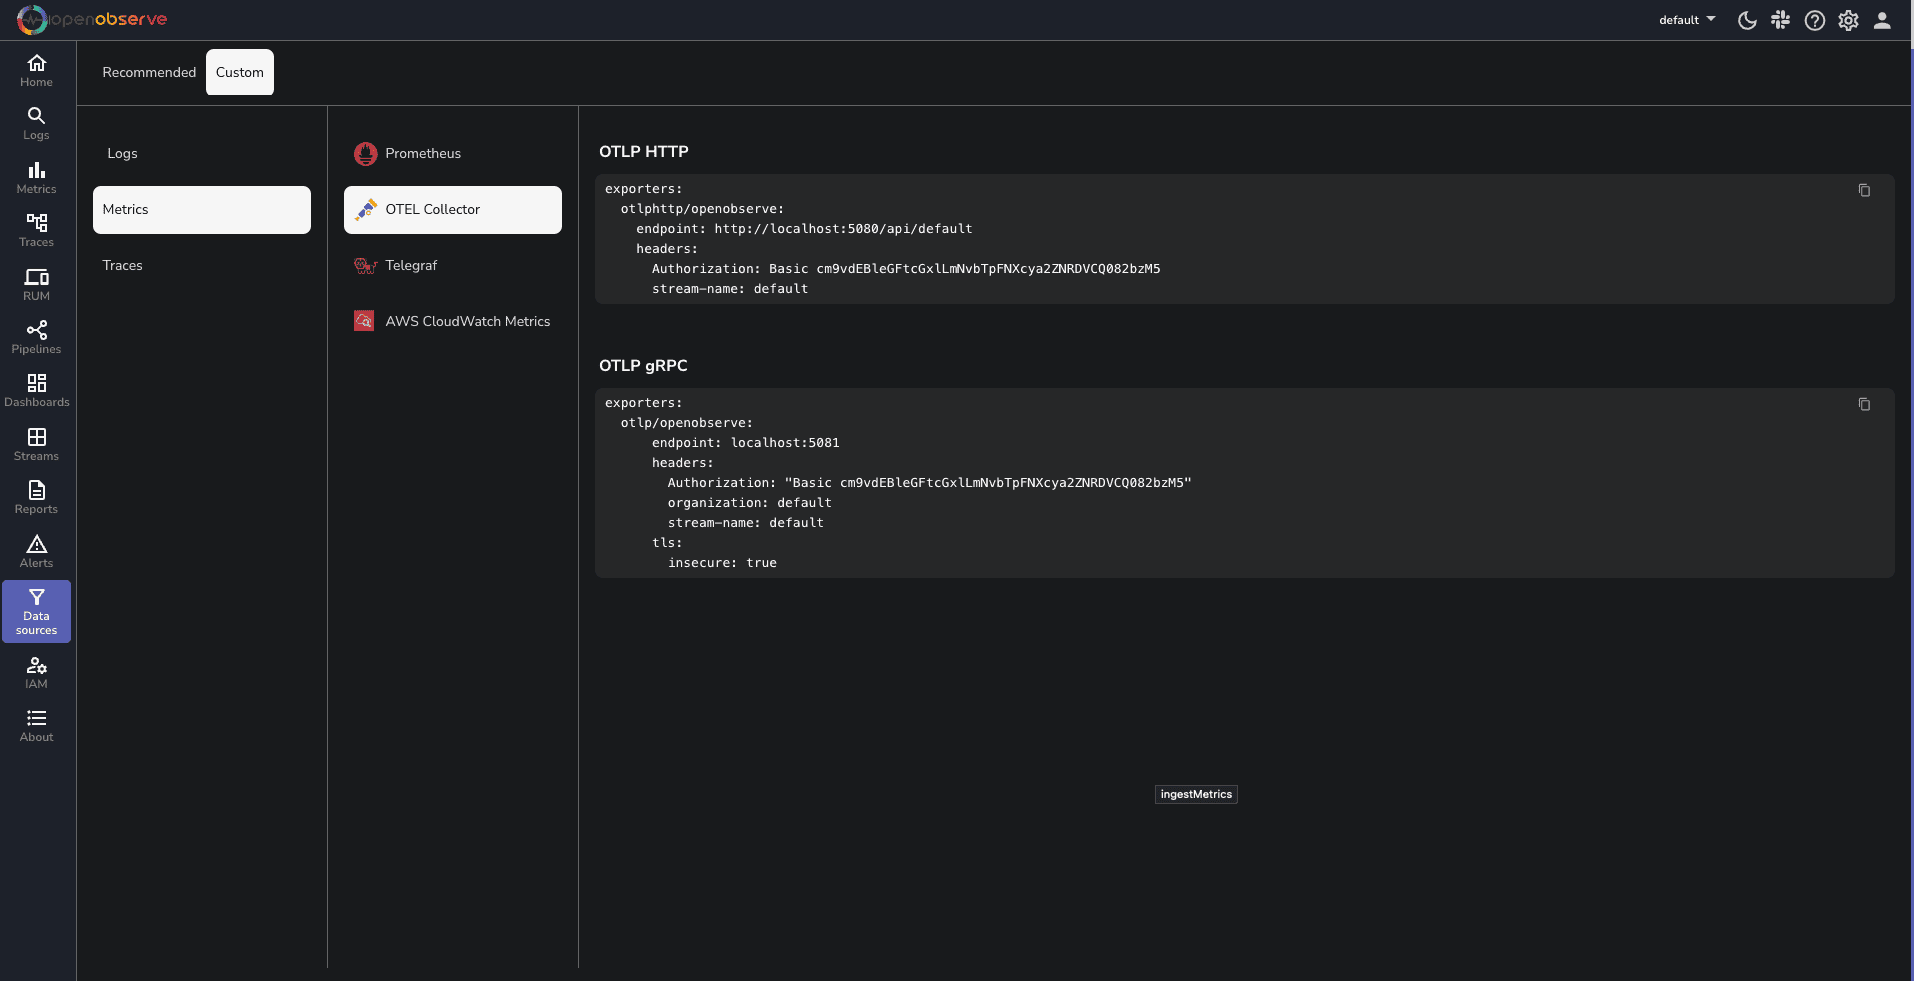
Exporters: The otlphttp/openobserve exporter sends the collected telemetry data to OpenObserve. Replace YOUR_API_ENDPOINT and YOUR_AUTH_TOKEN with your actual OpenObserve API endpoint and authentication token, which you can find in your Data Sources -> Custom - > Metrics -> Otel Collector
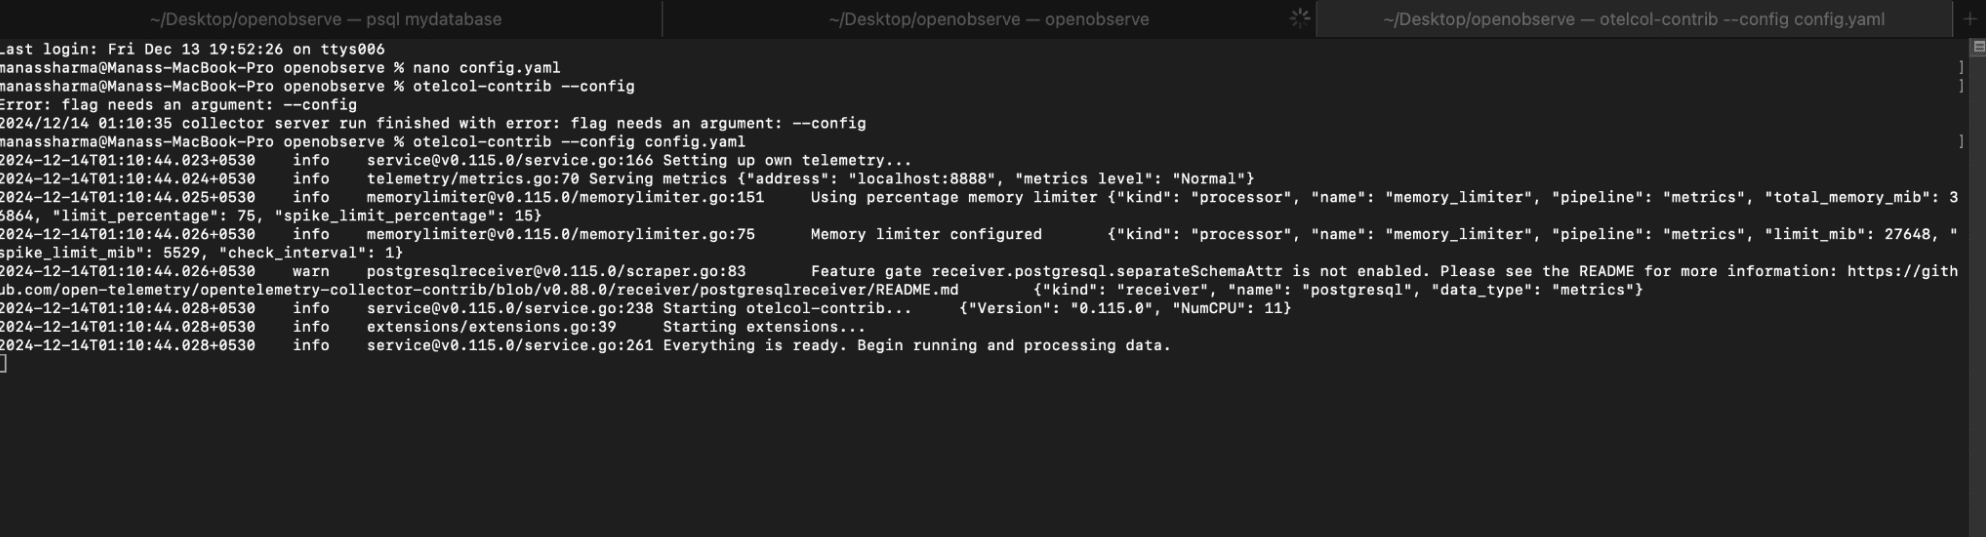
To run the OpenTelemetry Collector with the specified configuration, execute the following command in your terminal:
otelcol-contrib --config /path/to/your/config.yaml
Replace /path/to/your/config.yaml with the actual path to your configuration file.
You will get an output like the screenshot below:
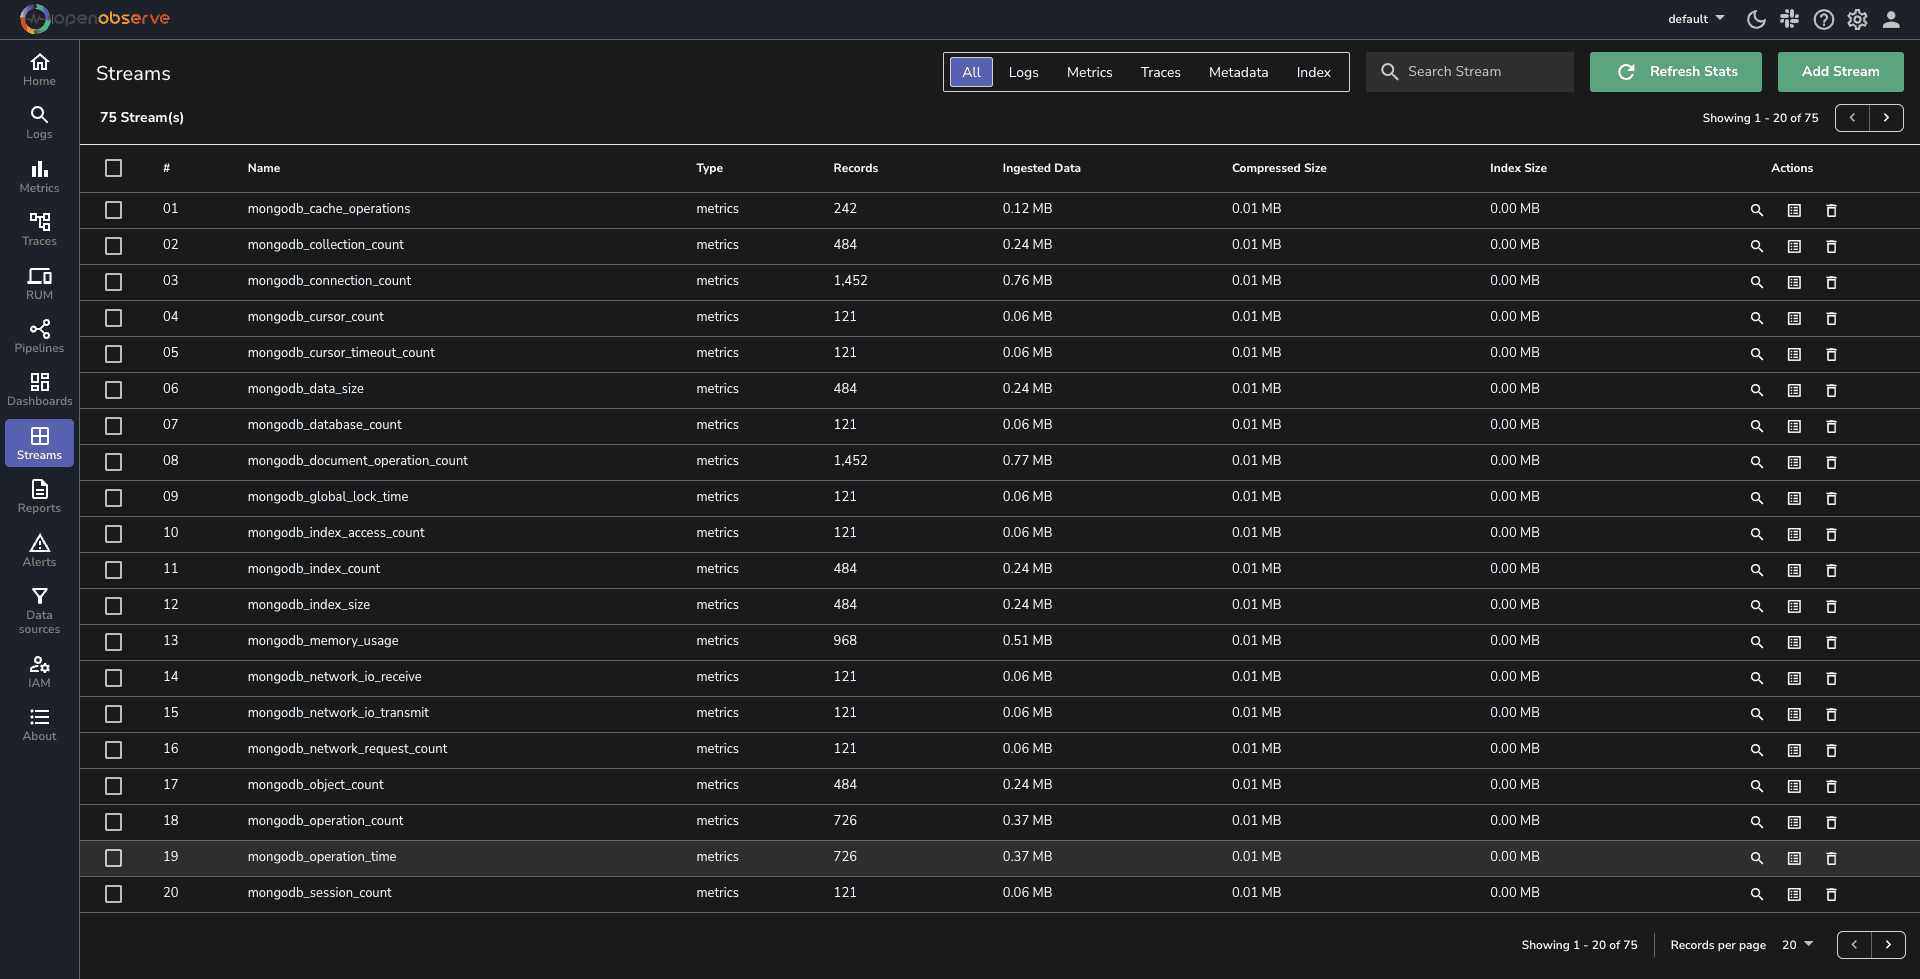
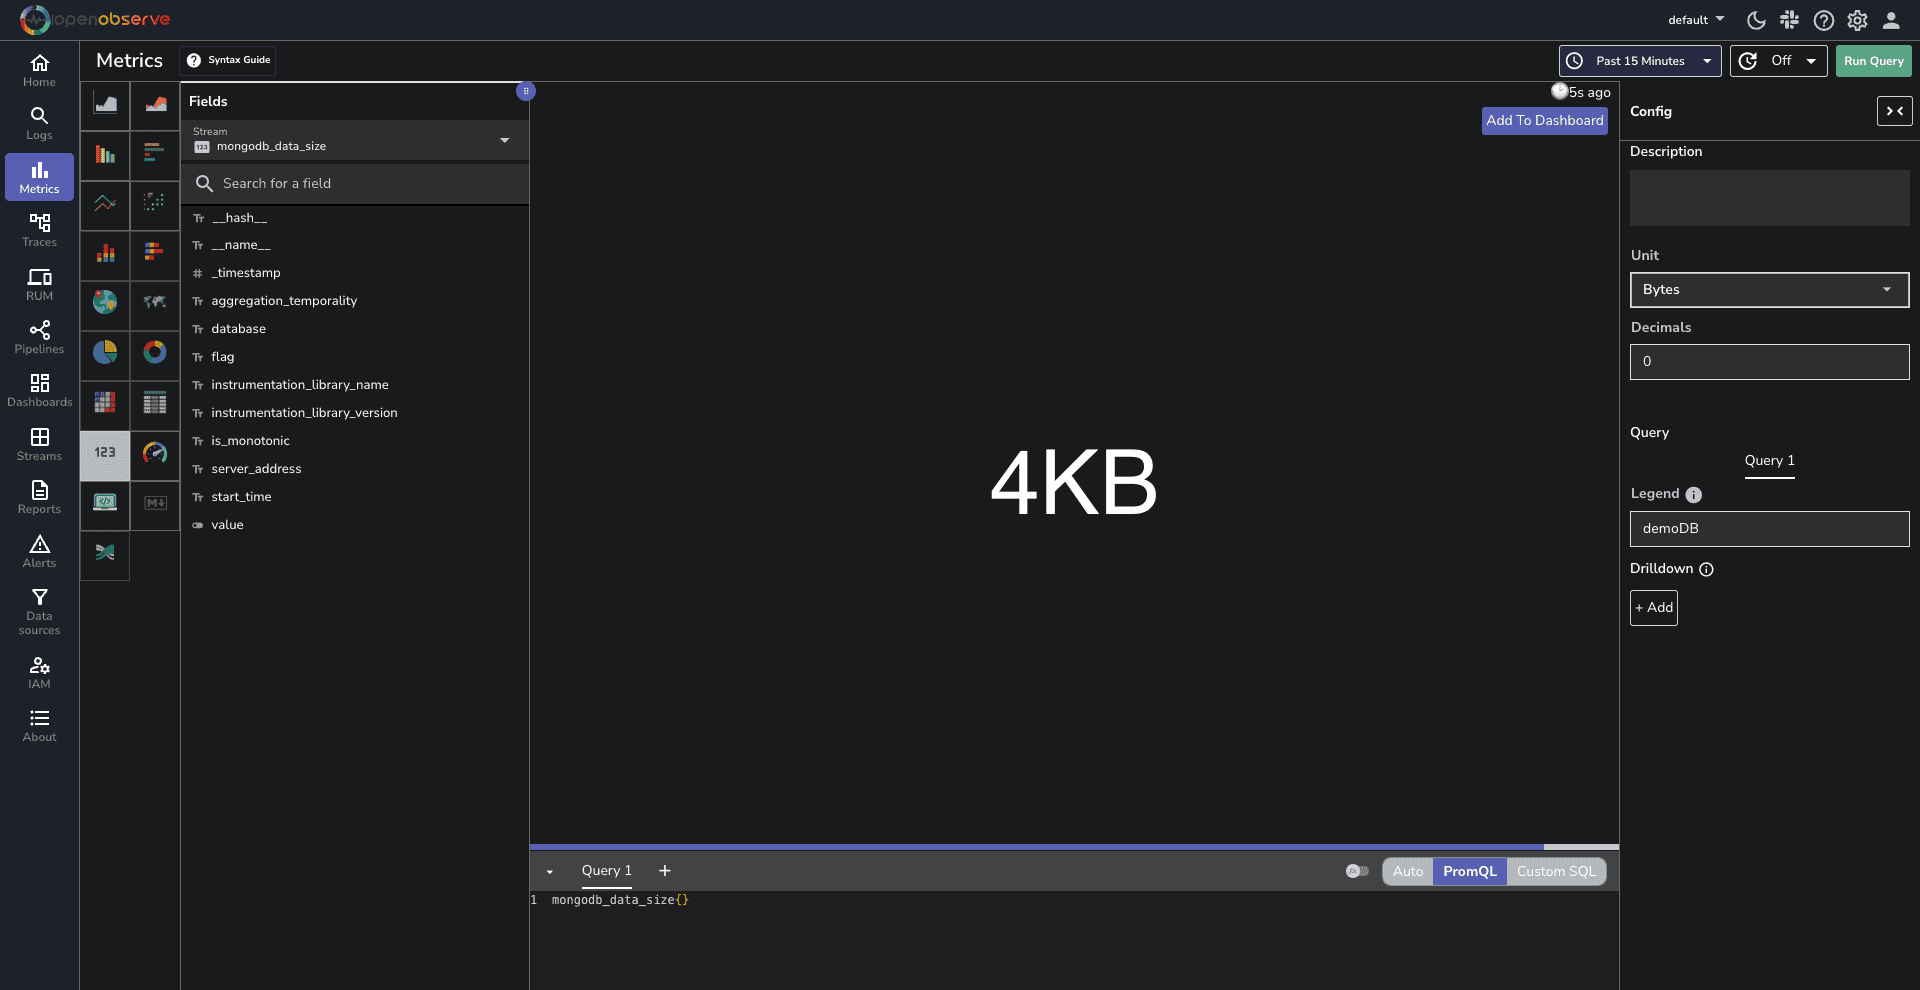
Once your setup is complete, navigate to the OpenObserve dashboard. Click on the Streams button in the sidebar to view the collected data streams.
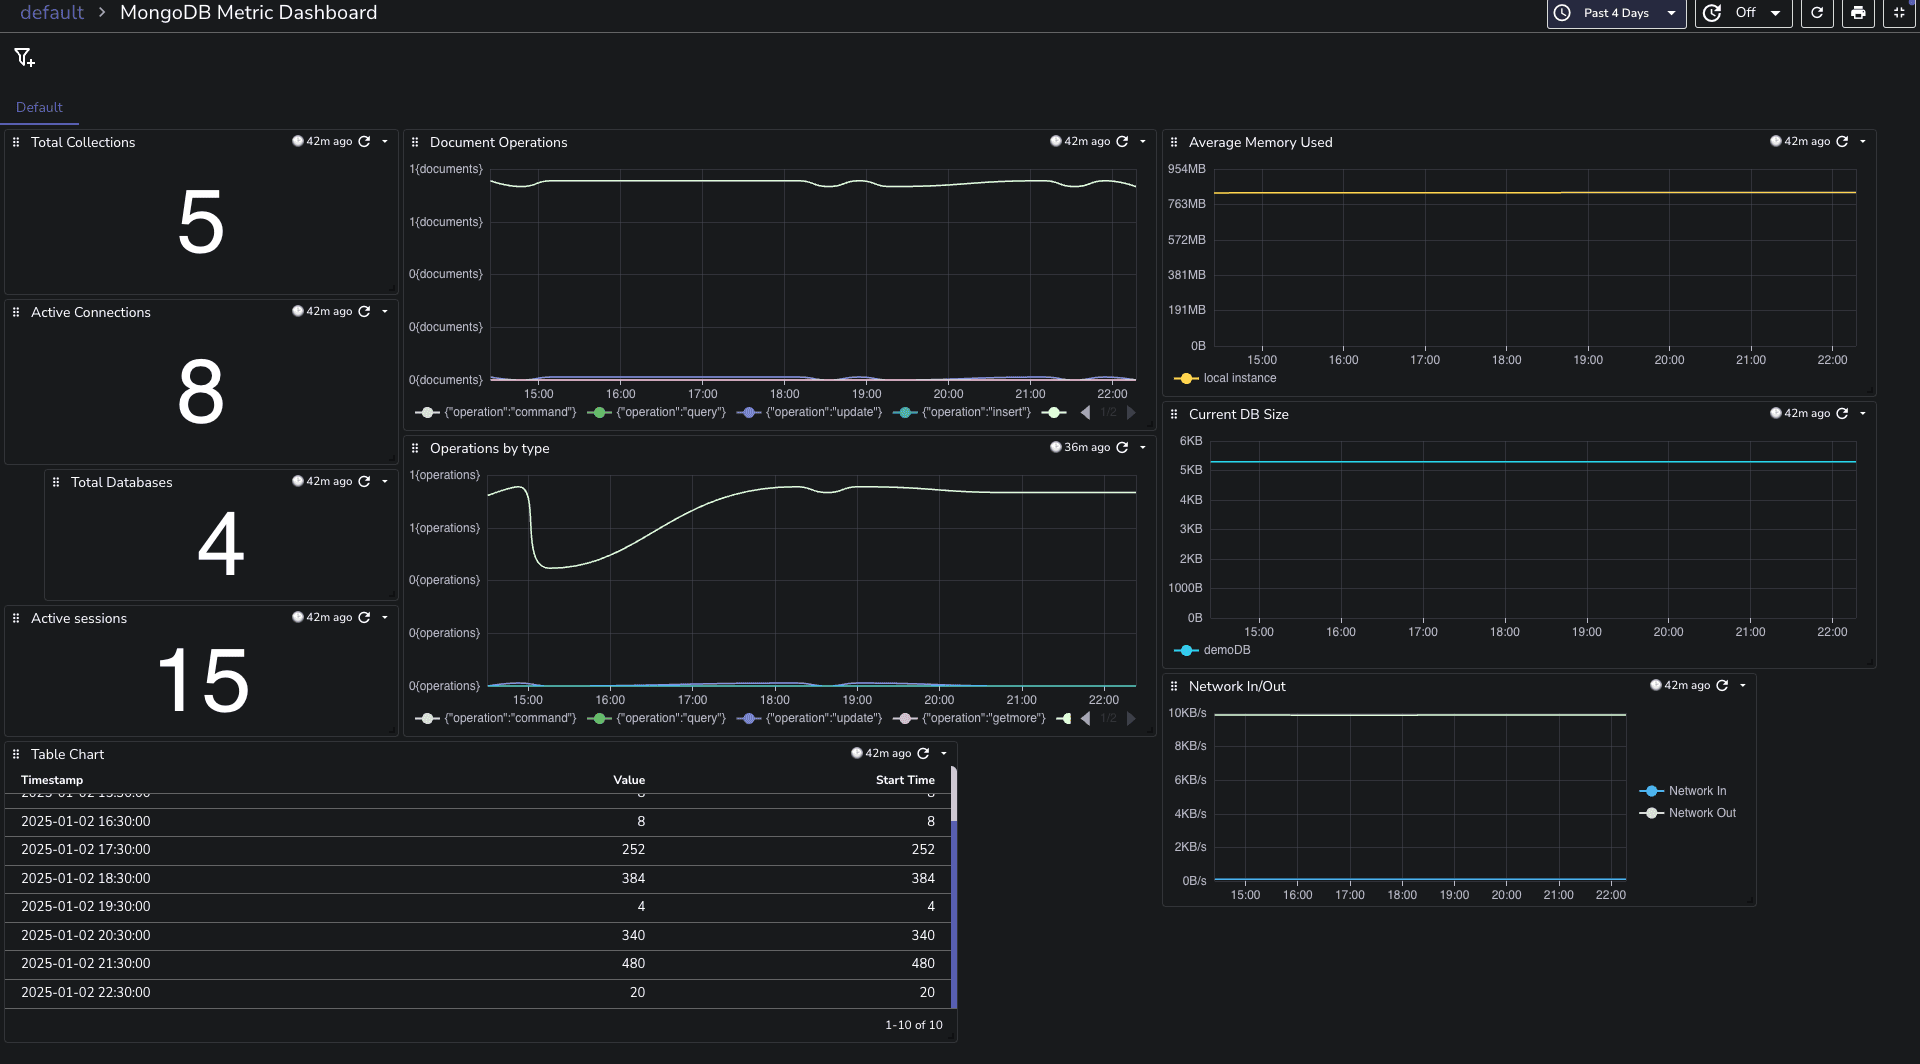
You can download the dashboards here.
If you encounter connection issues during setup, consider the following:
Check MongoDB Configuration: Ensure that your MongoDB instance is configured correctly, especially regarding authentication settings. Verify that the correct username and password are being used.
Network Settings: Ensure that your network settings allow traffic on the MongoDB port (default is 27017). Check for any firewall rules that might be blocking the connection.
TLS Configuration: If you're using TLS for secure connections, make sure to specify the necessary TLS parameters in your configuration.
Congratulations! You’ve successfully set up a MongoDB metrics monitoring system using OpenTelemetry and OpenObserve. This powerful combination allows you to gain valuable insights into your MongoDB performance, enabling you to make informed decisions to optimize your applications.
For a complete list of metrics collected by the MongoDB receiver, refer to the OpenTelemetry MongoDB Receiver Documentation.
Happy monitoring! 🚀
Manas is a passionate Dev and Cloud Advocate with a strong focus on cloud-native technologies, including observability, cloud, kubernetes, and opensource. building bridges between tech and community.