Monitor Your Redis Metrics with Opentelemetry and OpenObserve

Manas Sharma
December 19, 2024
7 min read
Don’t forget to share!
Try OpenObserve Cloud today for more efficient and performant observability.
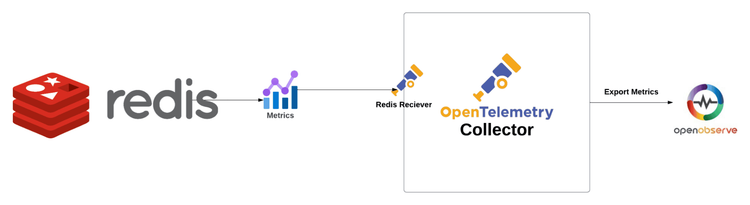
Are you looking to enhance your Redis database monitoring without the hassle of managing multiple tools? In this blog post, we’ll walk you through the process of using OpenTelemetry and OpenObserve to effectively monitor your Redis Metrics. By leveraging the Redis receiver of the OpenTelemetry Collector, you can easily scrape metrics and gain valuable insights into your database's health and performance
Redis is a powerful in-memory data structure store, often used as a database, cache, and message broker. It excels in performance, resilience, scalability, and durability, making it a staple in modern distributed IT infrastructures. Redis supports various data structures, including strings, hashes, lists, sets, and more, allowing developers to build applications with diverse data handling needs.
Whether you are building for the cloud or on-premise, Redis is widely utilized for:
The Redis receiver in the OpenTelemetry Collector is designed to retrieve performance metrics from a Redis instance by using the Redis INFO command. This command returns a wealth of information and statistics about the Redis server, which the receiver extracts and converts into OpenTelemetry metrics.
Here’s a sample configuration for the Redis receiver:
receivers:
  redis:
    endpoint: "localhost:6379"
    collection_interval: 10s
    password: ${env:REDIS_PASSWORD}
In this configuration:
The Redis receiver collects various metrics that provide insights into the performance and health of your Redis instance. These metrics can be broadly categorized into memory metrics and operational metrics.
The INFO command in Redis provides detailed statistics about memory usage, which are critical for detecting issues and optimizing throughput. Key memory-related metrics include:
These metrics help you understand how Redis is utilizing memory resources and can indicate potential performance issues.
The Redis receiver extracts various operational metrics from the INFO command output, The following metrics are emitted by default. Each of them can be disabled by applying the following configuration:
metrics:
  <metric_name>:
    enabled: false
These metrics provide insights into the operational efficiency of your Redis instance, allowing you to monitor performance trends and detect anomalies. Find the complete list of default metrics here.
Before we dive into the tutorial, ensure you have the following:
With these prerequisites in place, you’re ready to start monitoring your Redis performance!
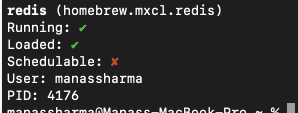
Make sure your Redis server is up and running. If you are running it locally, it should be accessible at localhost:6379.
To enhance security, consider setting up a password for your Redis instance. You can do this by modifying the redis.conf file, Add the following line. The location of this file can vary, but it is typically found in the Redis data directory. :
requirepass yourpassword
Replace yourpassword with a strong password of your choice. After making this change, restart your Redis server for the new configuration to take effect.
Next, we need to install the OpenTelemetry Collector.
NOTE: The default Otel Collector doesn't have all the receivers, including the Redis one we are going to use to collect metrics from the DB. It has support for receivers like Kafka, Prometheus, Jaeger, etc. So, instead of using opentelemetry-collector, we are going to use opentelemetry-collector-contrib.
Visit the OpenTelemetry Collector Contrib Releases page.
Download the latest release for your machine. You can use the following command in your terminal, replacing v0.115.1 with the latest version number:
curl --proto '=https' --tlsv1.2 -fOL https://github.com/open-telemetry/opentelemetry-collector-releases/releases/download/v0.115.1/otelcol-contrib_0.115.1_darwin_arm64.tar.gz
tar -xvf otelcol-contrib_0.115.1_darwin_arm64.tar.gz
sudo mv otelcol-contrib /usr/local/bin/
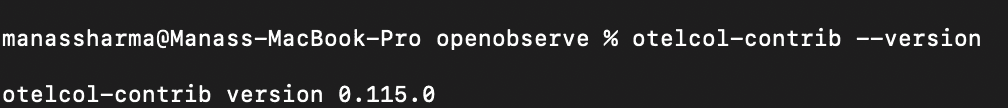
otelcol-contrib --version
Receivers in the OpenTelemetry Collector are responsible for collecting telemetry data from various sources. They act as the entry point for data into the collector, allowing it to gather metrics, logs, and traces from different systems. Each receiver is designed to handle specific types of data and protocols.
Next, you’ll need to create a configuration file named config.yaml. This file defines how the Collector will behave, including what data it will receive, how it will process that data, and where it will send it.
receivers:
  redis:
    endpoint: "localhost:6379"
    collection_interval: 10s
    password: ${env:REDIS_PASSWORD}

processors:
 batch:
    send_batch_size: 10000
    send_batch_max_size: 11000
    timeout: 10s

exporters:
  otlphttp/openobserve:
    endpoint: http://localhost:5080/api/default
    headers:
      Authorization: Basic YOUR_AUTH_TOKEN
      stream-name: default

service:
  pipelines:
    metrics:
      receivers: [redis]
      processors: [batch]
      exporters: [otlphttp/openobserve]
Receivers: The redis receiver collects metrics from your Redis instance. Ensure the endpoint and password match your Redis configuration.
Processors: The batch processors help manage and optimize data flow to exporters.
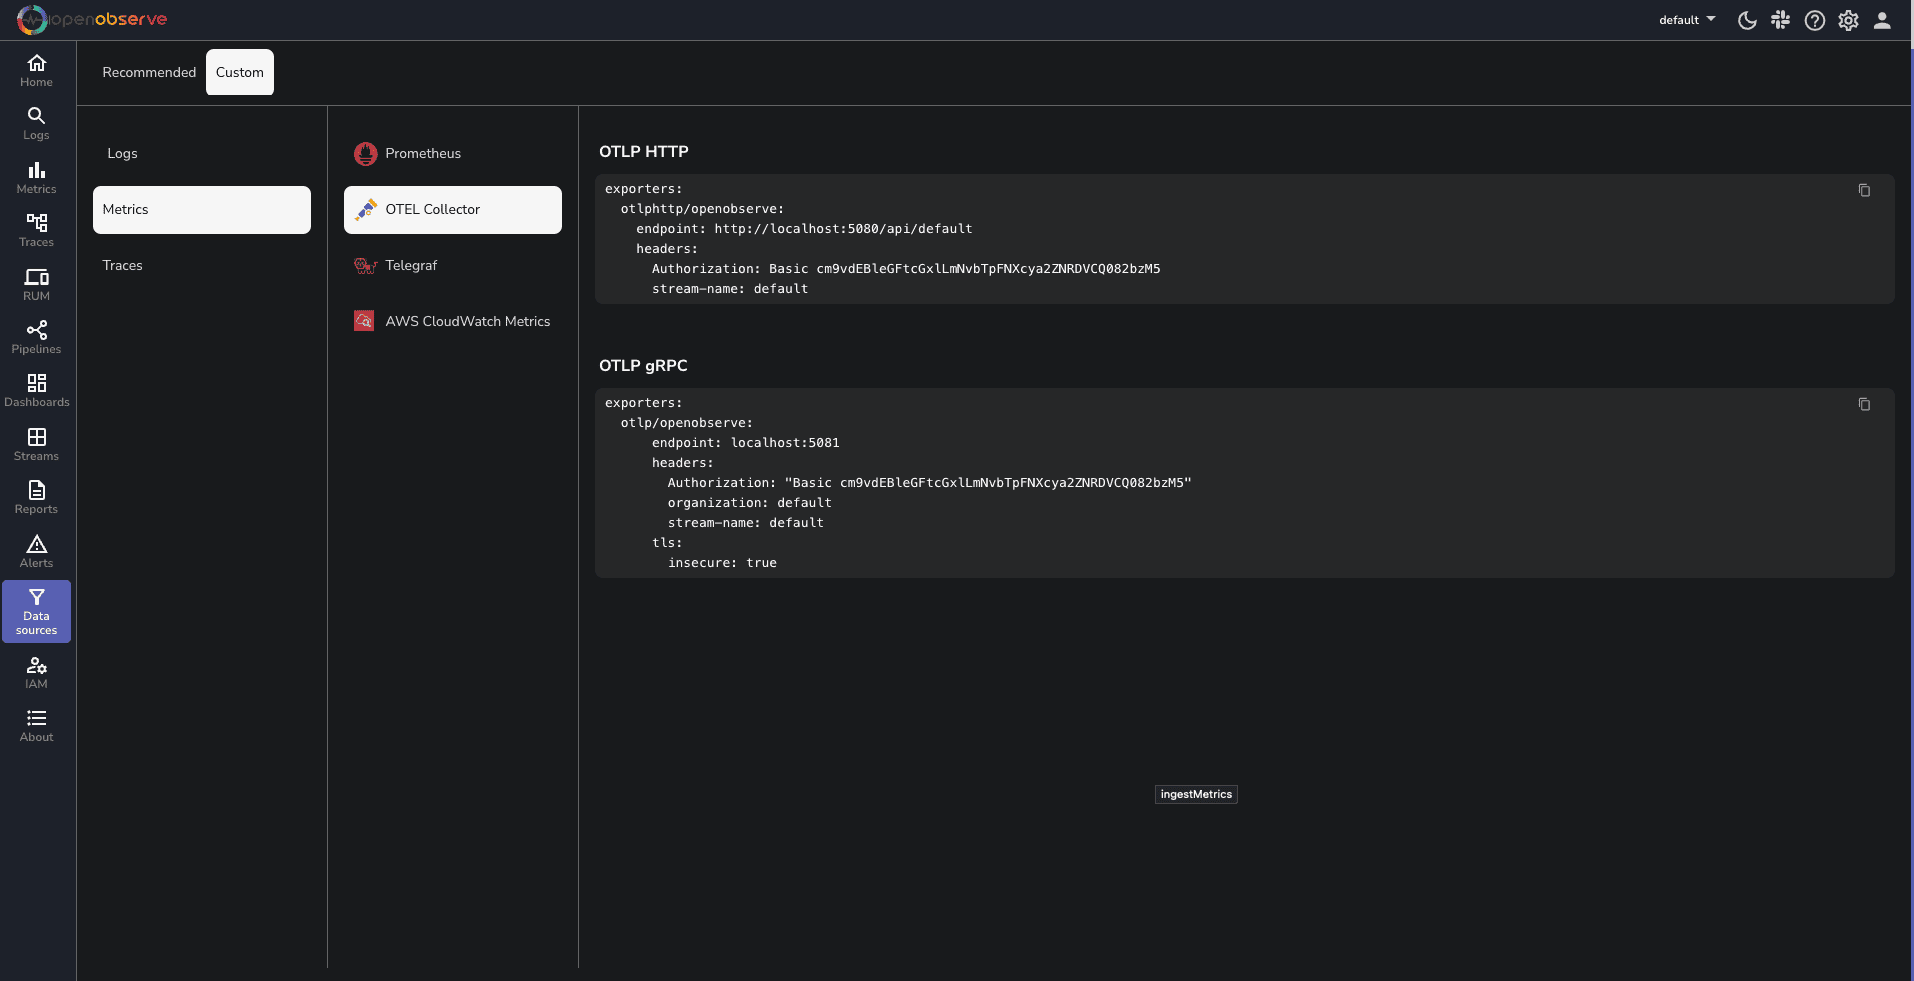
Exporters: The otlphttp/openobserve exporter sends the collected telemetry data to OpenObserve. Replace YOUR_API_ENDPOINT and YOUR_AUTH_TOKEN with your actual OpenObserve API endpoint and authentication token, which you can find in your Data Sources -> Custom - > Metrics -> Otel Collector
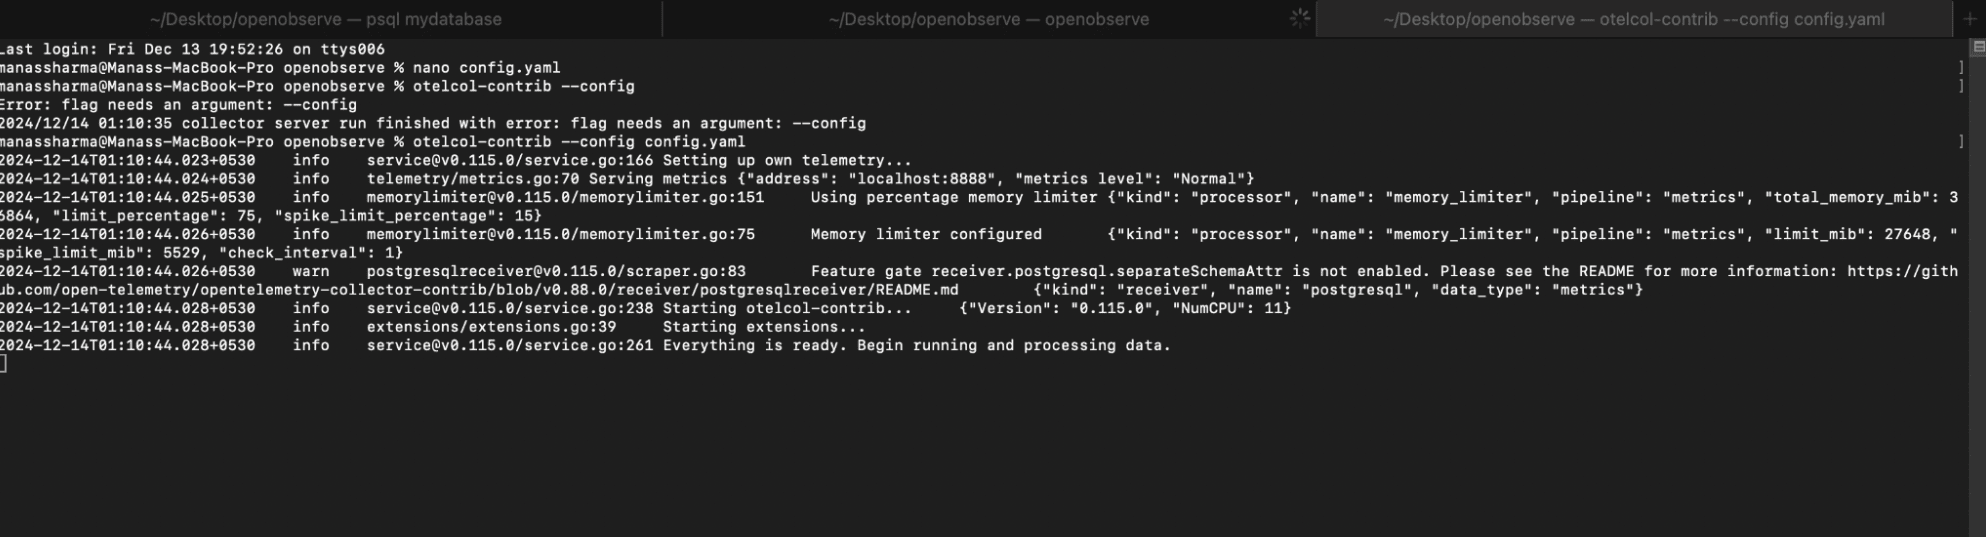
To run the OpenTelemetry Collector with the specified configuration, execute the following command in your terminal:
otelcol-contrib --config /path/to/your/config.yaml
Replace /path/to/your/config.yaml with the actual path to your configuration file.
You will get a Output similar to this Screenshot
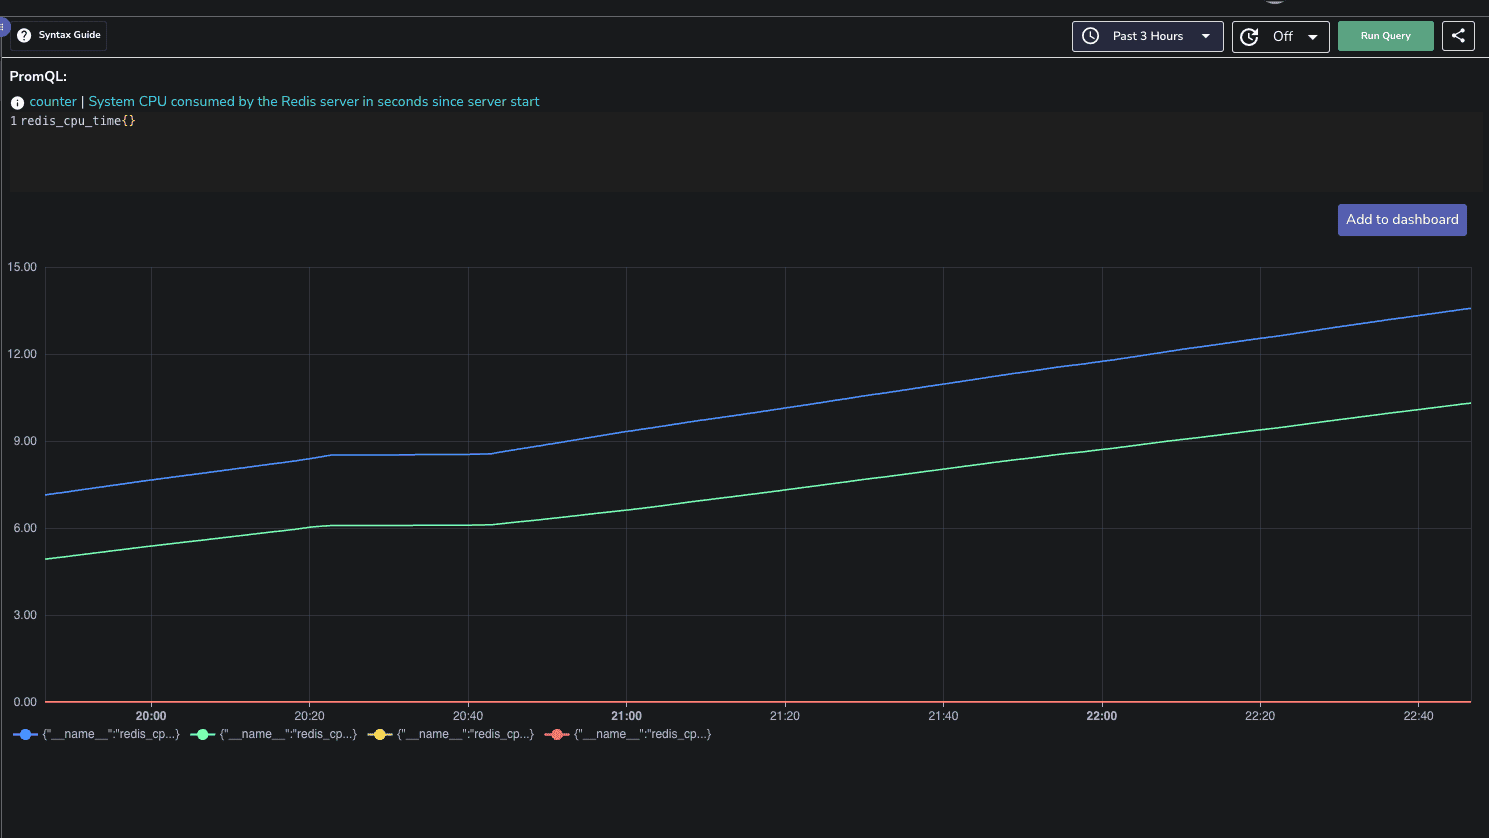
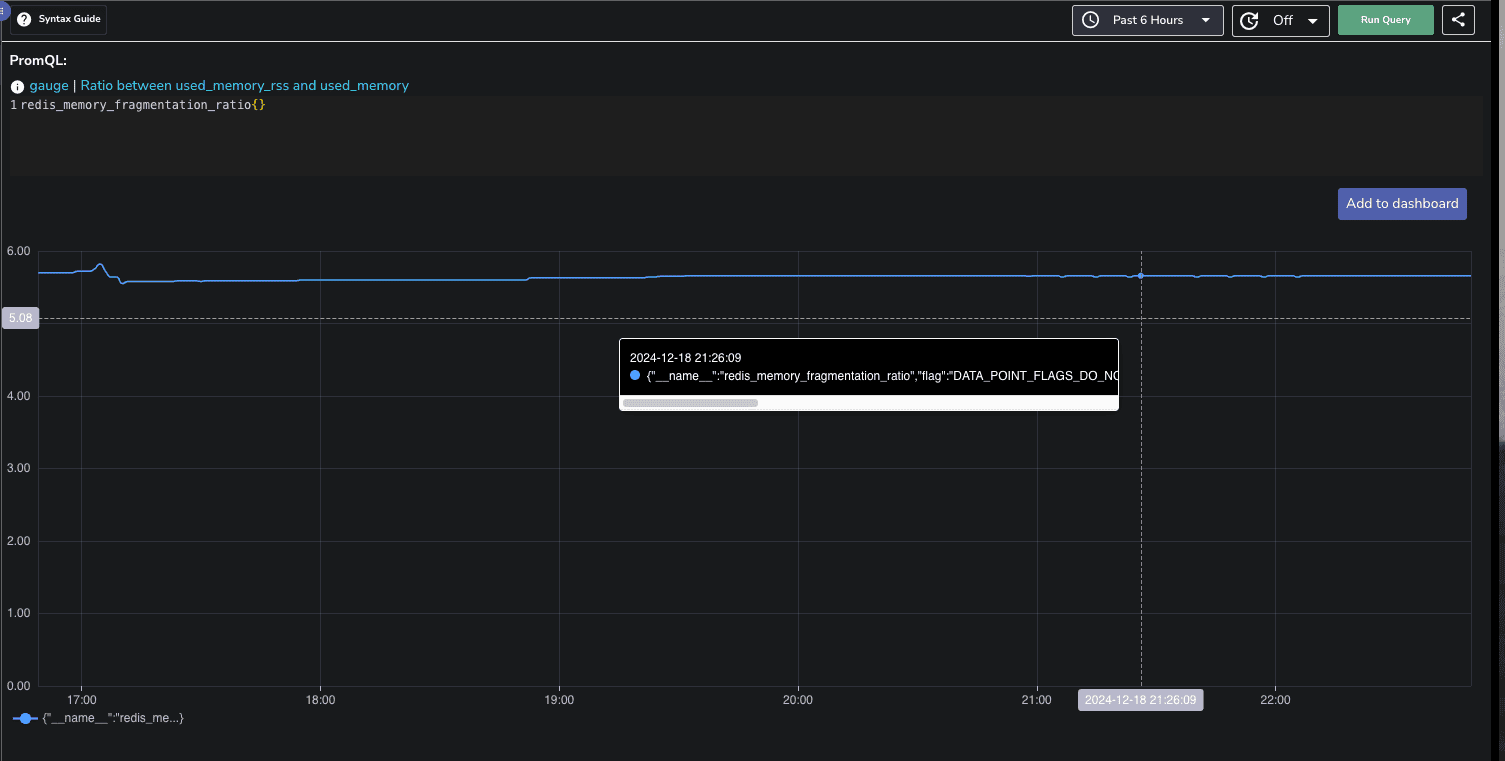
Once your setup is complete, navigate to the OpenObserve dashboard. Click on the "Streams" button in the sidebar to view the collected data streams.
To create a new dashboard, click on the Dashboard button and select New Dashboard. Give it an appropriate name and description.
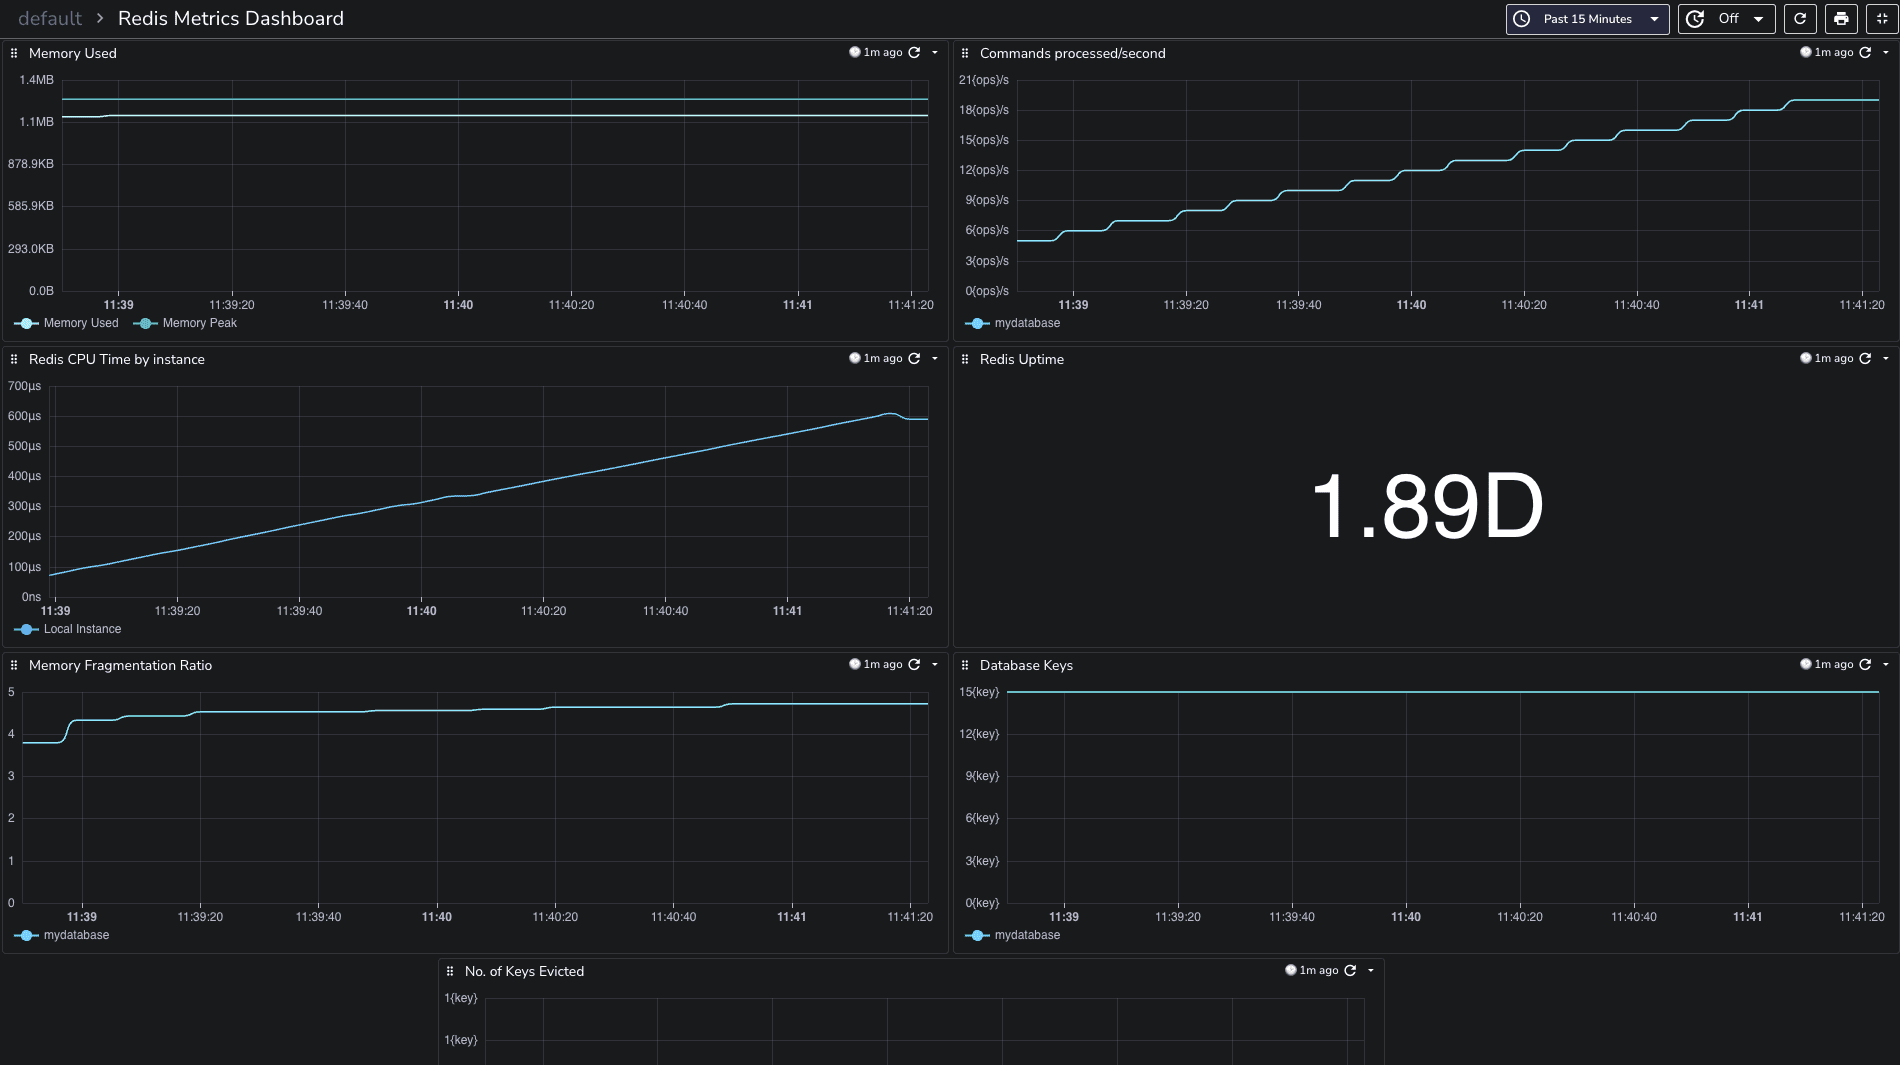
You can download the dashboards here.
If you encounter connection issues while setting up your Redis monitoring, follow these steps:
Check Redis Configuration: Ensure that your Redis instance is configured correctly, especially regarding authentication settings. Verify that the correct password (if required) is being used.
TLS Configuration: If you're using TLS for secure connections, make sure to specify the necessary TLS parameters in your configuration. Here’s an example configuration snippet:
  tls:
     insecure: false
     ca_file: /path/to/ca.crt
     cert_file: /path/to/client.crt
     key_file: /path/to/client.key
Congratulations! You’ve successfully set up a redis metrics monitoring system using OpenTelemetry and OpenObserve. This powerful combination allows you to gain valuable insights into your Redis performance, enabling you to make informed decisions to optimize your applications.
Happy monitoring! 🚀
Manas is a passionate Dev and Cloud Advocate with a strong focus on cloud-native technologies, including observability, cloud, kubernetes, and opensource. building bridges between tech and community.


