Simplifying Kubernetes Monitoring with OpenTelemetry and OpenObserve


Try OpenObserve Cloud today for more efficient and performant observability.
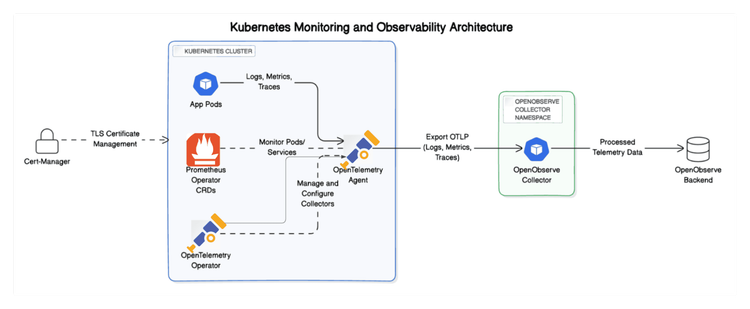
Kubernetes monitoring is fundamentally different from traditional monitoring approaches. In a conventional setup, the focus is often on the infrastructure level—ensuring that servers, databases, and network components are operational. However, Kubernetes abstracts much of this complexity, allowing developers to concentrate on the application level. Instead of merely checking if the application is alive, Kubernetes monitoring requires a comprehensive view of the entire ecosystem, including interactions between microservices, resource utilization, and overall application performance.
The dynamic nature of Kubernetes adds layers of complexity to monitoring efforts. Pods may come and go, services can scale up or down, and configurations can change frequently. This necessitates a new approach to monitoring that captures telemetry data across different layers of the Kubernetes stack. Enter OpenTelemetry—an open-source observability framework that provides end-to-end visibility into Kubernetes environments, enhancing our understanding of system performance, facilitating troubleshooting, and ensuring smooth application operation.
The OpenTelemetry Operator is a vital tool in the Kubernetes monitoring landscape. It collects telemetry data—logs, metrics, and traces—from your Kubernetes cluster by utilizing Kubernetes Custom Resource Definitions (CRDs). This operator configures the OpenTelemetry Collector, a versatile telemetry agent that processes and exports data to various backends, including Prometheus, Jaeger, and OpenObserve.
OpenObserve is a robust open-source observability platform designed to simplify the entire Kubernetes observability process. It encompasses all stages—collecting, processing, storing, visualizing, and analyzing telemetry data. With OpenObserve, developers can monitor and troubleshoot Kubernetes applications with minimal configuration and overhead, enabling rapid setup and deployment.
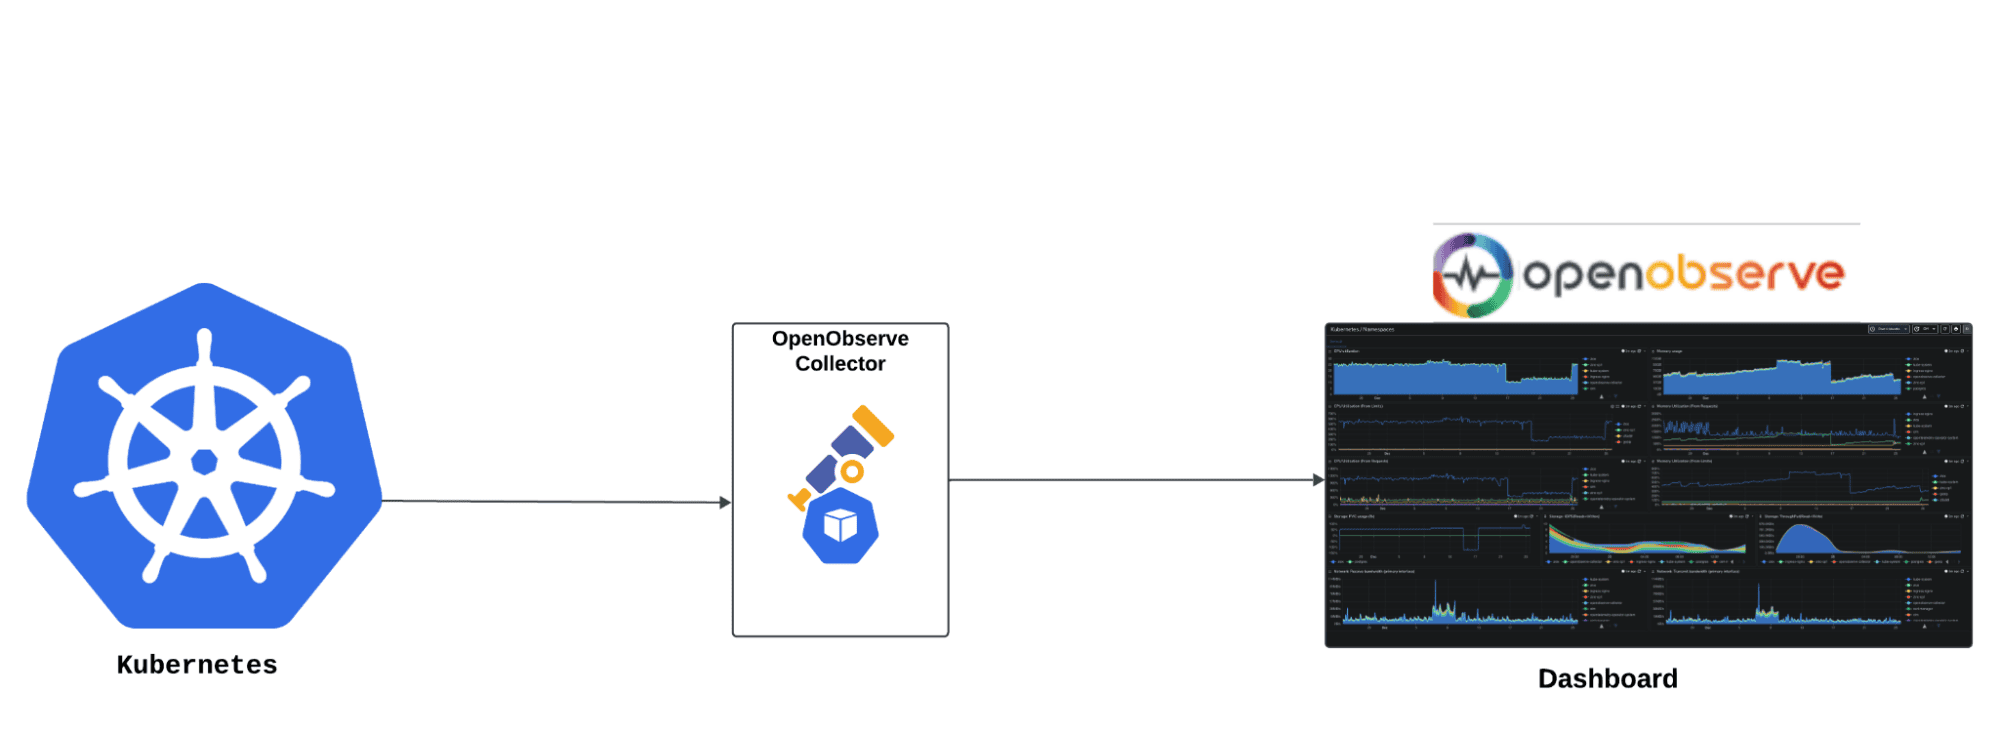
A standout feature of OpenObserve is the OpenObserve Collector(A preconfigured otel-collector with best practices to capture all the signals), which provides out-of-the-box capabilities for gathering observability data within your Kubernetes cluster. When deployed, the collector offers a range of essential functions:
For various programming languages, you can leverage OpenTelemetry's auto-instrumentation by setting specific annotations in your pod or namespace configurations:
instrumentation.opentelemetry.io/inject-java: "openobserve-collector/openobserve-java"
instrumentation.opentelemetry.io/inject-dotnet: "openobserve-collector/openobserve-dotnet"
instrumentation.opentelemetry.io/inject-nodejs: "openobserve-collector/openobserve-nodejs"
instrumentation.opentelemetry.io/inject-python: "openobserve-collector/openobserve-python"
instrumentation.opentelemetry.io/inject-go: "openobserve-collector/openobserve-go"
instrumentation.opentelemetry.io/otel-go-auto-target-exe: "/path/to/container/executable"
You can find full example for auto-instrumentation hotcommerce repository.
In the following sections, we will guide you through the installation process step-by-step, ensuring that you have a fully functional monitoring setup in your Kubernetes environment. Let’s get started!
Ensure you have the following prerequisites before proceeding:
You can find the below steps in the Data sources section as well once you log in to OpenOsberve
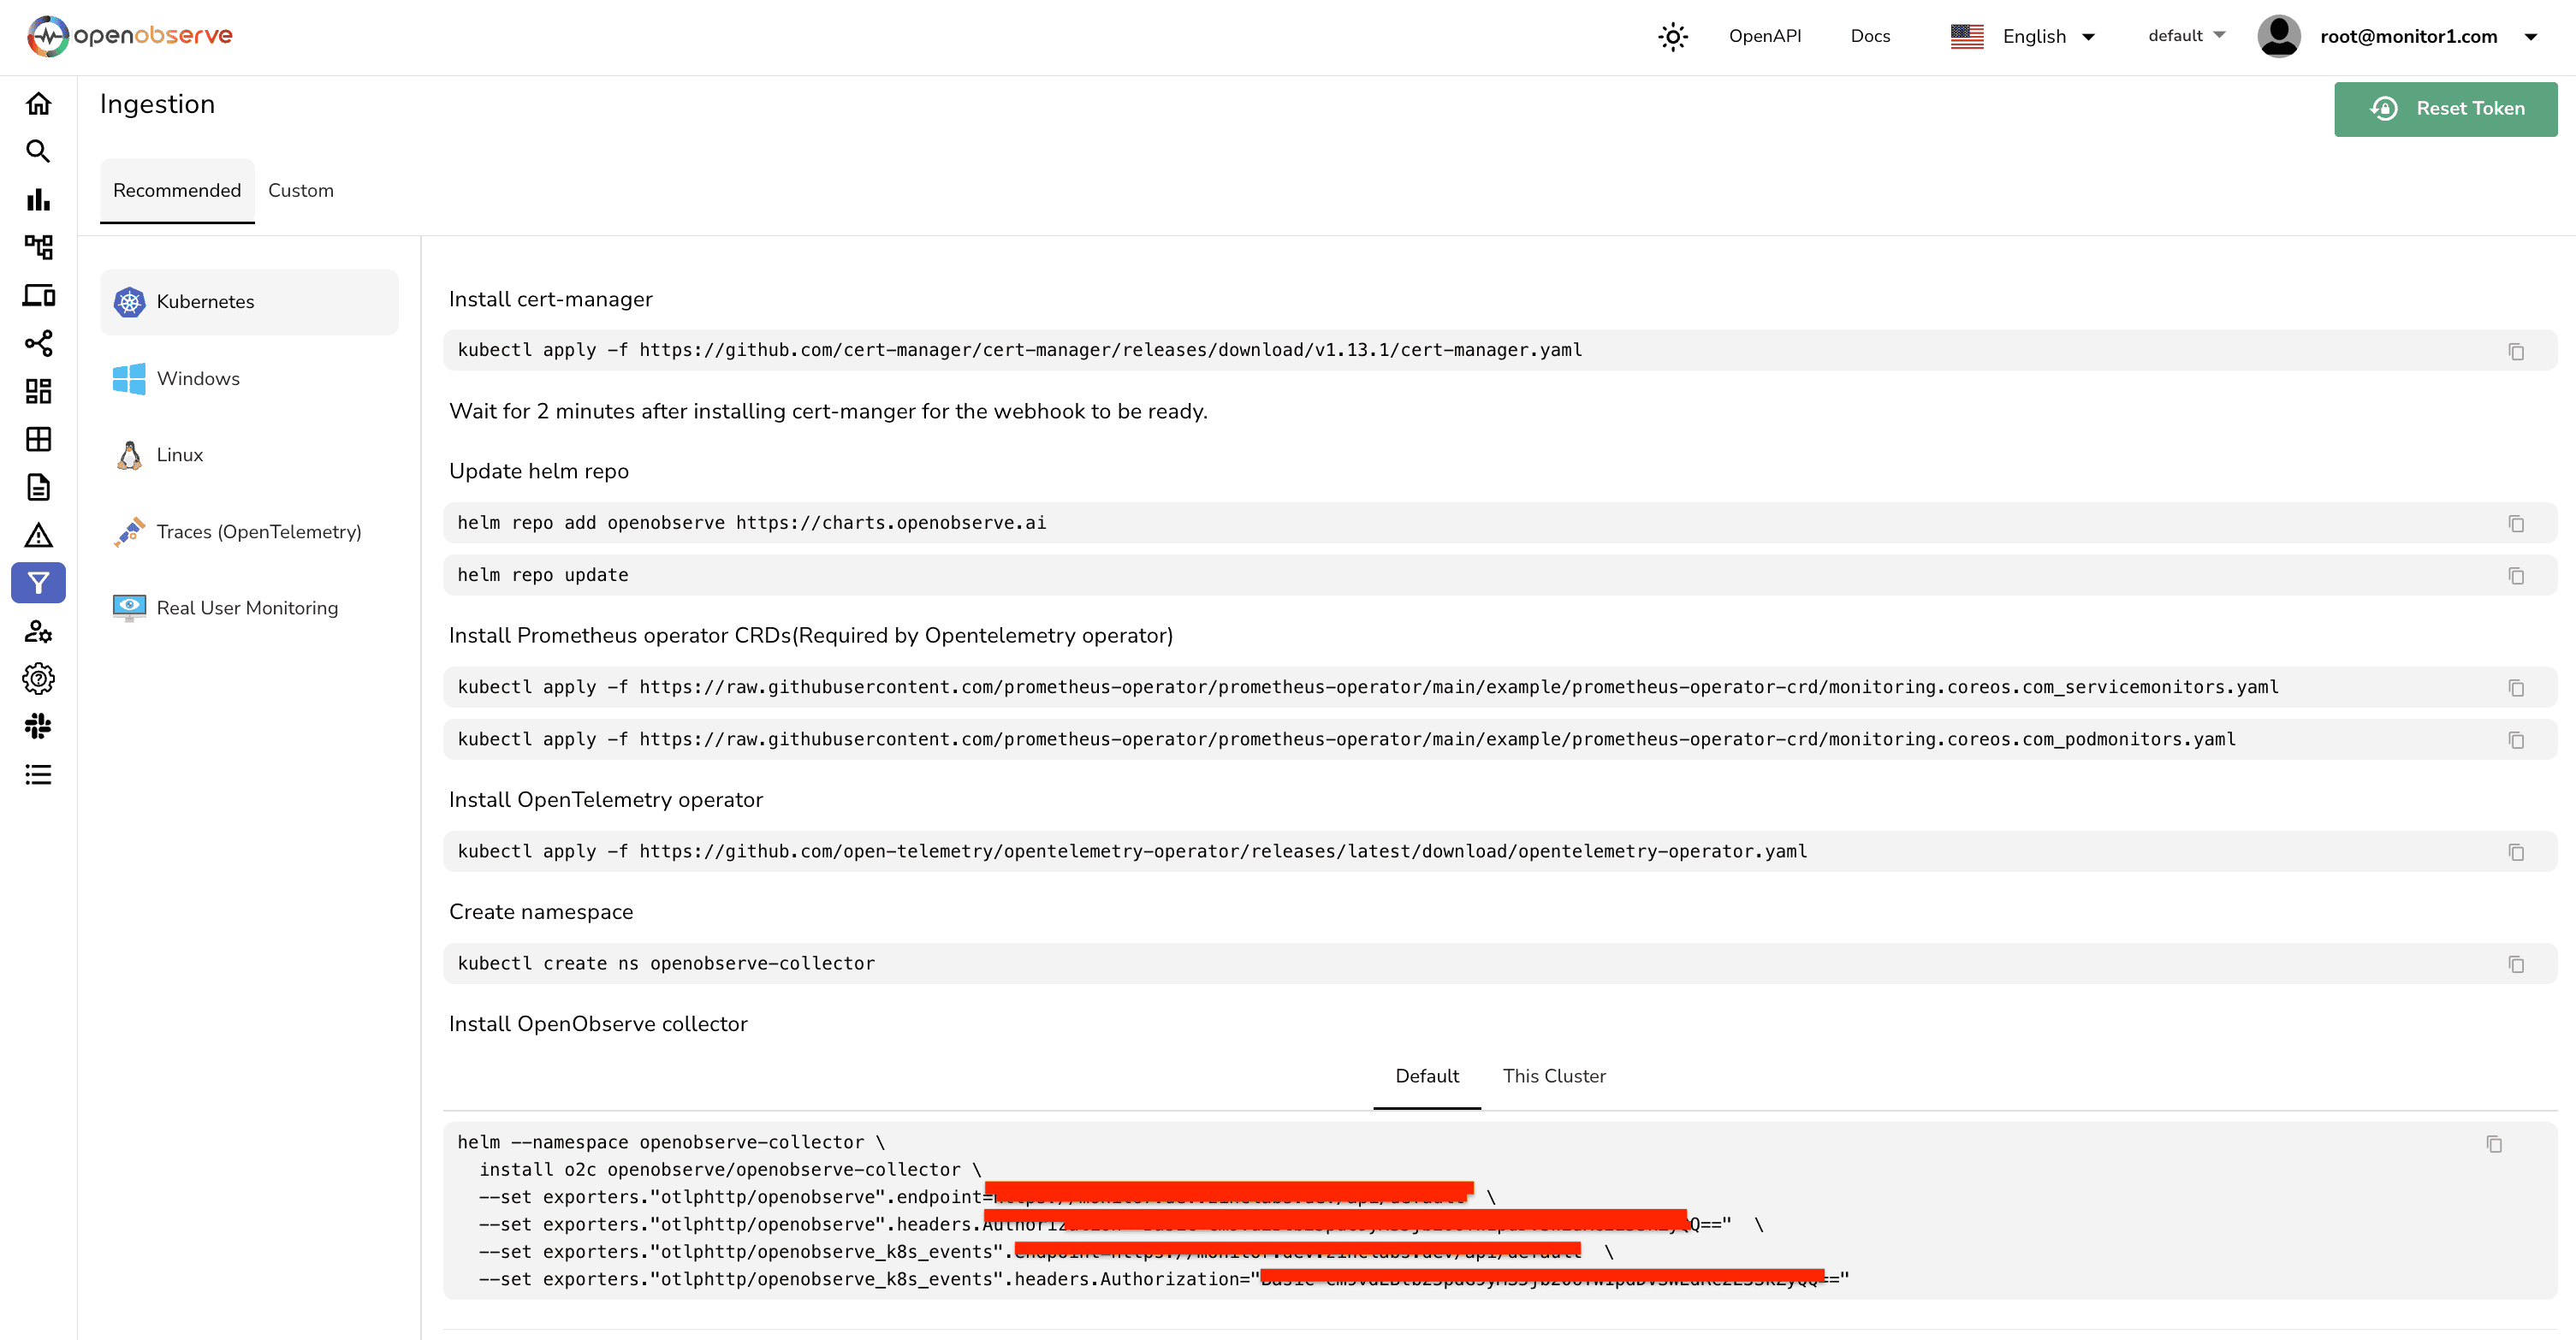
Cert-Manager is a tool to automate the management of TLS certificates within Kubernetes. We need it for securing communication between components:
kubectl apply -f https://github.com/cert-manager/cert-manager/releases/download/v1.13.1/cert-manager.yaml
Cert-Manager will handle the certificates and ensure secure connections between services.
Add the OpenObserve Helm repository to make the OpenObserve components available for installation
helm repo add openobserve https://charts.openobserve.ai
Helm makes it easy to deploy and manage OpenObserve components in your Kubernetes cluster.
The Prometheus Operator manages Kubernetes monitoring components like ServiceMonitors and PodMonitors. Apply these CustomResourceDefinitions (CRDs) to enable Kubernetes-native metrics collection:
kubectl apply -f https://raw.githubusercontent.com/prometheus-operator/prometheus-operator/main/example/prometheus-operator-crd/monitoring.coreos.com_servicemonitors.yaml

kubectl apply -f https://raw.githubusercontent.com/prometheus-operator/prometheus-operator/main/example/prometheus-operator-crd/monitoring.coreos.com_podmonitors.yaml
This step is essential for monitoring pods and services and pushing their metrics to OpenObserve.
OpenTelemetry Operator is an open-source observability tool designed to collect, process, and export metrics and logs from Kubernetes:
kubectl apply -f https://github.com/open-telemetry/opentelemetry-operator/releases/latest/download/opentelemetry-operator.yaml
The OpenTelemetry Operator will be responsible for collecting telemetry data (logs, metrics, and traces) from your Kubernetes cluster.
To isolate the OpenObserve collector deployment, create a separate namespace
kubectl create ns openobserve-collector
This step helps organize resources and manage permissions more effectively.
Now, we will install the OpenObserve collector using Helm:
Copy the below command from the Data Sources section of OpenObserve once you login, that will provide you with prefilled auth_token .
helm --namespace openobserve-collector \
  install o2c openobserve/openobserve-collector \
  --set exporters."otlphttp/openobserve".endpoint=http://localhost:5080/api/default  \
  --set exporters."otlphttp/openobserve".headers.Authorization="Basic <auth_token>"  \
  --set exporters."otlphttp/openobserve_k8s_events".endpoint=http://localhost:5080/api/default  \
  --set exporters."otlphttp/openobserve_k8s_events".headers.Authorization="Basic <auth_token>"
This command configures the OpenObserve collector to use the OTLP HTTP exporter to send logs and Kubernetes events directly to the specified OpenObserve endpoint. Ensure the provided authorization token is secure and base64-encoded.
Once the installation is complete, check if the pods are running successfully:
kubectl get pods -n openobserve-collector
You should see OpenObserve Collector pods in the Running state. If not, inspect the logs to diagnose issues
kubectl logs -f <pod-name> -n openobserve-collector
The OpenObserve (O2) Collector is your go-to tool for simplifying Kubernetes monitoring. It empowers you to keep an eye on critical aspects of your cluster, helping you ensure everything runs smoothly. Here’s what you can monitor:
| Monitoring Aspect | Description |
|---|---|
| Resource Utilization | O2 tracks CPU, memory, and disk usage across nodes, pods, and containers. This means you can easily spot any resource bottlenecks and ensure efficient resource usage. No more guessing—get real-time insights to optimize performance and prevent overloads! |
| Storage Insights | Storage health is key in Kubernetes. O2 monitors the status and capacity of your persistent volumes (PVs) and their claims (PVCs). It keeps tabs on read and write operations, ensuring your applications have the storage they need without any hiccups. |
| Network Performance | O2 helps you monitor network traffic, including received and transmitted bandwidth. Understanding how data flows in and out of your pods and nodes is crucial for troubleshooting issues and maintaining smooth communication across your applications. |
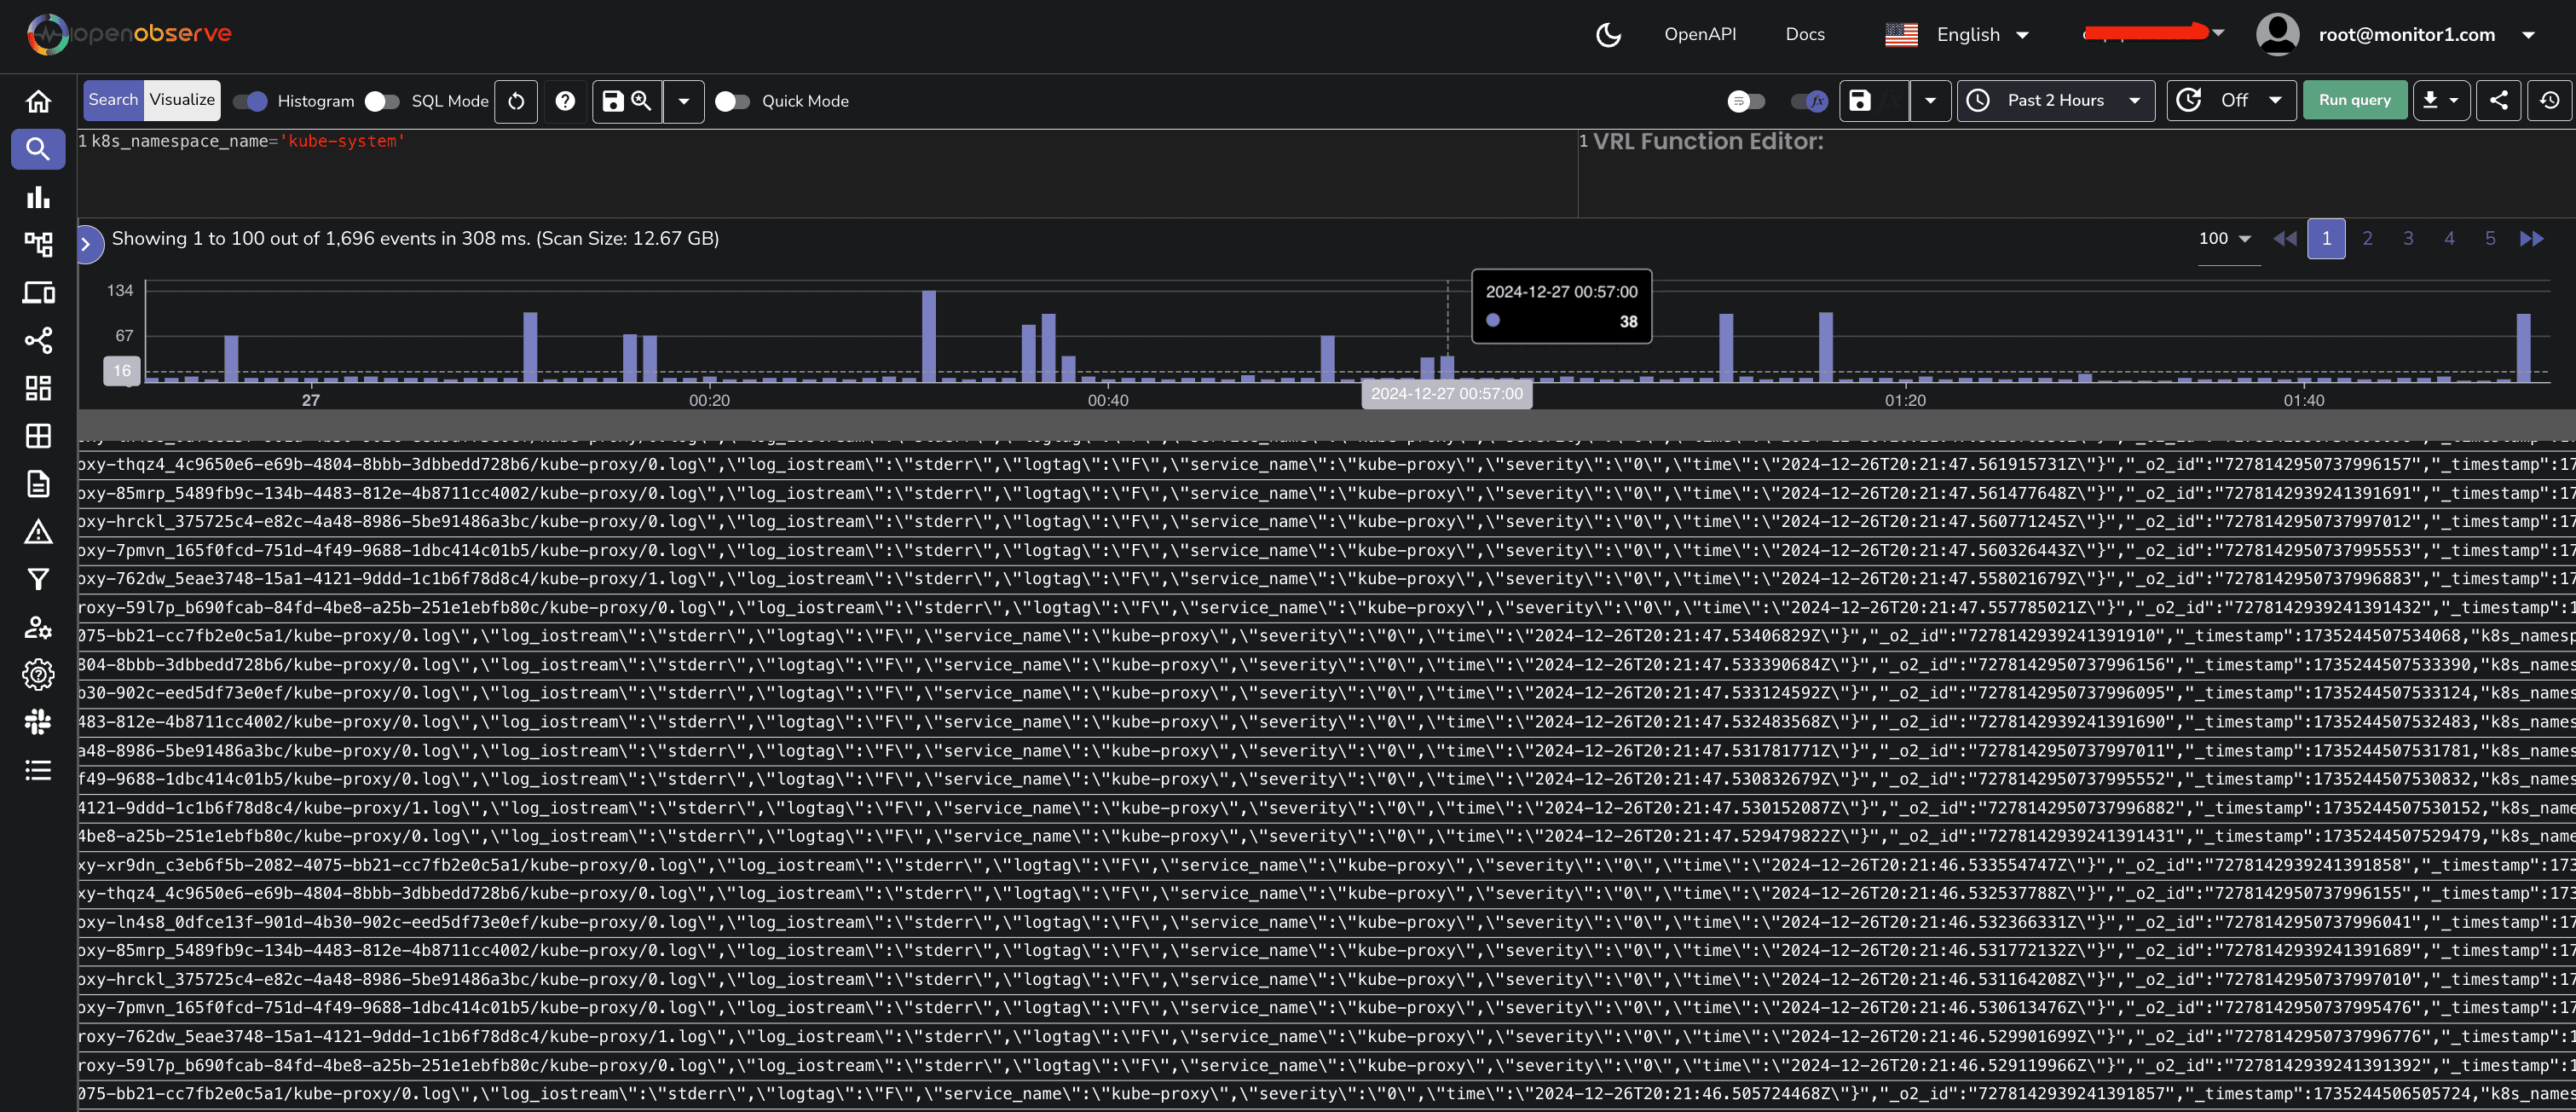
| Logging and Event Monitoring | Logs and events are your best friends when it comes to troubleshooting. O2 captures container logs and Kubernetes events, giving you a clear view of what’s happening in your cluster. This makes it easier to diagnose problems and keep your applications running like a well-oiled machine. |
With the OpenObserve Collector, you’ll have all the insights you need to manage your Kubernetes environment effectively!
Now, let’s talk about dashboards! Each pre-built dashboard offers a unified view of your Kubernetes metrics, making it super easy to monitor your cluster’s health.
Here are a few dashboards you can check out:
Kubernetes Namespace (Pods) Dashboard: Monitor the resource consumption of pods within specific namespaces.
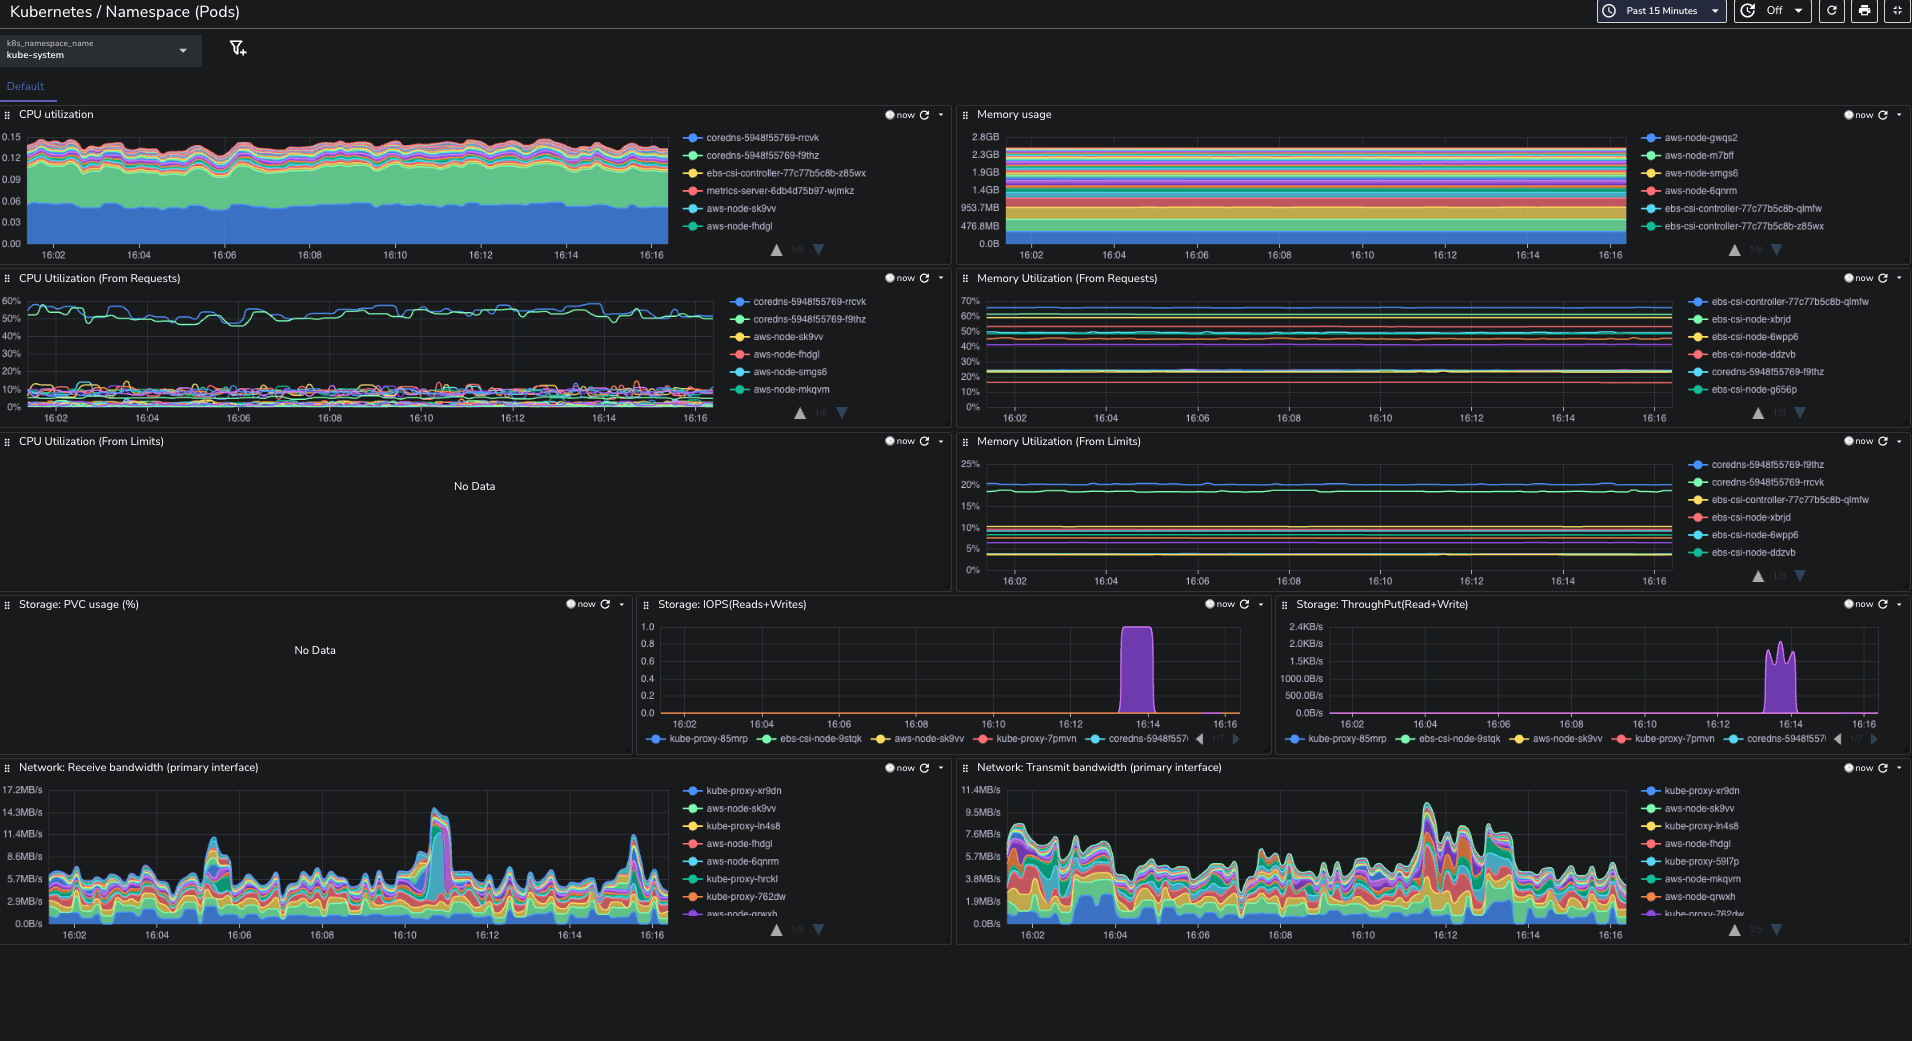
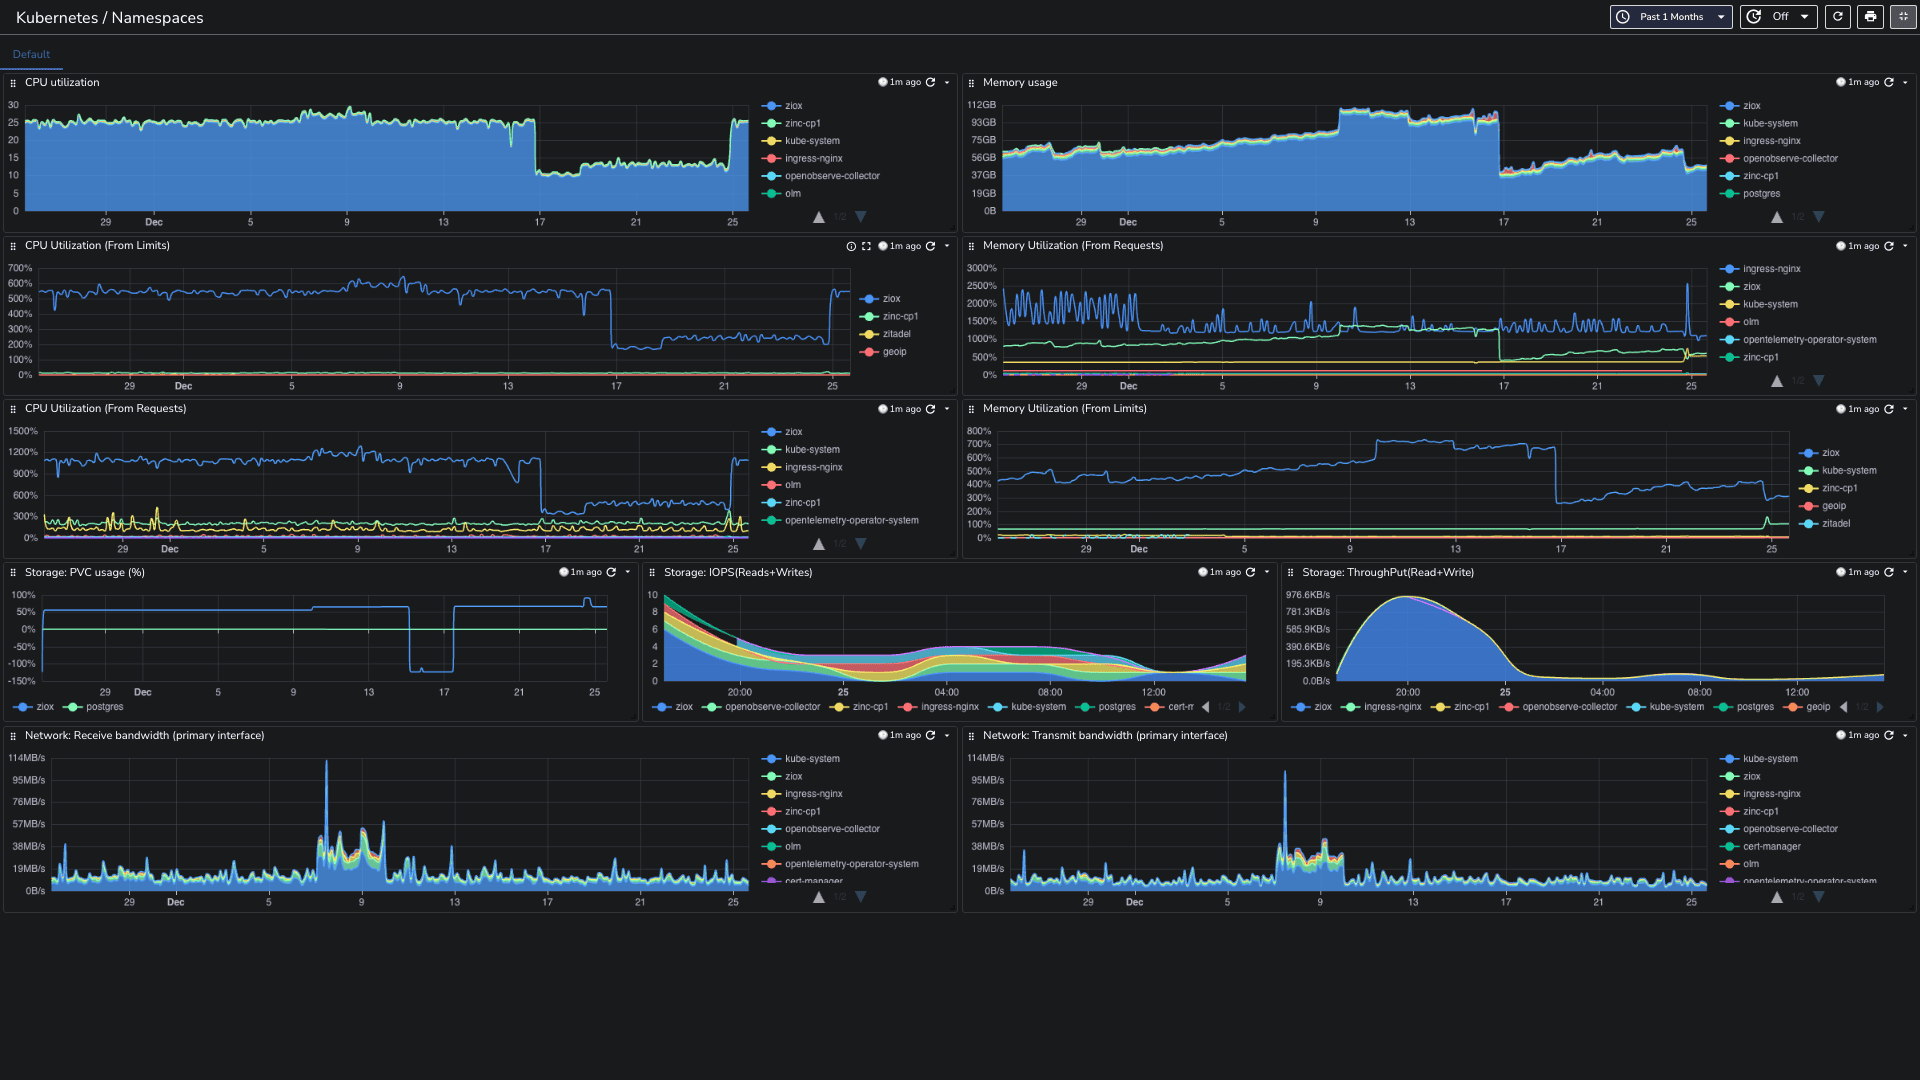
Kubernetes Namespaces Dashboard: Monitor resource allocation and usage across different namespaces.
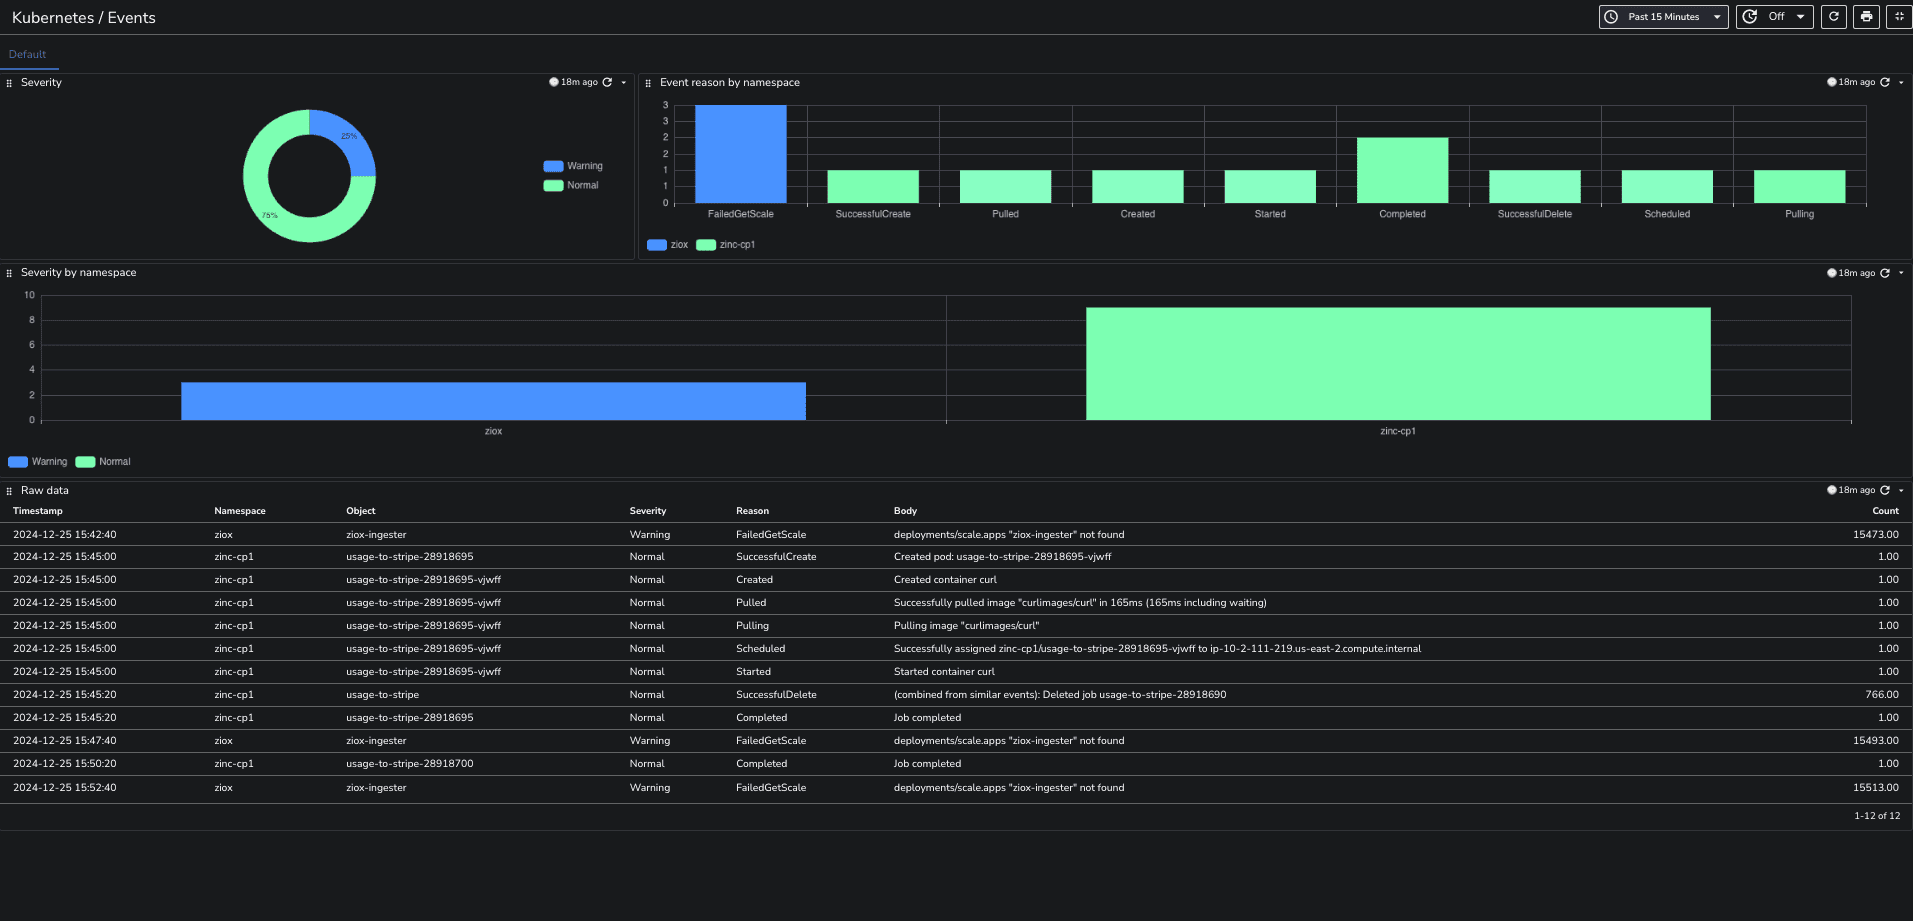
Kubernetes Events Dashboard: Display events occurring within your Kubernetes cluster along with their severity levels.
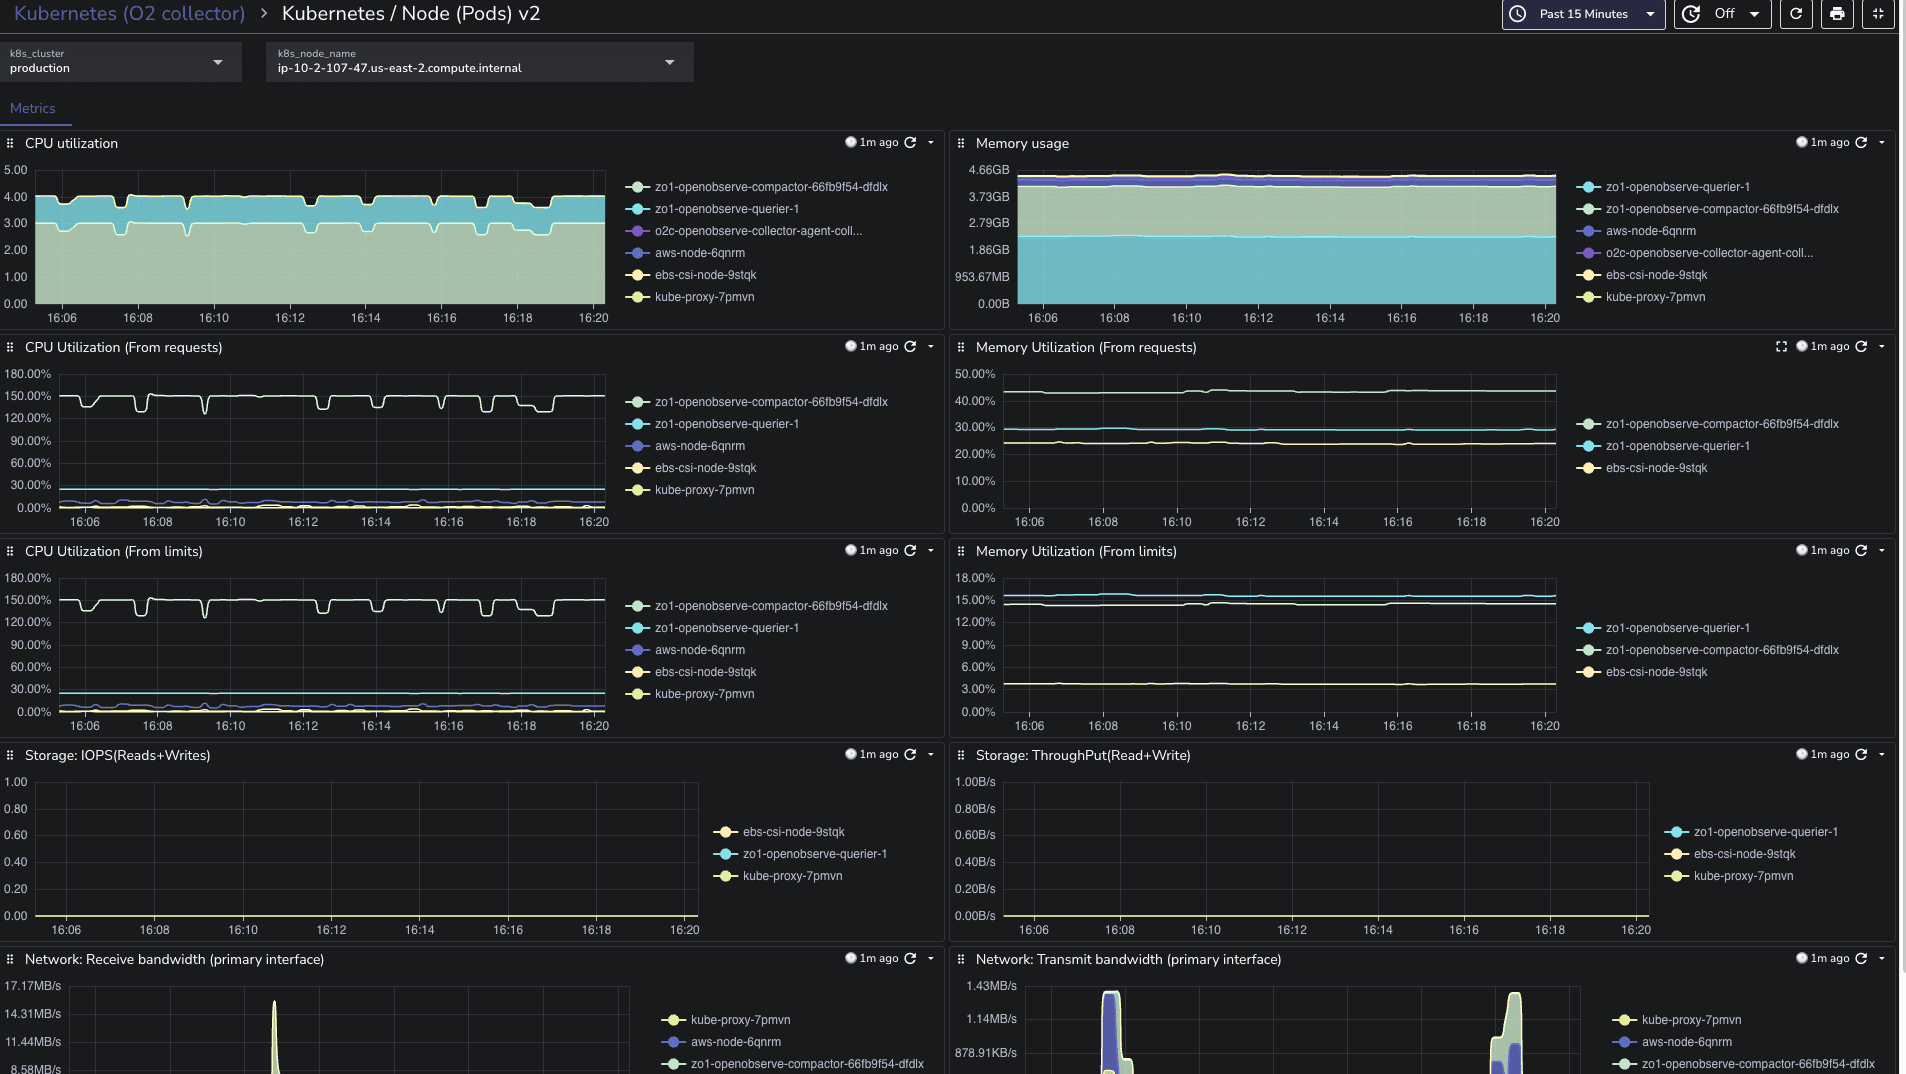
Kubernetes Node (Pods) Dashboard: Monitor the performance and resource usage of
pods running on each node.
 Logs
Logs
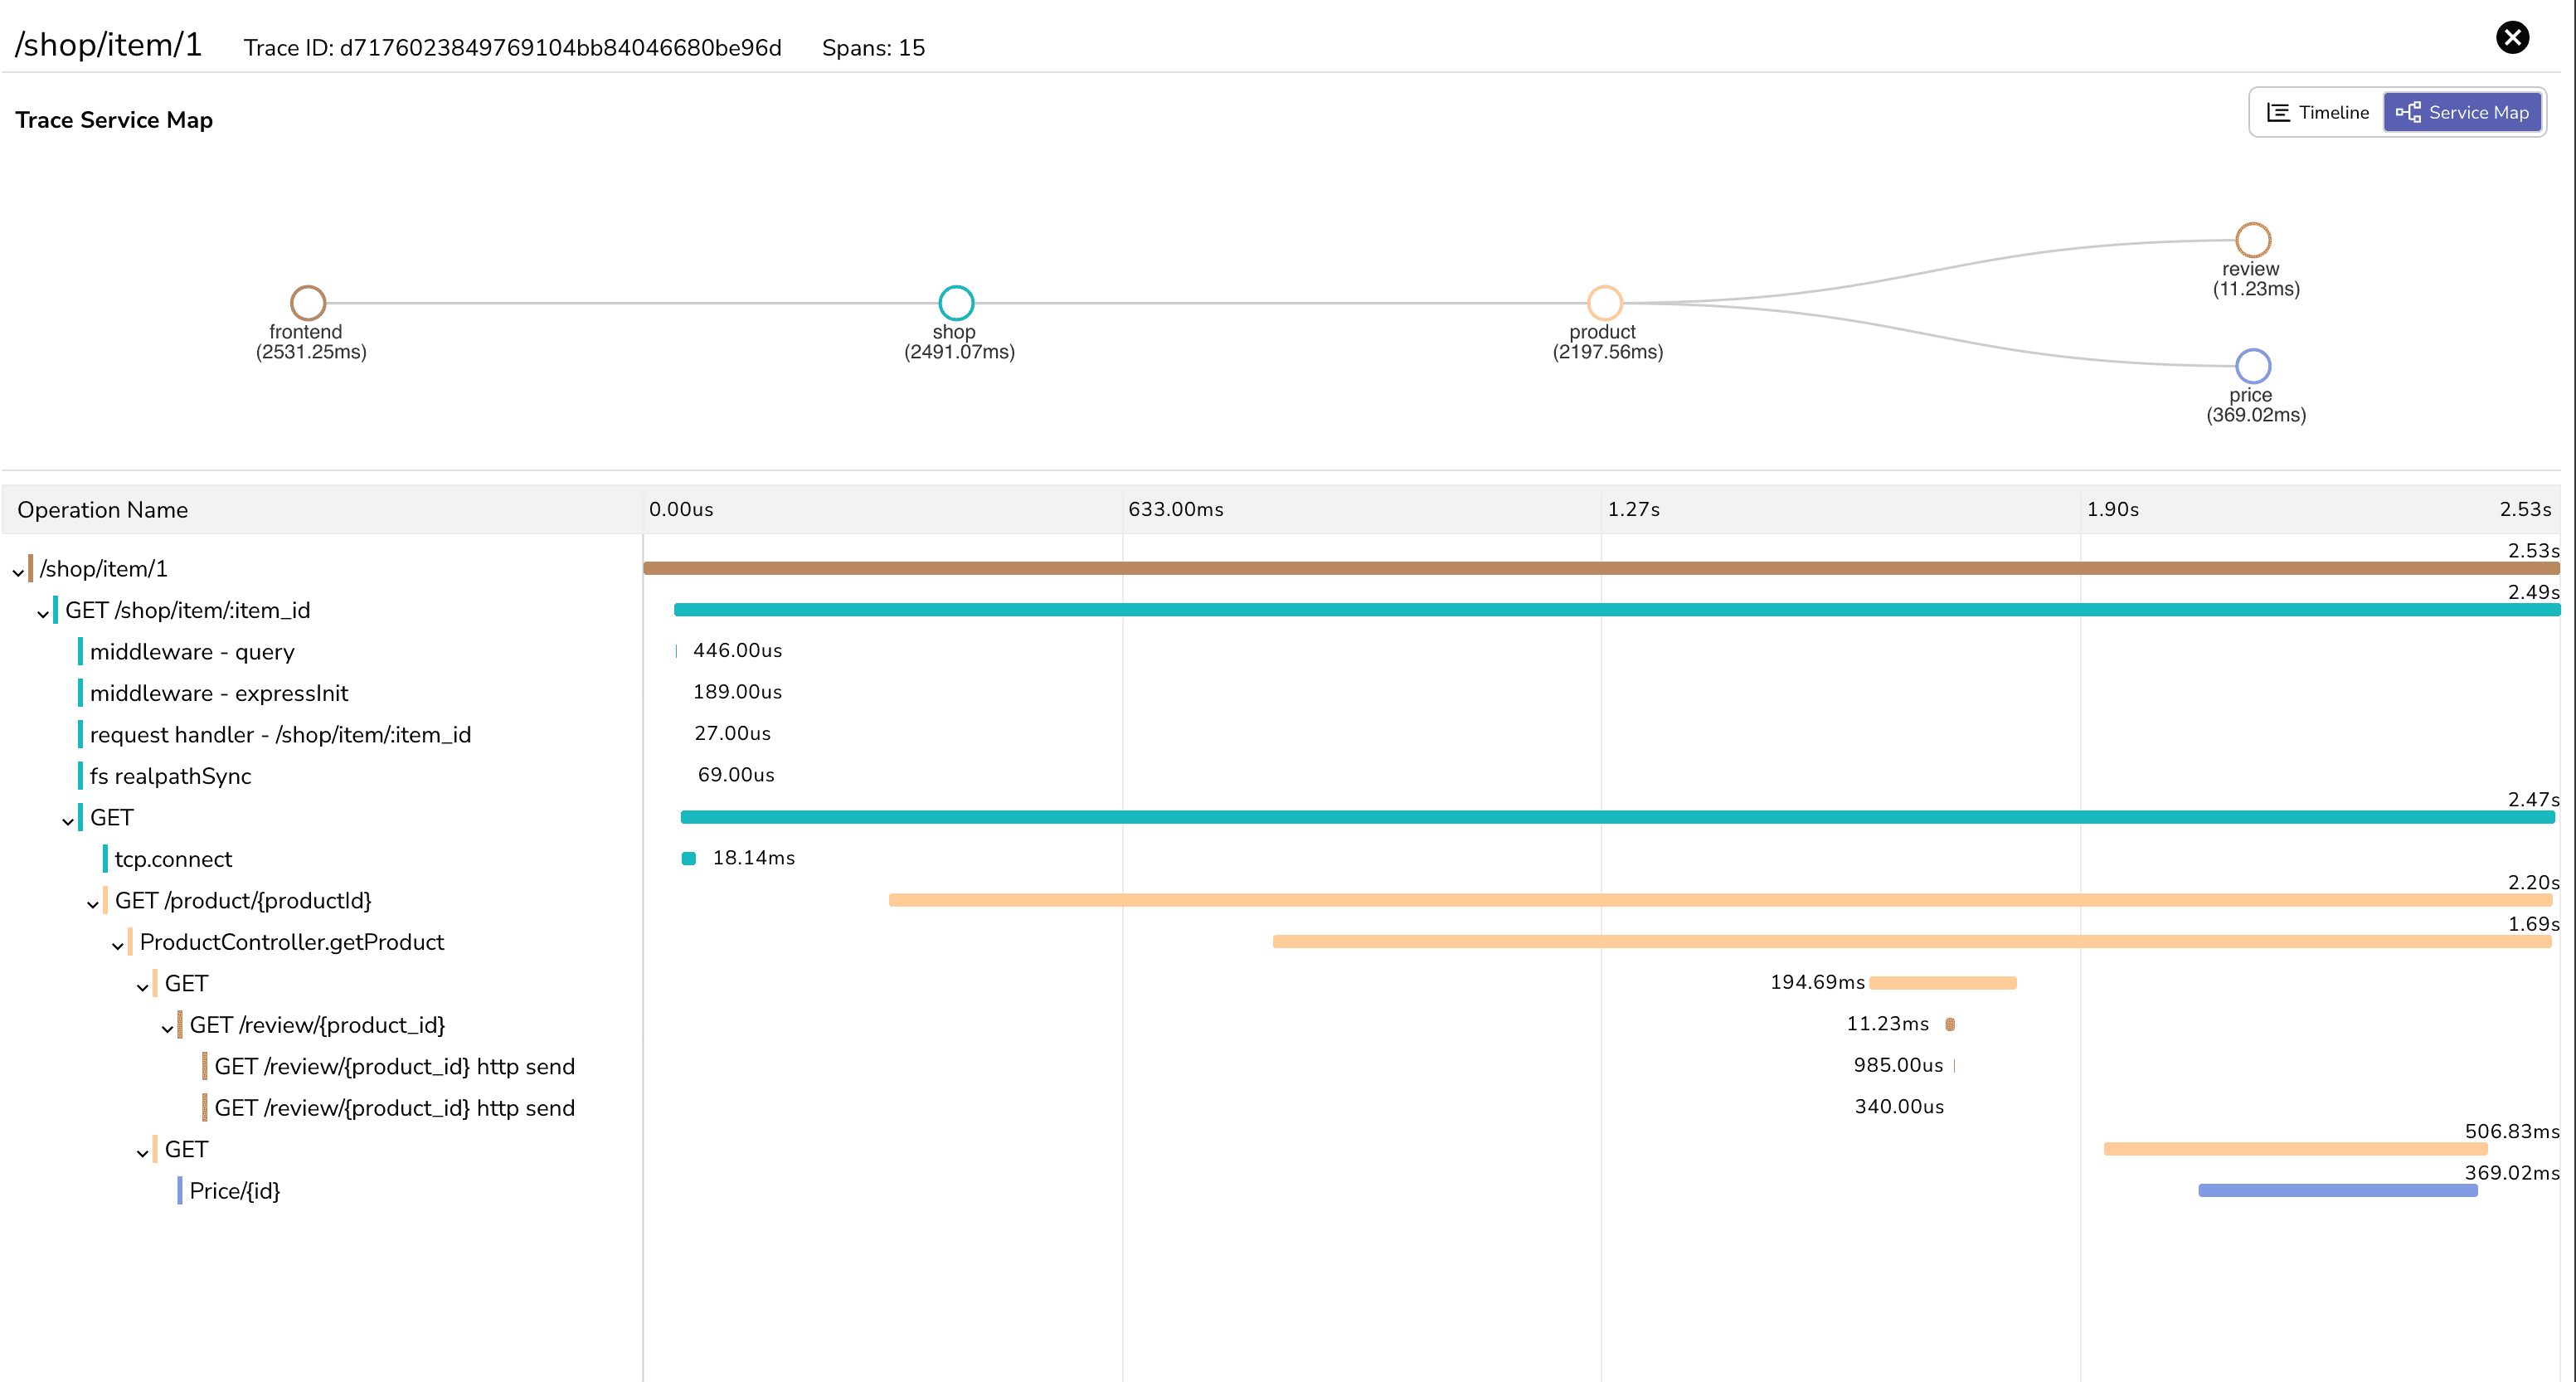 Traces
These dashboards are designed to give you quick insights into your cluster’s performance. You can find them in our community dashboards repository. Just import them, and you’ll be ready to dive into your Kubernetes monitoring setup!
Let’s simplify your observability stack and make Kubernetes monitoring a breeze!
OpenObserve transforms the intricate process of gathering and analyzing telemetry data into a streamlined experience.
With its out-of-the-box capabilities, OpenObserve empowers developers to focus on what truly matters: building and optimizing applications. The comprehensive monitoring features—from resource utilization to logging and event tracking—provide invaluable insights, enabling teams to proactively address issues before they escalate.
While many open source Kubernetes monitoring solutions can seem complex and daunting, OpenObserve stands out by reducing setup overhead and offering intuitive configurations that make observability accessible to all.
Sign up for a 14-day trial of OpenObserve or choose a download option.
Want to contribute? Check out our GitHub repository to explore self-hosting options and help grow the community.
Happy Monitoring! 🚀