Nginx Log Management: From Data Collection to Insightful Analysis


Try OpenObserve Cloud today for more efficient and performant observability.

In modern infrastructure, observability plays a crucial role in monitoring the health and performance of services. Nginx, as one of the most popular web servers, generates access logs that provide valuable insights into traffic, requests, and errors. By forwarding Nginx logs to a centralised observability platform like OpenObserve and using a log processing tool such as Vector, you can gain deeper insights into your web traffic and server performance.
In this blog, we will cover:
Nginx:
Nginx is a high-performance web server and reverse proxy server renowned for its ability to handle a large number of simultaneous connections efficiently. It is widely used for serving static content, load balancing, and as a reverse proxy for web applications. NGINX also features powerful capabilities for managing traffic, enhancing security, and providing SSL termination, making it a popular choice for modern web applications.
Vector:
Vector is an open-source data pipeline tool designed for building high-performance data ingestion and processing systems. It can collect, transform, and route data from various sources to multiple destinations. Vector excels in handling logs, metrics, and events, providing real-time visibility into system performance. Its lightweight architecture and extensible nature make it suitable for both edge and cloud environments.
VRL (Vector Remap Language):
VRL, or Vector Remap Language, is a powerful scripting language used to transform and manipulate data as it flows through the pipeline. With VRL, users can easily define rules for parsing, filtering, and enriching log and metric data, allowing for highly customizable data processing. Its expressive syntax enables users to create complex transformations with ease, making it a valuable tool for optimising data handling in Vector.
OpenObserve:
OpenObserve is an observability tool that captures logs, metrics, and traces, providing comprehensive insights into system performance and behaviour. It helps users monitor and analyse their applications, enabling proactive troubleshooting and optimization. OpenObserve's intuitive interface and robust querying capabilities allow for efficient data exploration, making it a valuable solution for teams seeking to enhance their observability strategy.
First, we will install Nginx, which is a lightweight and highly scalable web server.
sudo apt update
sudo apt install nginx -y
Create a simple index.html page
echo "Hello World from Nginx" | sudo tee /var/www/html/index.html
Let us start and enable the Nginx service:
sudo systemctl start nginx
sudo systemctl enable nginx
Ensure that the necessary ports are open to allow external access to the NGINX server. Depending on where your server is hosted.
In my case, since I’m using AWS, I updated the security group associated with my instance.I made sure to open port 80 (HTTP) to allow inbound traffic from anywhere (0.0.0.0/0) so the NGINX server can be accessed publicly.
Verify Nginx is running by visiting http://

To generate access logs, we need to simulate traffic to the NGINX server. You can open multiple browsers or different devices and visit the server's IP address multiple times to create some activity.
Each time you access the server, NGINX will generate logs in the /var/log/nginx/access.log file.
You can view the logs by running:
tail -f /var/log/nginx/access.log

Vector is a lightweight and highly performant observability data pipeline used to collect, transform, and route logs, metrics, and traces. You can install Vector on a separate server or on the same one running NGINX. I’m installing it on the NGINX instance for simplicity.
To install Vector, run the following commands:
First, add the Vector repo:
bash -c "$(curl -L https://setup.vector.dev)"
Then you can install the vector package:
sudo apt-get install vector
Once Vector is installed, let’s check to make sure that it’s working correctly:
vector --version

OpenObserve is a robust observability platform that collects and analyses logs, metrics, and traces in real-time. In this demo, we’ll proceed with a self-hosted installation of OpenObserve on a separate server.
Use the following command to download the latest version of OpenObserve for your platform:
curl -L https://raw.githubusercontent.com/openobserve/openobserve/main/download.sh | sh
Once downloaded run it using the below command:
ZO_ROOT_USER_EMAIL="root@example.com" ZO_ROOT_USER_PASSWORD="Complexpass#123" ./openobserve
Make sure that port 5080 is open to allow external access to the server. Now point your browser to http://localhost:5080 and log in with the following credentials
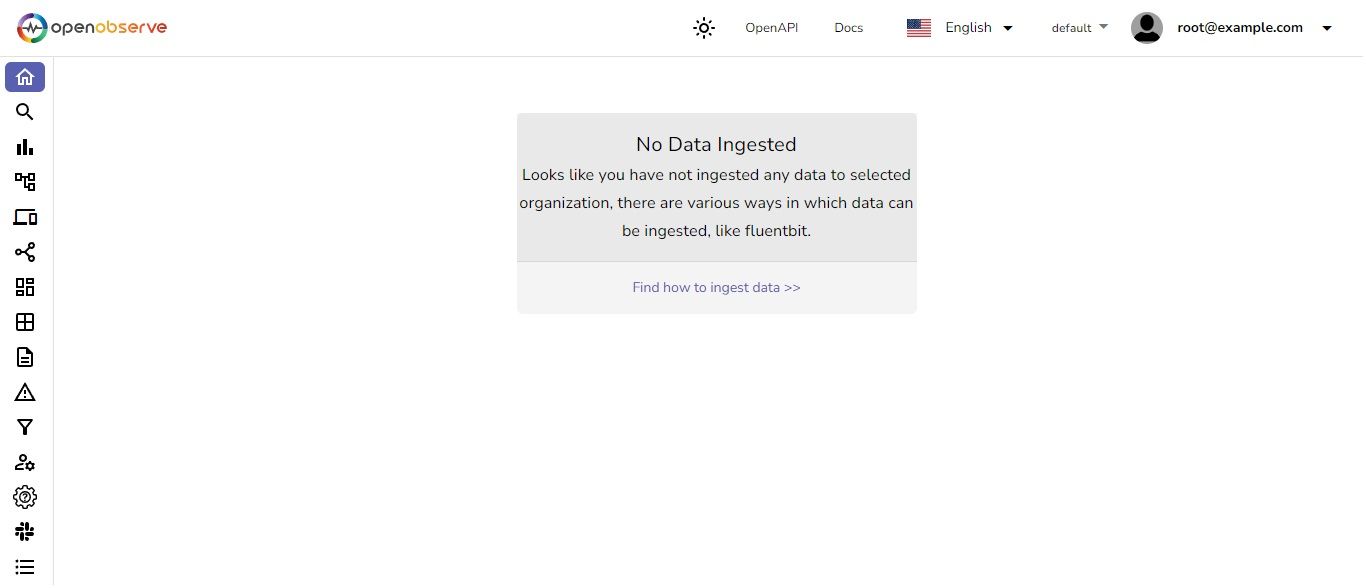
Here, you can start collecting and analysing logs, metrics, and traces in real-time. Explore the platform to gain insights into your system’s performance!
Now, let's configure Vector to access the NGINX access and error logs by creating a configuration file that will send these logs to OpenObserve.
Create a new configuration file for Vector at /etc/vector/vector.toml with the following content:
[sources.nginx]
type = "file"
include = ["/var/log/nginx/access.log", "/var/log/nginx/error.log"]

[sinks.zinc]
type = "http"
inputs = ["nginx"]
uri = "http://3.109.1.66:5080/api/default/default/_json"
method = "post"
auth.strategy = "basic"
auth.user = "root@example.com"
auth.password = "grhlU2znTKtiDT0T"
compression = "gzip"
encoding.codec = "json"
encoding.timestamp_format = "rfc3339"
healthcheck.enabled = false
You can get the sink configurations from OpenObserver under the Ingestion/ Custom/ Logs/ vector section.
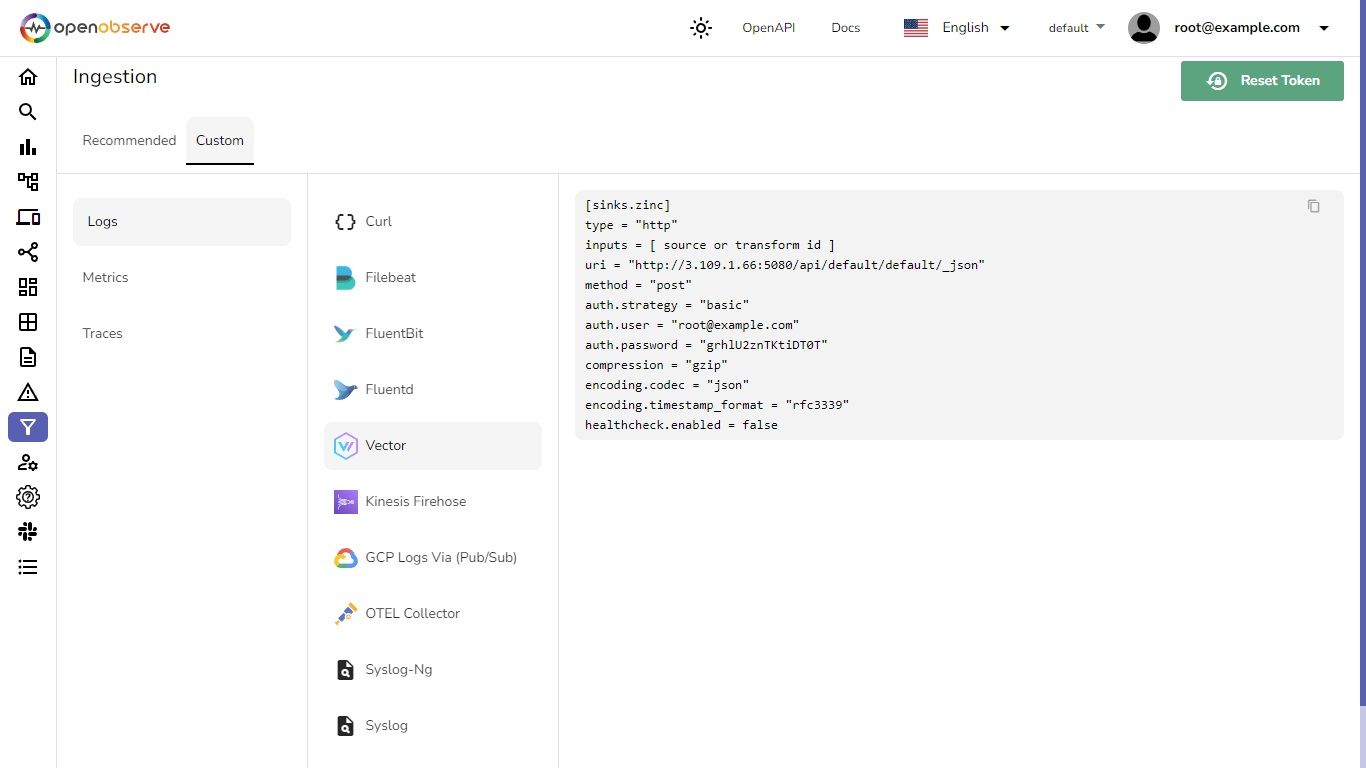
Once your done with the vector.toml file run the following command:
sudo vector --config /etc/vector/vector.toml
The above command will run Vector manually using the specified configuration file. If everything is configured correctly, logs should start appearing in OpenObserve in real-time.

To query the logs in OpenObserve, navigate to the Logs section, select the desired stream and time range, and then click Run Query.
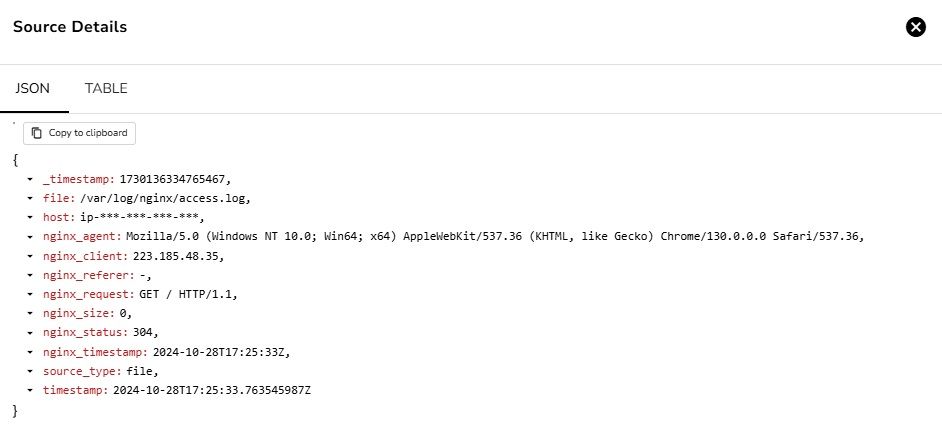
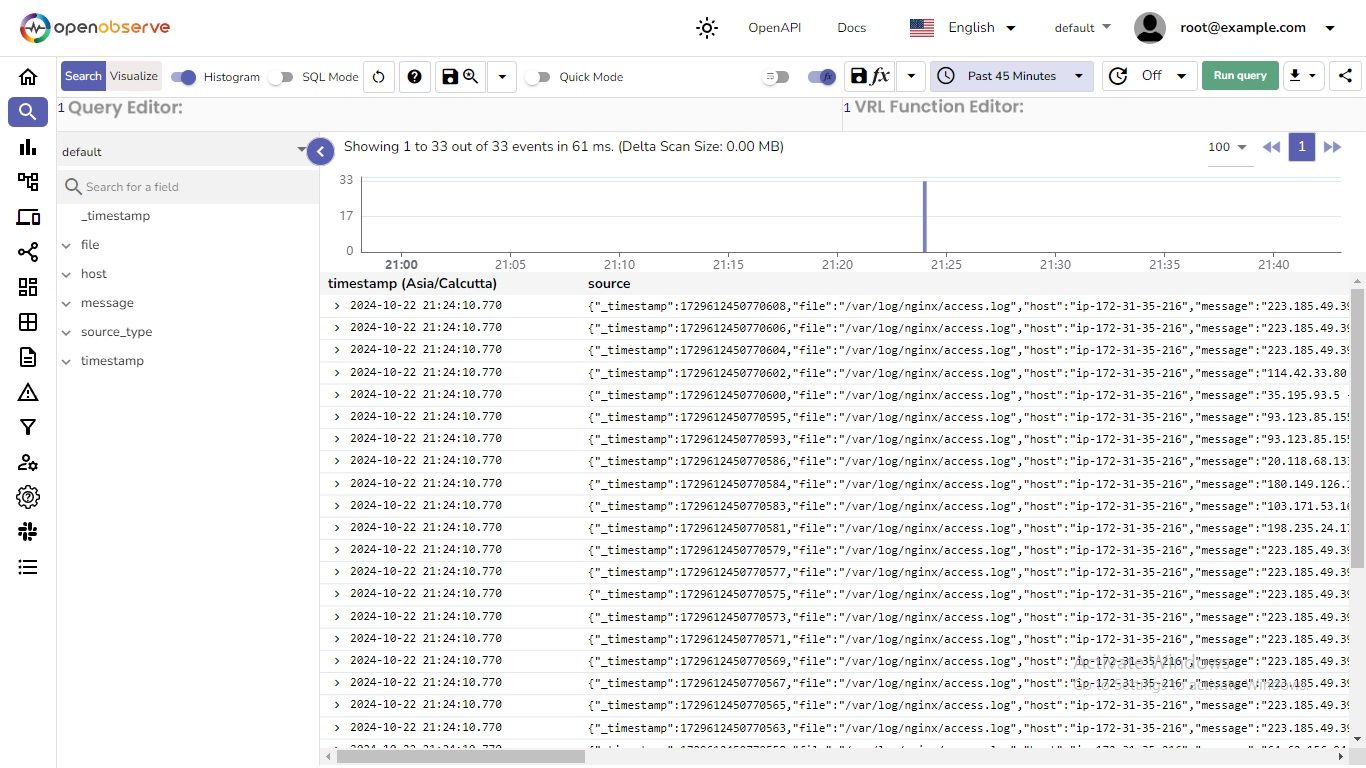 Select or click on any record to view the Source Details.
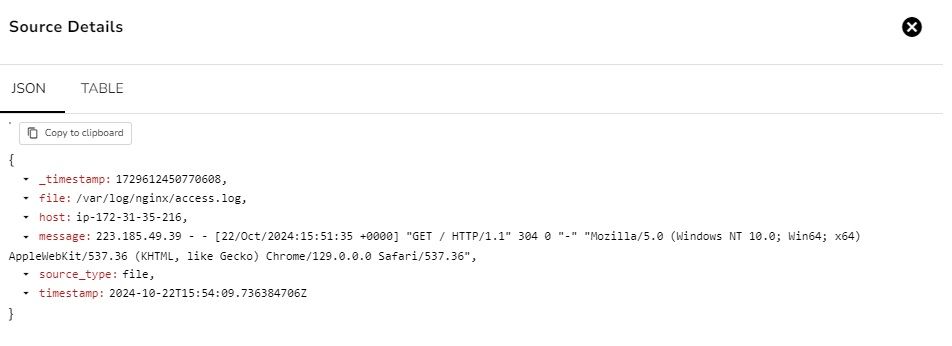
This log entry provides detailed information about an HTTP request made to the Nginx server, including the requester's IP address, the requested resource, the response status, and the user agent string. This information is valuable for monitoring and analysing web traffic.
Once the Nginx logs are successfully ingested into OpenObserve via Vector, you can enhance the logs further using Vector Remap Language (VRL). This allows for custom transformations and enrichments to make your logs more insightful and actionable.
We'll discuss how to apply VRL functions for enriching, redacting, and transforming data.
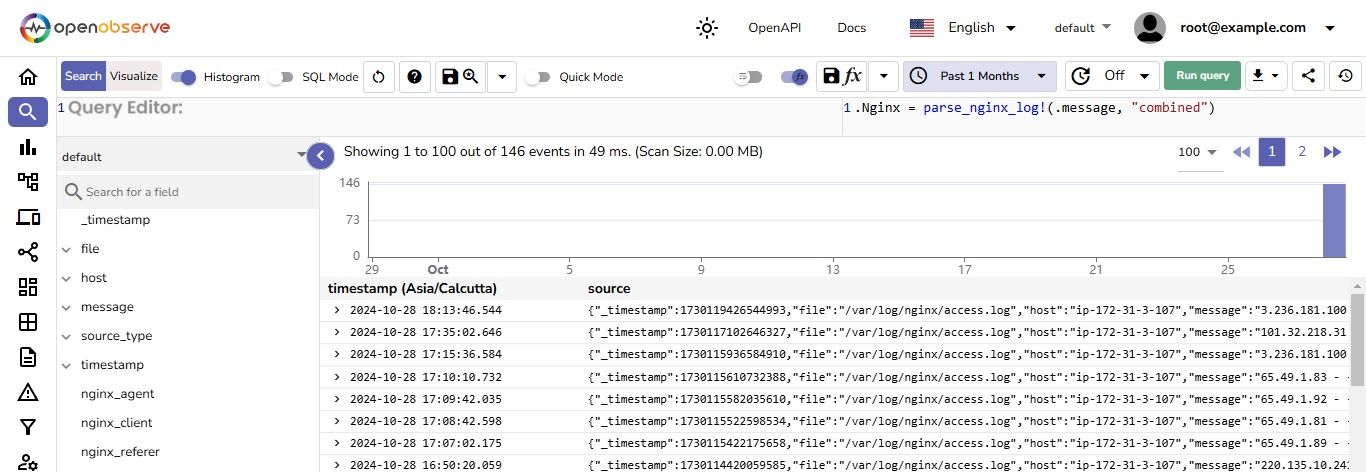
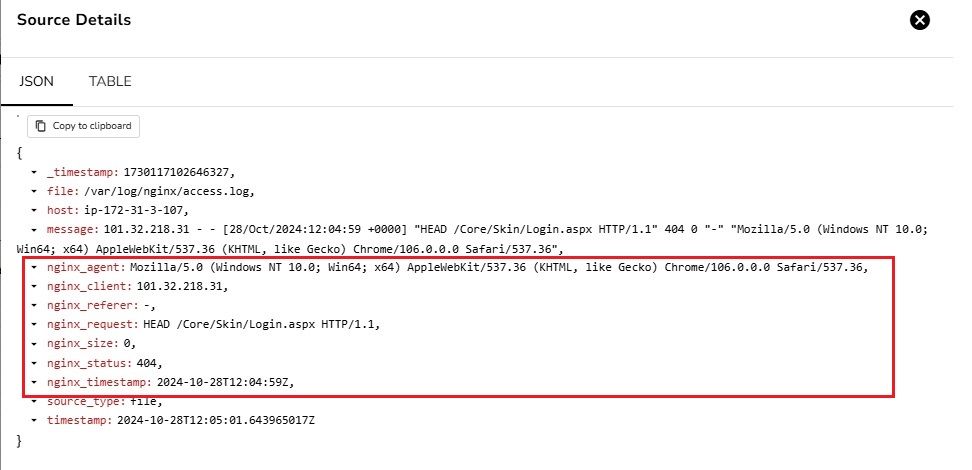
Enriching refers to the process of enhancing raw log data by extracting additional information or structuring it in a way that makes it more useful for analysis. This often involves parsing fields from unstructured text into a structured format that includes relevant metadata.
.nginx = parse_nginx_log!(.message, "combined")
This line enriches the log entry by parsing the message field, which contains the raw log, into a structured format that can include fields such as the request method, status code, and response time. This structured data is easier to query and analyse in observability platforms.
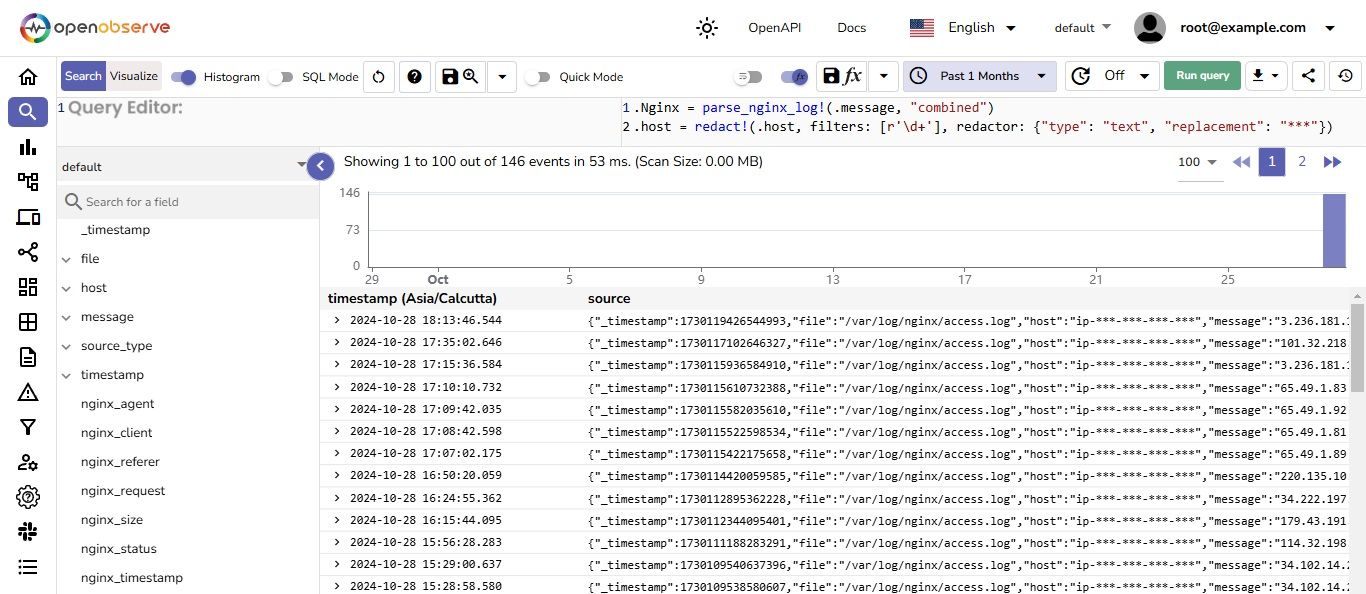
Redacting is the process of removing or obscuring sensitive information from log data to protect privacy and security. This is particularly important for fields that may contain personally identifiable information (PII) or other sensitive data that should not be exposed in logs.
.host = redact!(.host, filters: [r'\d+'], redactor: {"type": "text", "replacement": "***"})
This line redacts numeric values in the host field by replacing them with asterisks. By doing so, it prevents sensitive information about the host from being exposed in the logs, thereby enhancing data security.
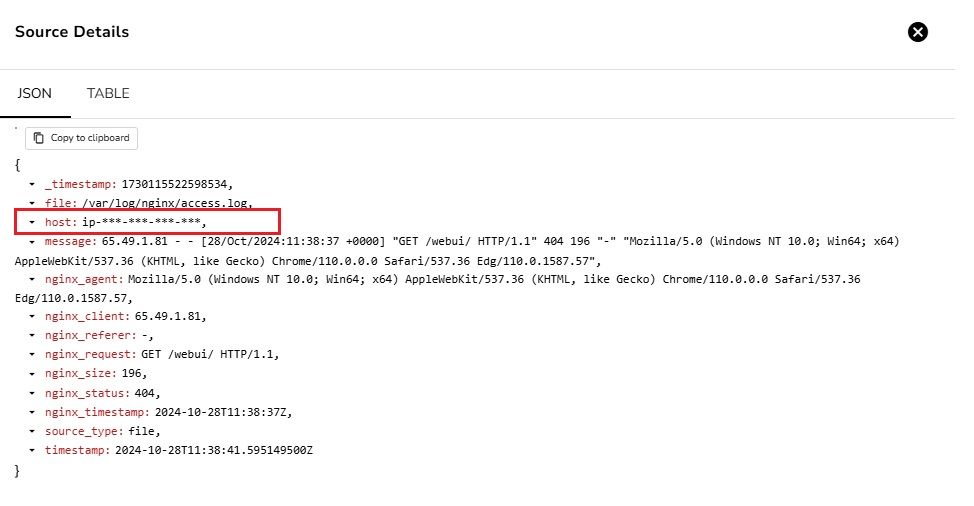
Transforming encompasses a variety of operations that modify the structure or content of log data.This can include deleting unnecessary fields, renaming fields, or modifying data types. Transformations help to streamline log data, making it more relevant and easier to work with.
del(.message)
This line deletes the original message field from the log entry. By removing this unnecessary data, the log becomes cleaner and focuses on the most relevant fields for analysis, thereby improving readability and efficiency.

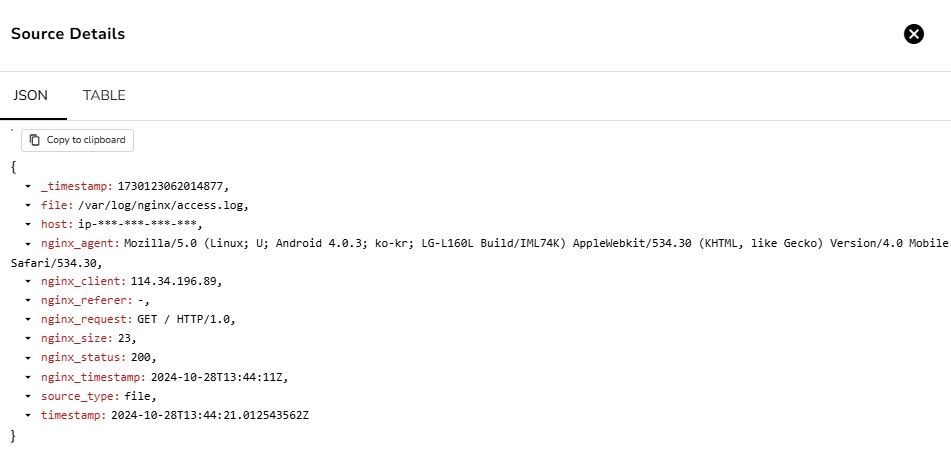
In OpenObserve, you can save VRL (Vector Remap Language) functions and apply them to data streams in real-time. This enables dynamic data transformation during log ingestion, eliminating the need to process data only at query time.
Here's a step-by-step guide on saving and associating a VRL function for real-time log processing:

First, let’s create a function called "nginx_logs"

Go to the Pipelines section and click on the Functions tab. You should see "nginx_logs" listed, confirming that the function has been successfully saved.

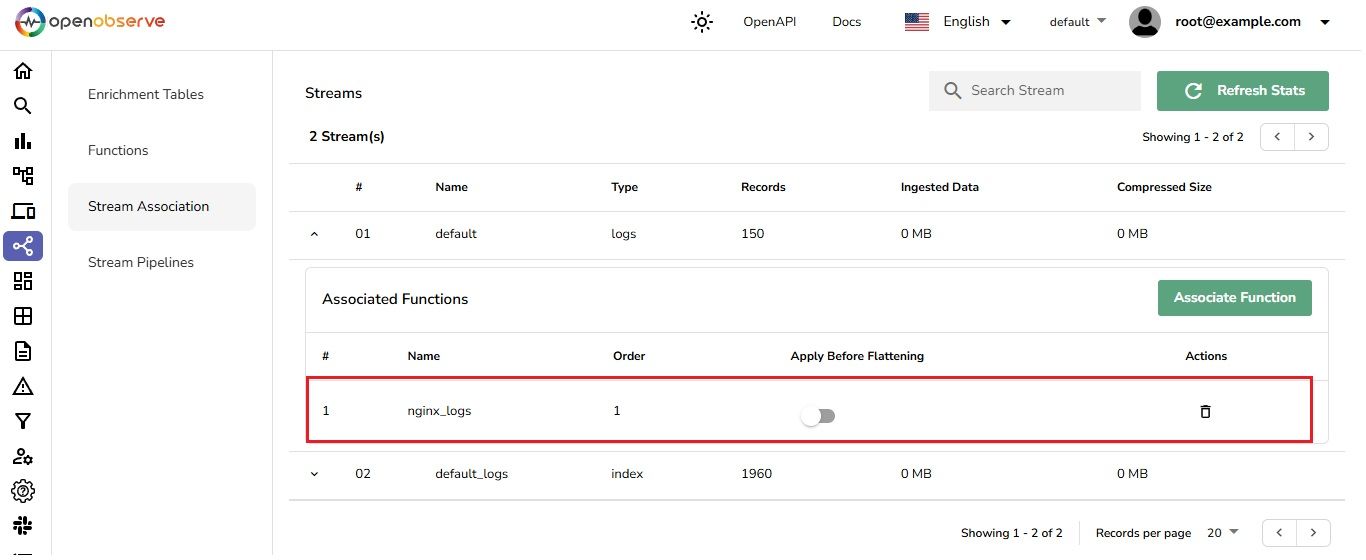
Go to the Stream Association section and link the saved "nginx_logs" function to your target data stream.
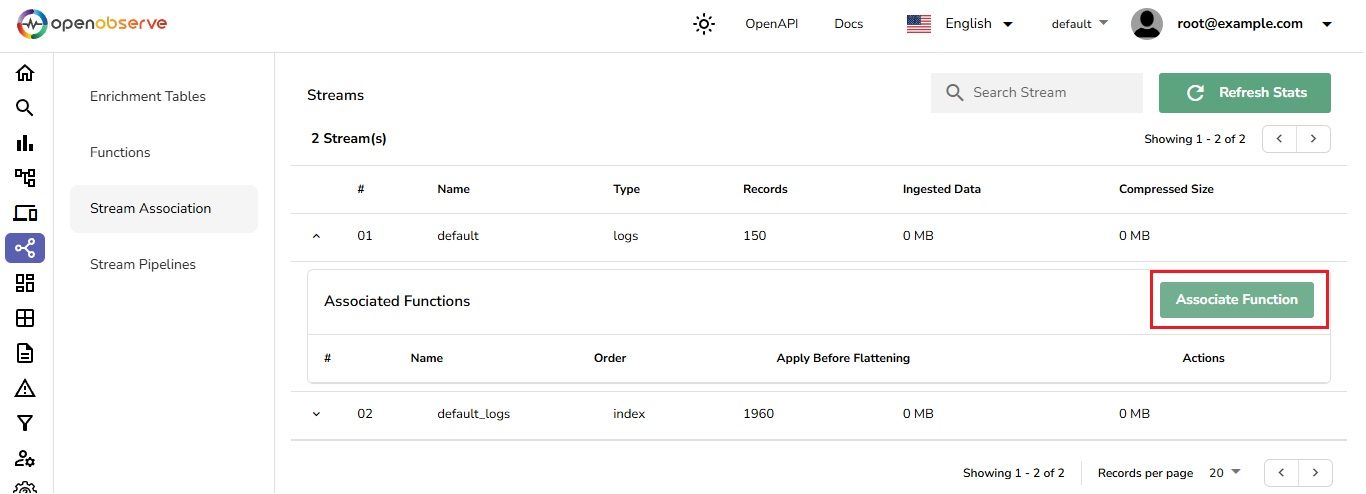 This setup will enable automatic data processing for all logs coming from the stream associated with your Nginx server.
To test the setup, access your Nginx server by visiting http://
Select one minute time range and run a query to view the logs.
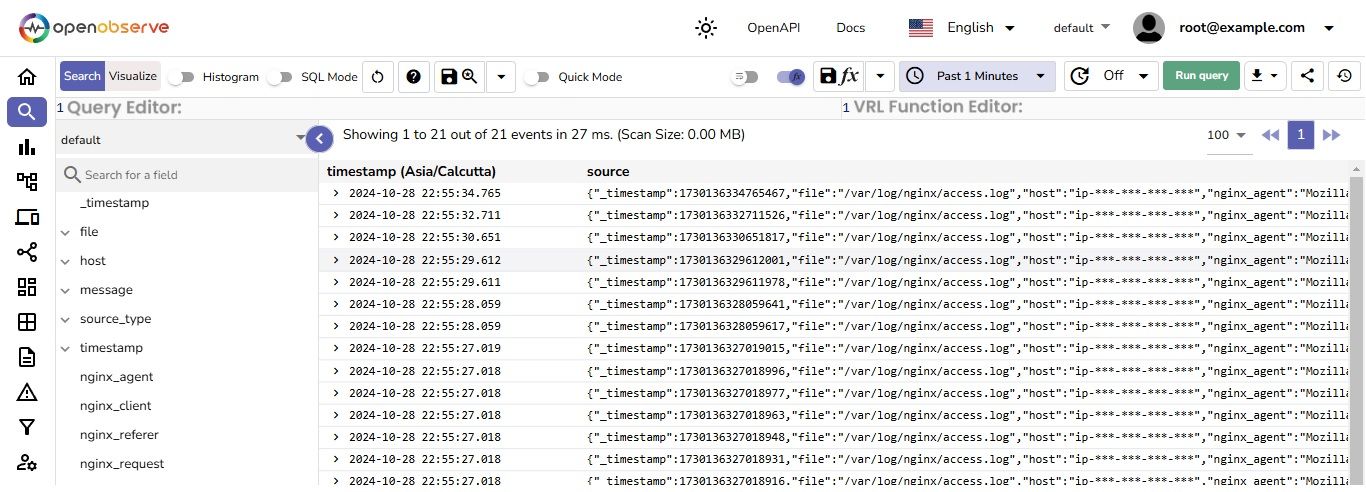 You’ll notice that VRL functions are now being applied in real-time to the ingested logs.
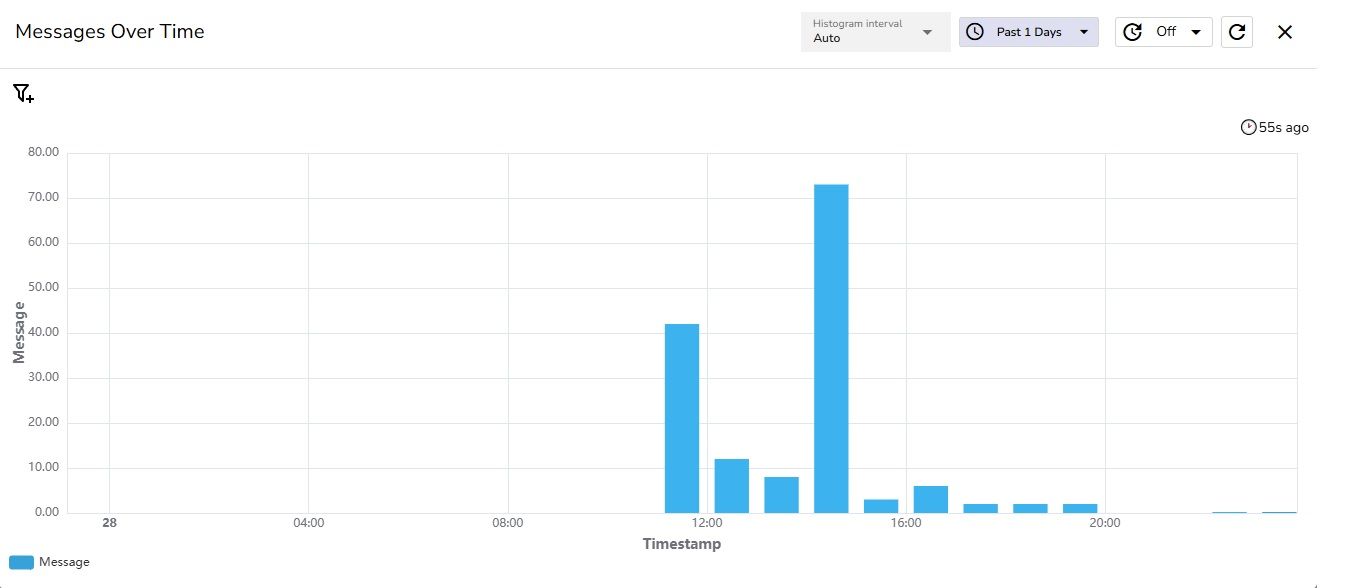
OpenObserve dashboards are powerful tools for visualising and analysing data from various sources, like logs, metrics, and traces.
This dashboard shows peak message activity during specific times of the day, with the highest volume around midday, helping to identify periods of high user engagement.
Integrating Nginx with Vector and OpenObserve enhances log management and analysis, offering insights into traffic and server performance to optimise applications. By enriching logs with custom VRL functions, this strategy improves visibility while safeguarding sensitive