OpenObserve Vs Grafana

Prabhat Sharma
July 14, 2024
10 min read
Don’t forget to share!
Try OpenObserve Cloud today for more efficient and performant observability.
There are plethora of tools available for monitoring and visualizing logs, metrics, and traces. Two popular tools in this space are OpenObserve and Grafana. Both tools offer powerful features for monitoring and visualizing data. While there is some overlap in the functionality they are somewhat different in terms of their architecture, use cases, and target audience. In this blog post, we will explore the differences between OpenObserve and Grafana to help you choose the right tool for your monitoring and visualization needs.
Grafana started in 2014 as a fork of Kibana (The visualization component of ELK stack.) primarily for visualizing time series data. Check the first commit in grafana repo to confirm this. It is an open-source platform for monitoring and observability that allows you to query, visualize, alert on, and understand your metrics from a wide variety of sources. Grafana supports a wide range of data sources, including Prometheus, Graphite, Elasticsearch, InfluxDB, and many others. It provides a powerful and flexible platform for creating dashboards and visualizing data in real-time.
Visualization of data is the primary functionality of Grafana (It does alerting as well but that is not its primary intended use and is not the strongest there). Most common use of grafana is to visualize metrics from prometheus, graphite, influxdb etc. Grafana is a great tool for creating dashboards and visualizing time series data e.g. metrics, logs and traces.
If you want to monitor your applications or infrastructure then you would generally need three core observability signals - logs, metrics, and traces (There are other signals as well). Grafana itself does not provide means to ingest, store, and manage these signals, but is a visualization tool that can be used to query, analyze and visualize these signals by connecting to other data sources.
e.g.
Grafana is a generally used as a front end for prometheus, graphite, elasticsearch, jaeger, zipkin, etc. and does not provide the capability to ingest and store the signals itself.
Grafana even though does not have capability for ingesting and storing the signals, due to it being a front end for many tools allows it be the single UI for multiple disparate systems. This is a huge advantage as you can have a single pane of glass for all your observability needs.
Grafana is extremely lightweight and easy to get started with, in the sense that you can simply download a binary and start using it on your laptop or deploy it as a container or run it in a kubernetes cluster.
Another great strength of grafana is that that it has a plugin based architecture which allows anyone to create a plugin for visualizing and analyzing data from any source. This has led to a huge ecosystem of plugins that can be used with grafana. There is even a grafana plugin for OpenObserve.
Challenge with grafana is that it is not a single platform for all your observability needs. You would need to connect it to multiple sources to get a complete picture of your system. This can be a challenge as you would need to learn multiple systems and maintain them.
Let's think about it, if you are a company who wants to monitor logs, metrics and traces for your application in kubernetes or in general what all you will need to do with grafana:
First thing you would want to setup is a tool for metrics. Most people start with prometheus as its extremely simple. Even though prometheus itself is very simple it does not support long term storage. This will set you up on a path to find a solution that provides long term storage. You will start evaluating Thanos, Cortex and similar tools. Learning their architecture, setting them up and making them work takes a lot of effort. By the time you have figured out how and where to store your metrics, 2-4 weeks have passed.
Next you would want to setup a tool for logs. You might want to start with loki as its simple to setup and is a good tool. You would soon realize that while loki is simple to implement it is not very performant when it comes to searches and makes you learn a new query language. You might even explore elasticsearch, graylog and more. By the time you figure out a solution and implement it, another 2-4 weeks have passed.
Next you would want to setup a tool for traces. You might want to start with jaeger as its simple to setup and is a good tool. Now Jaeger requires its own backend for storing data. You would start evaluating elasticsearch, clickhouse and more for Jaeger backend. By the time you figure out a solution and implement it, another 2-4 weeks have passed.
There is an argument that grafana allows you to pick the best of the breed tools for each signal and that is true. But the challenge is that you would need to learn and maintain multiple systems. For most folks this is a huge challenge.
You will also hear of LGTM stack (Loki, Grafana, Tempo, Mimir) which is a pretty good stack for observability. Each of these components are separate open source tools built by grafana labs.
OpenObserve is a modern open source observability platform that provides a unified system for logs, metrics, traces and more. It is designed to help you monitor and troubleshoot your applications and infrastructure in real-time. OpenObserve is built in rust for high performance and scalability. It is a single platform that provides all the core observability signals - logs, metrics, and traces. OpenObserve is designed to be easy to use and deploy, with a simple and intuitive user interface that allows you to quickly create dashboards and visualize your data too.
OpenObserve can be downloaded as a single binary and can be run on your laptop or deployed as a container or run in a kubernetes cluster. It is extremely lightweight and easy to get started with. This single binary would provide you with all the core observability signals - logs, metrics, and traces. This is a huge advantage as you would not need to learn and maintain multiple systems. With and extremely simple and intuitive UI you can get started with OpenObserve in minutes. If you are starting your observability journey then OpenObserve is a great place to start.
Check the below 2 minute video to see how easy it is to get started with OpenObserve.
Once OpenObserve is running it will allow you to collect logs, metrics and traces. You can also monitor front end, build pipelines, write VRL functions (to parse, enrich, redact and normalize data), set alerts and do a whole lot more.
For smaller setups ingesting under 200 GB per day a single node installation of OpenObserve is generally sufficient, if you do not need HA (High Availability) setup. For HA setup you can use the helm chart to deploy OpenObserve in a kubernetes cluster which will provide the functionality around all the core observability signals - logs, metrics, and traces.
Let's discuss visualization since that is the main overlapping feature between OpenObserve and Grafana.
Grafana was started in 2014 and has come a long way. While grafana has a lot of chart types, its main power comes from being able to connect to tons of other data sources, plugins and ecosystem. While being able to connect to various data sources and visualize data is a great strength it is only a part of the overall observability solution.
When building OpenObserve we wanted to provide similar functionality as that of grafana for visualization but much easier, hence drag and drop support was built right from day 1. We built OpenObserve visualization on top of Apache eCharts, a powerful and flexible charting library providing the strong foundation and giving us a huge jumpstart. OpenObserve does not the ability to connect to data sources other than itself, but for observability use cases this is not needed and can be a great solution for many folks.
Below are the high level logical architecture diagrams for OpenObserve and Grafana when deployed for logs, metrics and traces.
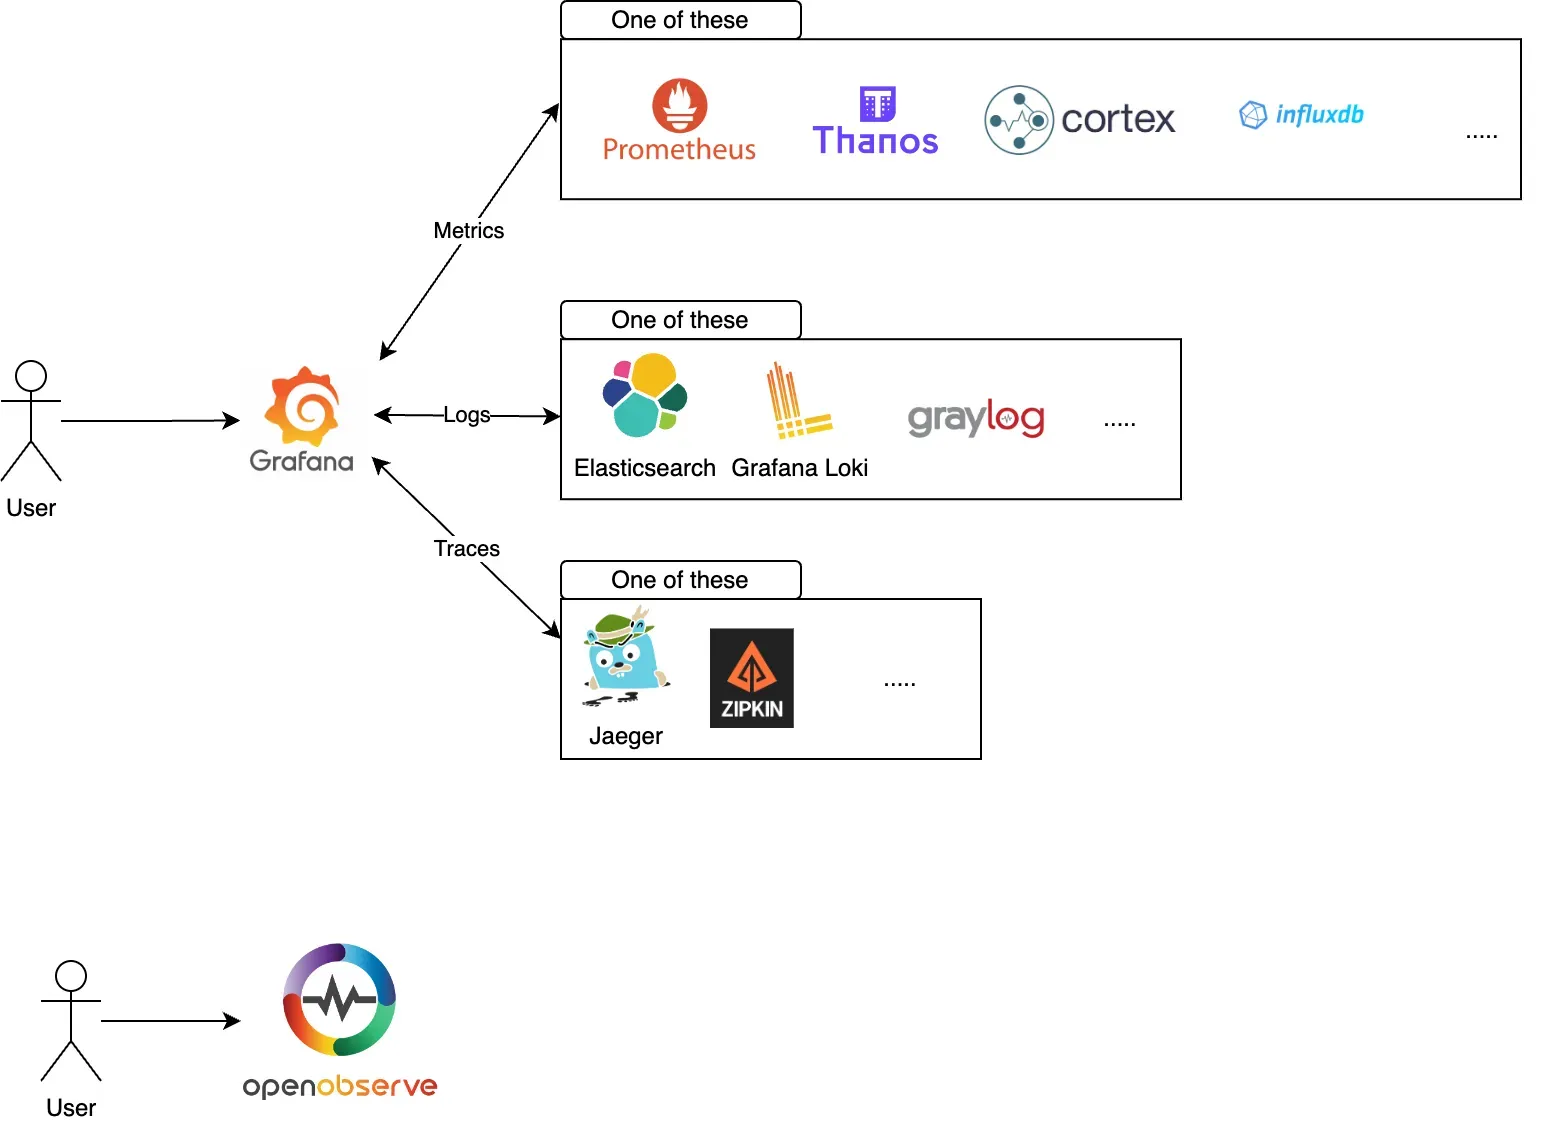
OpenObserve provides a single platform for all your observability needs.
Grafana is a front end for multiple data sources and requires multiple data sources to be connected to it to provide a complete observability solution.
When deploying in HA mode, OpenObserve can be deployed in a kubernetes cluster using the helm chart. Grafana can also be deployed in a kubernetes cluster using the helm chart. Each of the components in grafana architecture will have their own installation, configuration and maintenance.
| Feature | OpenObserve | Grafana |
|---|---|---|
| Single binary/container | Yes | Yes |
| Logs | Yes | No (Requires a solution like loki and elasticsearch) |
| Metrics | Yes | No (Requires a solution like prometheus, influxdb, etc) |
| Traces | Yes | No (Requires a solution like Jaeger, zipkin, Tempo, etc) |
| Visualization | Yes | Yes |
| Alerting | Yes | Yes |
| Plugin Ecosystem | No (18 different inbuilt chart types) | Yes |
| Connectivity to external Data Sources | No (Can work with logs, metrics and traces data in OpenObserve) | Yes |
| Complete observability solution | Yes | No (Requires at least 3 other tools - 1 for each logs, metrics and traces ) |
Our goal when started building OpenObserve was to provide a simple yet sophisticated tool for observability. To that end OpenObserve provides a powerful and flexible platform for creating dashboards and visualizing data in real-time. With 18 different kinds of chart types and drag and drop support functionality, you will find it extremely easy to create dashboards and visualize your data. OpenObserve also provides a SQL and PromQL query languages that allows you for querying and filtering data.
Grafana has an edge if you want to connect to multiple sources and visualize data from multiple sources, but if only observability signals are needed then OpenObserve is a great choice.
OpenObserve cannot connect to prometheus, graphite, elasticsearch, jaeger etc, but for observability use cases it does not need to. All the observability signals are built right inside OpenObserve and you can get started with OpenObserve in minutes.
OpenObserve provides a powerful and flexible platform for creating dashboards and visualizing data in real-time. With 18 different kinds of chart types and drag and drop support functionality, you will find it extremely easy to create dashboards and visualize your data. OpenObserve also provides SQL and PromQL support that allows you for querying and filtering data.
Prabhat Sharma is the founder of OpenObserve, bringing extensive expertise in cloud computing, Kubernetes, and observability. His interests also encompass machine learning, liberal arts, economics, and systems architecture. Outside of work, Prabhat enjoys spending quality time playing with his children.


