OpenVPN Connect Logs: Streamlining Ingestion with AWS and Building Security Dashboards

Chaitanya Sistla
November 30, 2024
5 min read
Don’t forget to share!
Try OpenObserve Cloud today for more efficient and performant observability.
Managing logs effectively is critical for organizations using OpenVPN Connect or OpenVPN Client to ensure robust security and operational insights. In this step-by-step guide, we will automate the process of ingesting OpenVPN CloudConnexa logs using AWS services like S3, SNS, and Lambda, followed by visualizing these logs on rich security dashboards. This solution streamlines log management, improves scalability, and enhances security monitoring.
OpenVPN is an open-source VPN protocol and software that enables secure point-to-point or site-to-site connections. It uses SSL/TLS for encryption, ensuring data privacy over the internet. Compatible with multiple operating systems, it supports flexible configurations for remote access, cloud-based setups, and enterprise networks. OpenVPN can be deployed as a client-server model or in peer-to-peer mode. It is widely used for its security, scalability, and open-source community support.
Automating log ingestion from OpenVPN Connect offers numerous benefits, including:
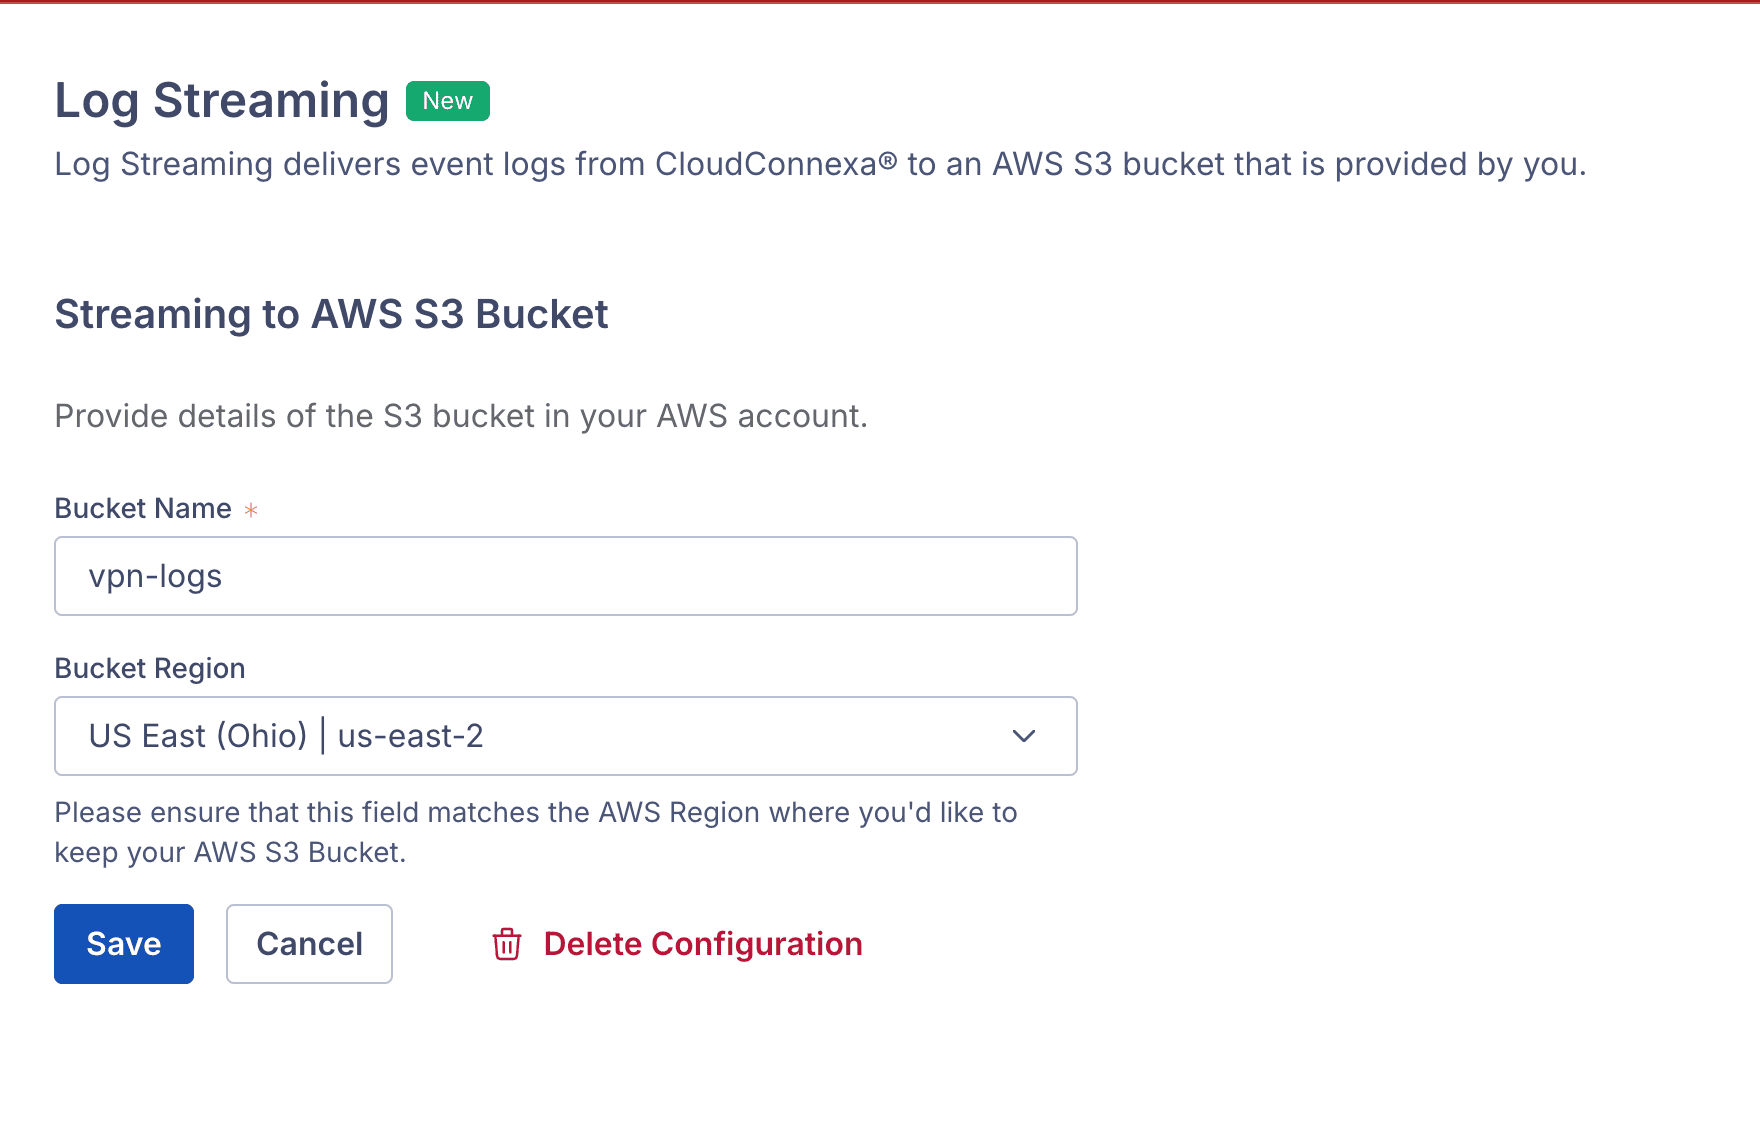
The below configuration helps configure OpenVPN logs and ingest them to OpenObserve for detailed analysis and security insights.
Set Up an S3 Bucket:
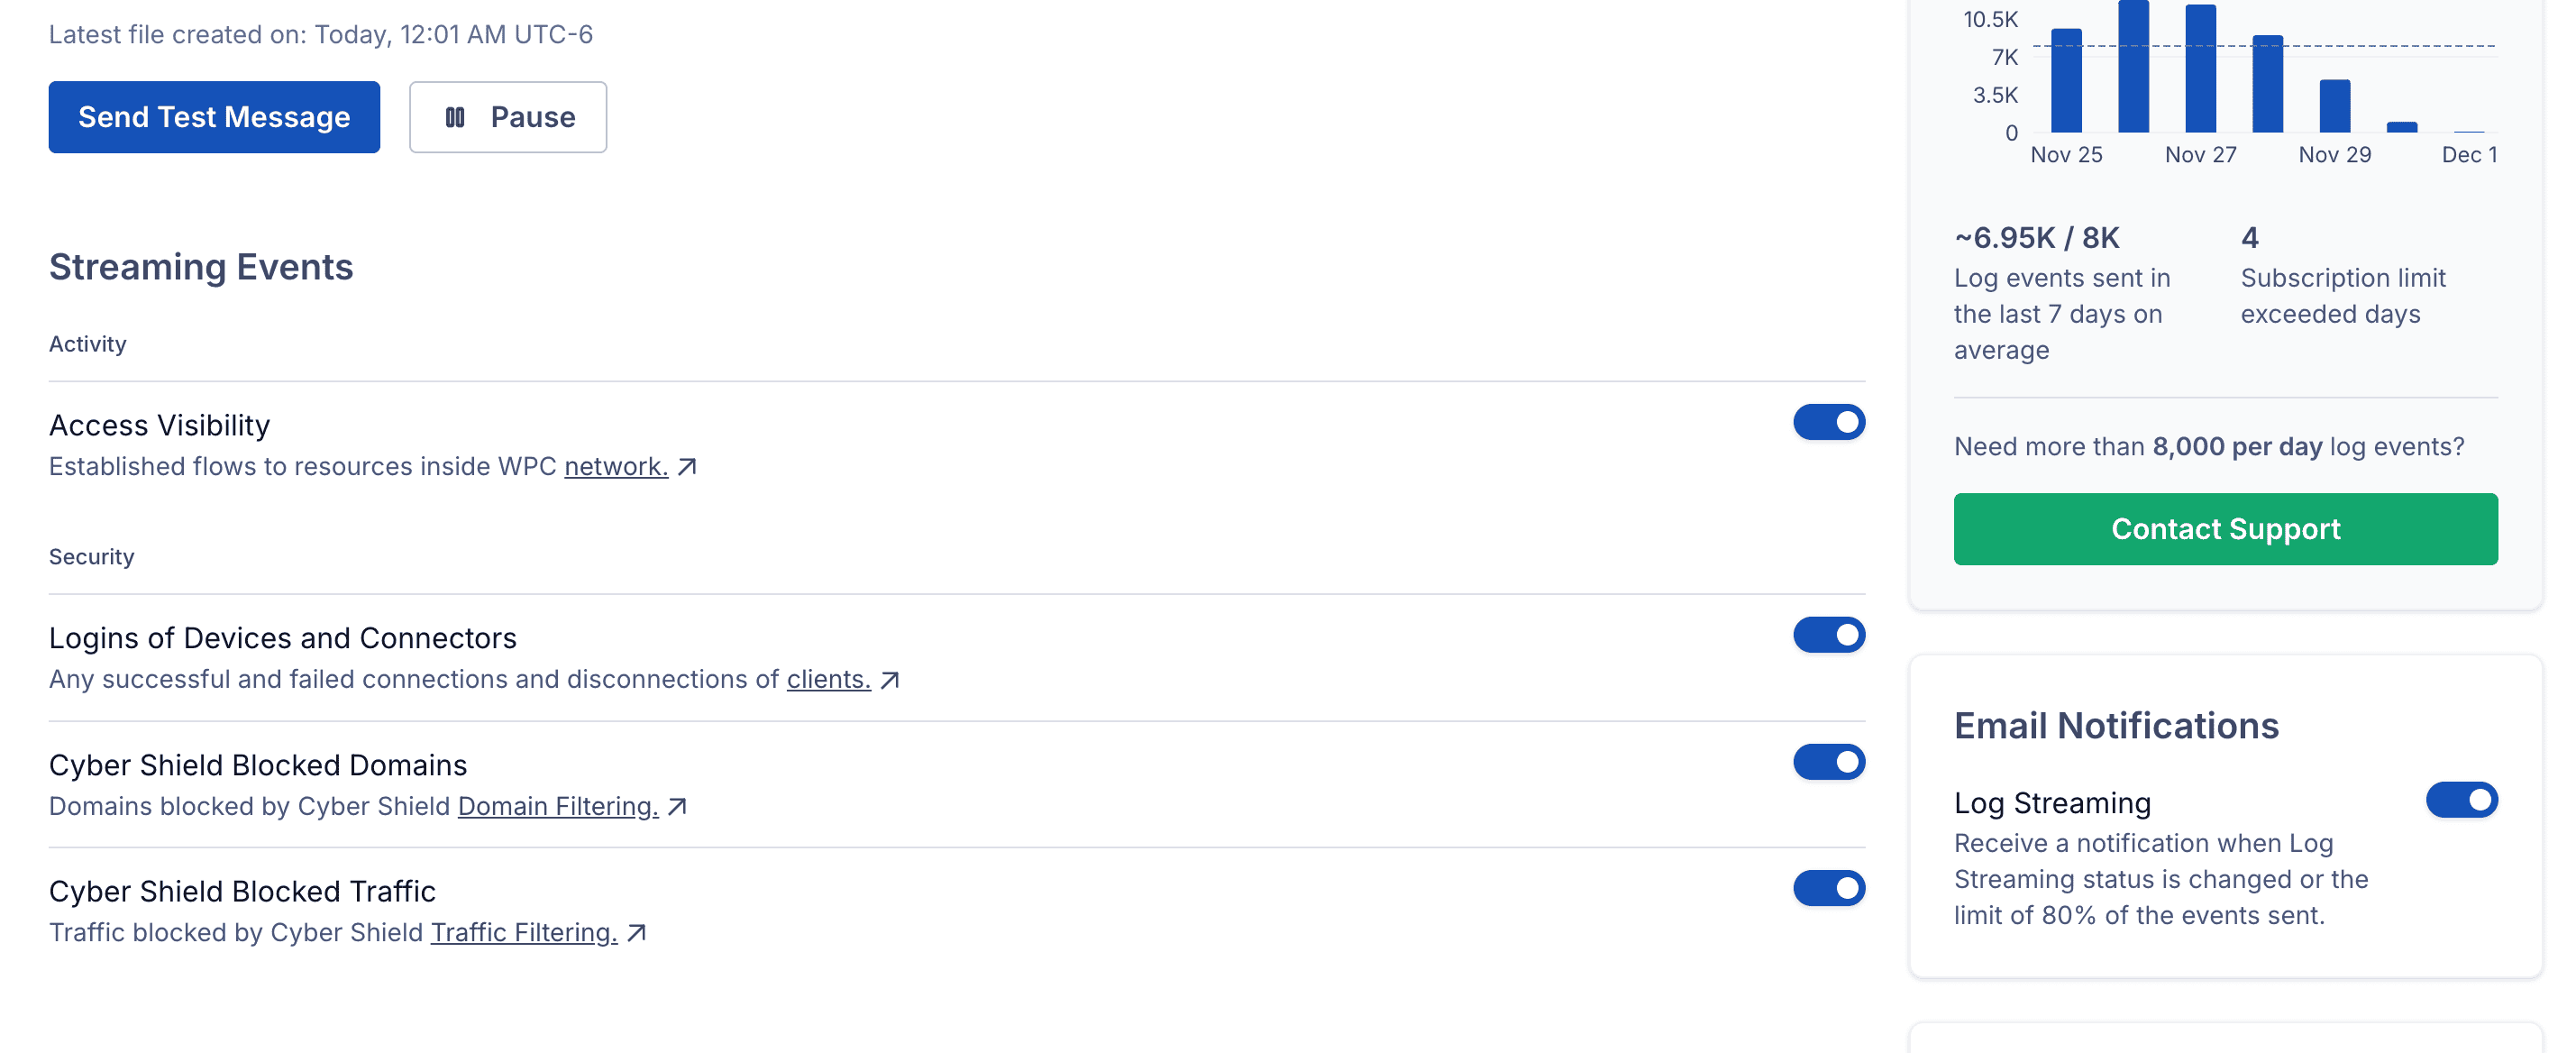
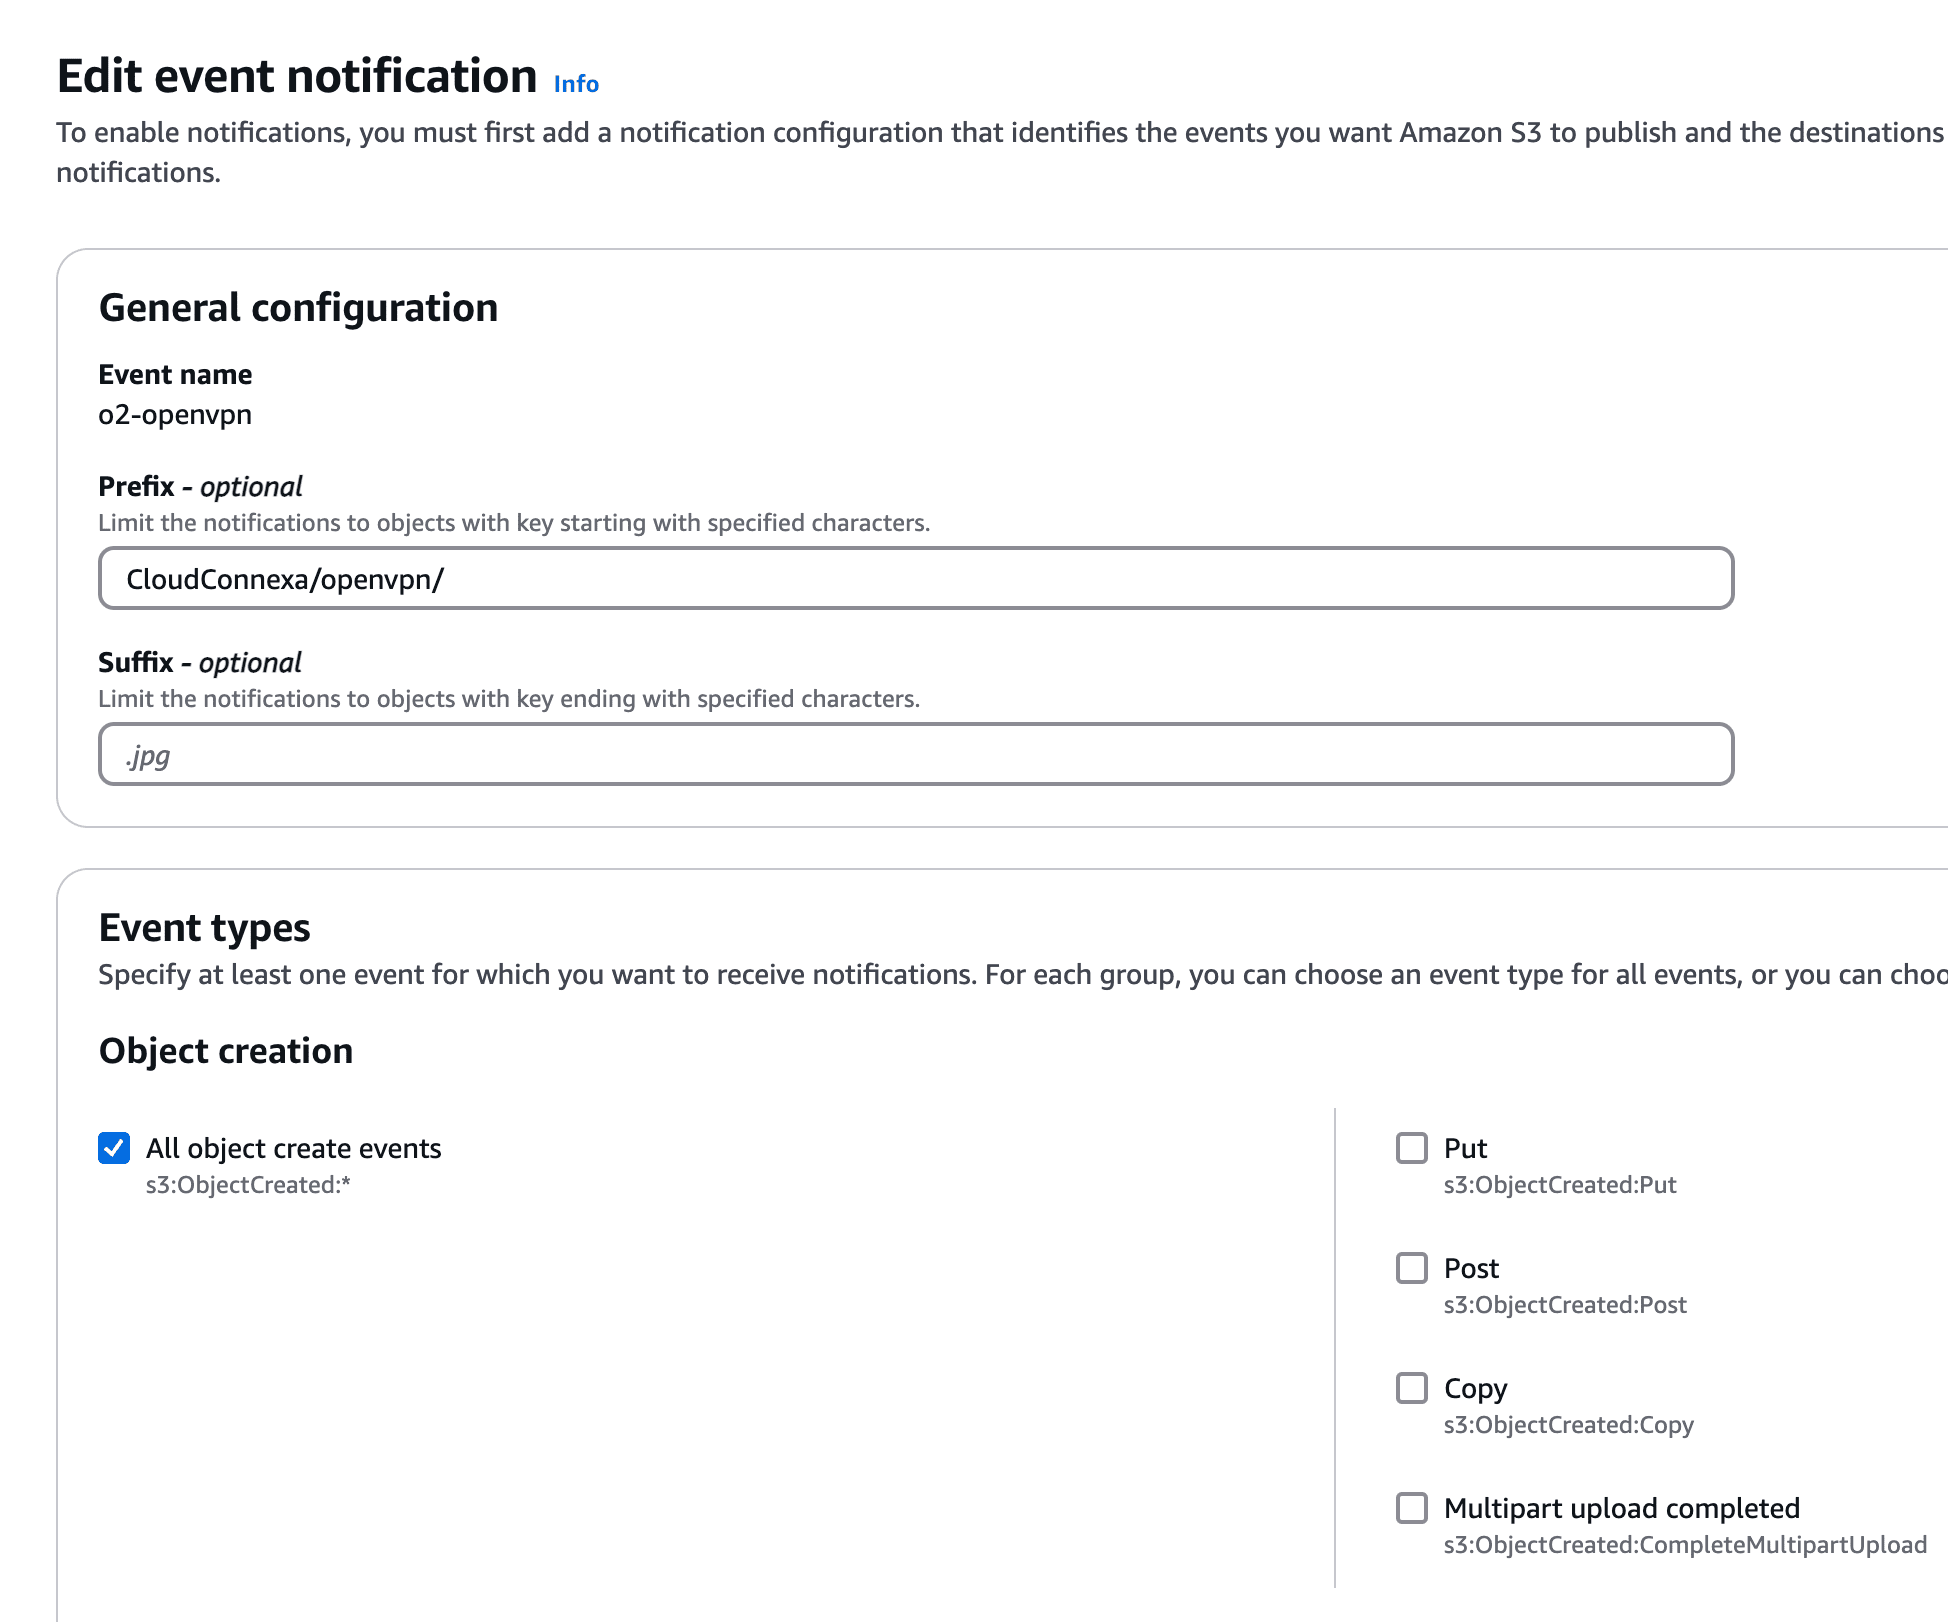
openvpn-logs). Enable OpenVPN Logging:
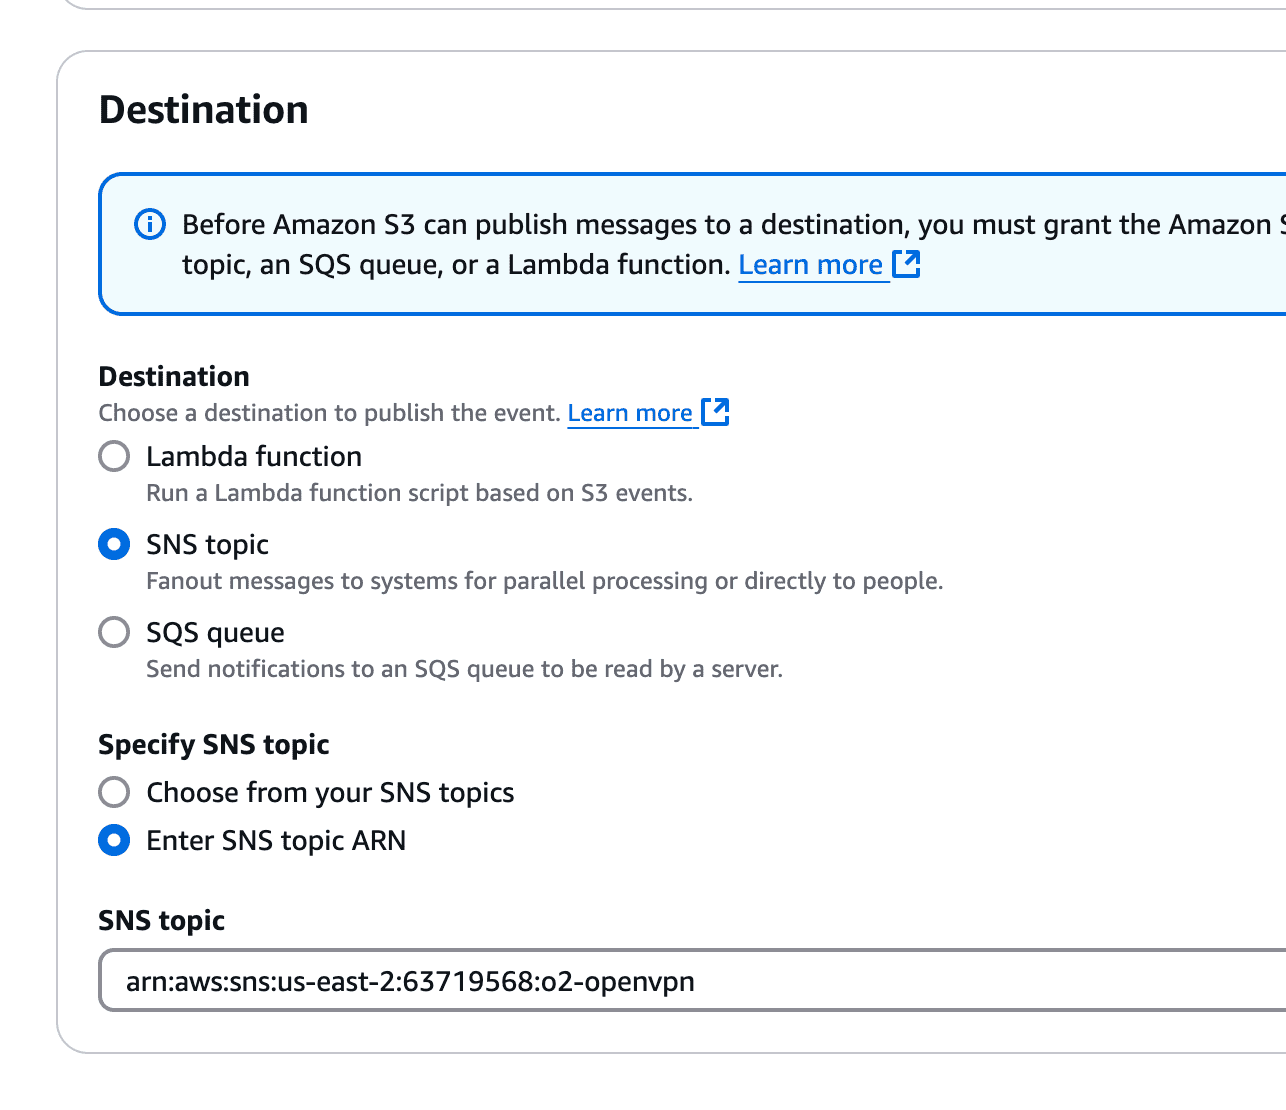
o2-openvpn).
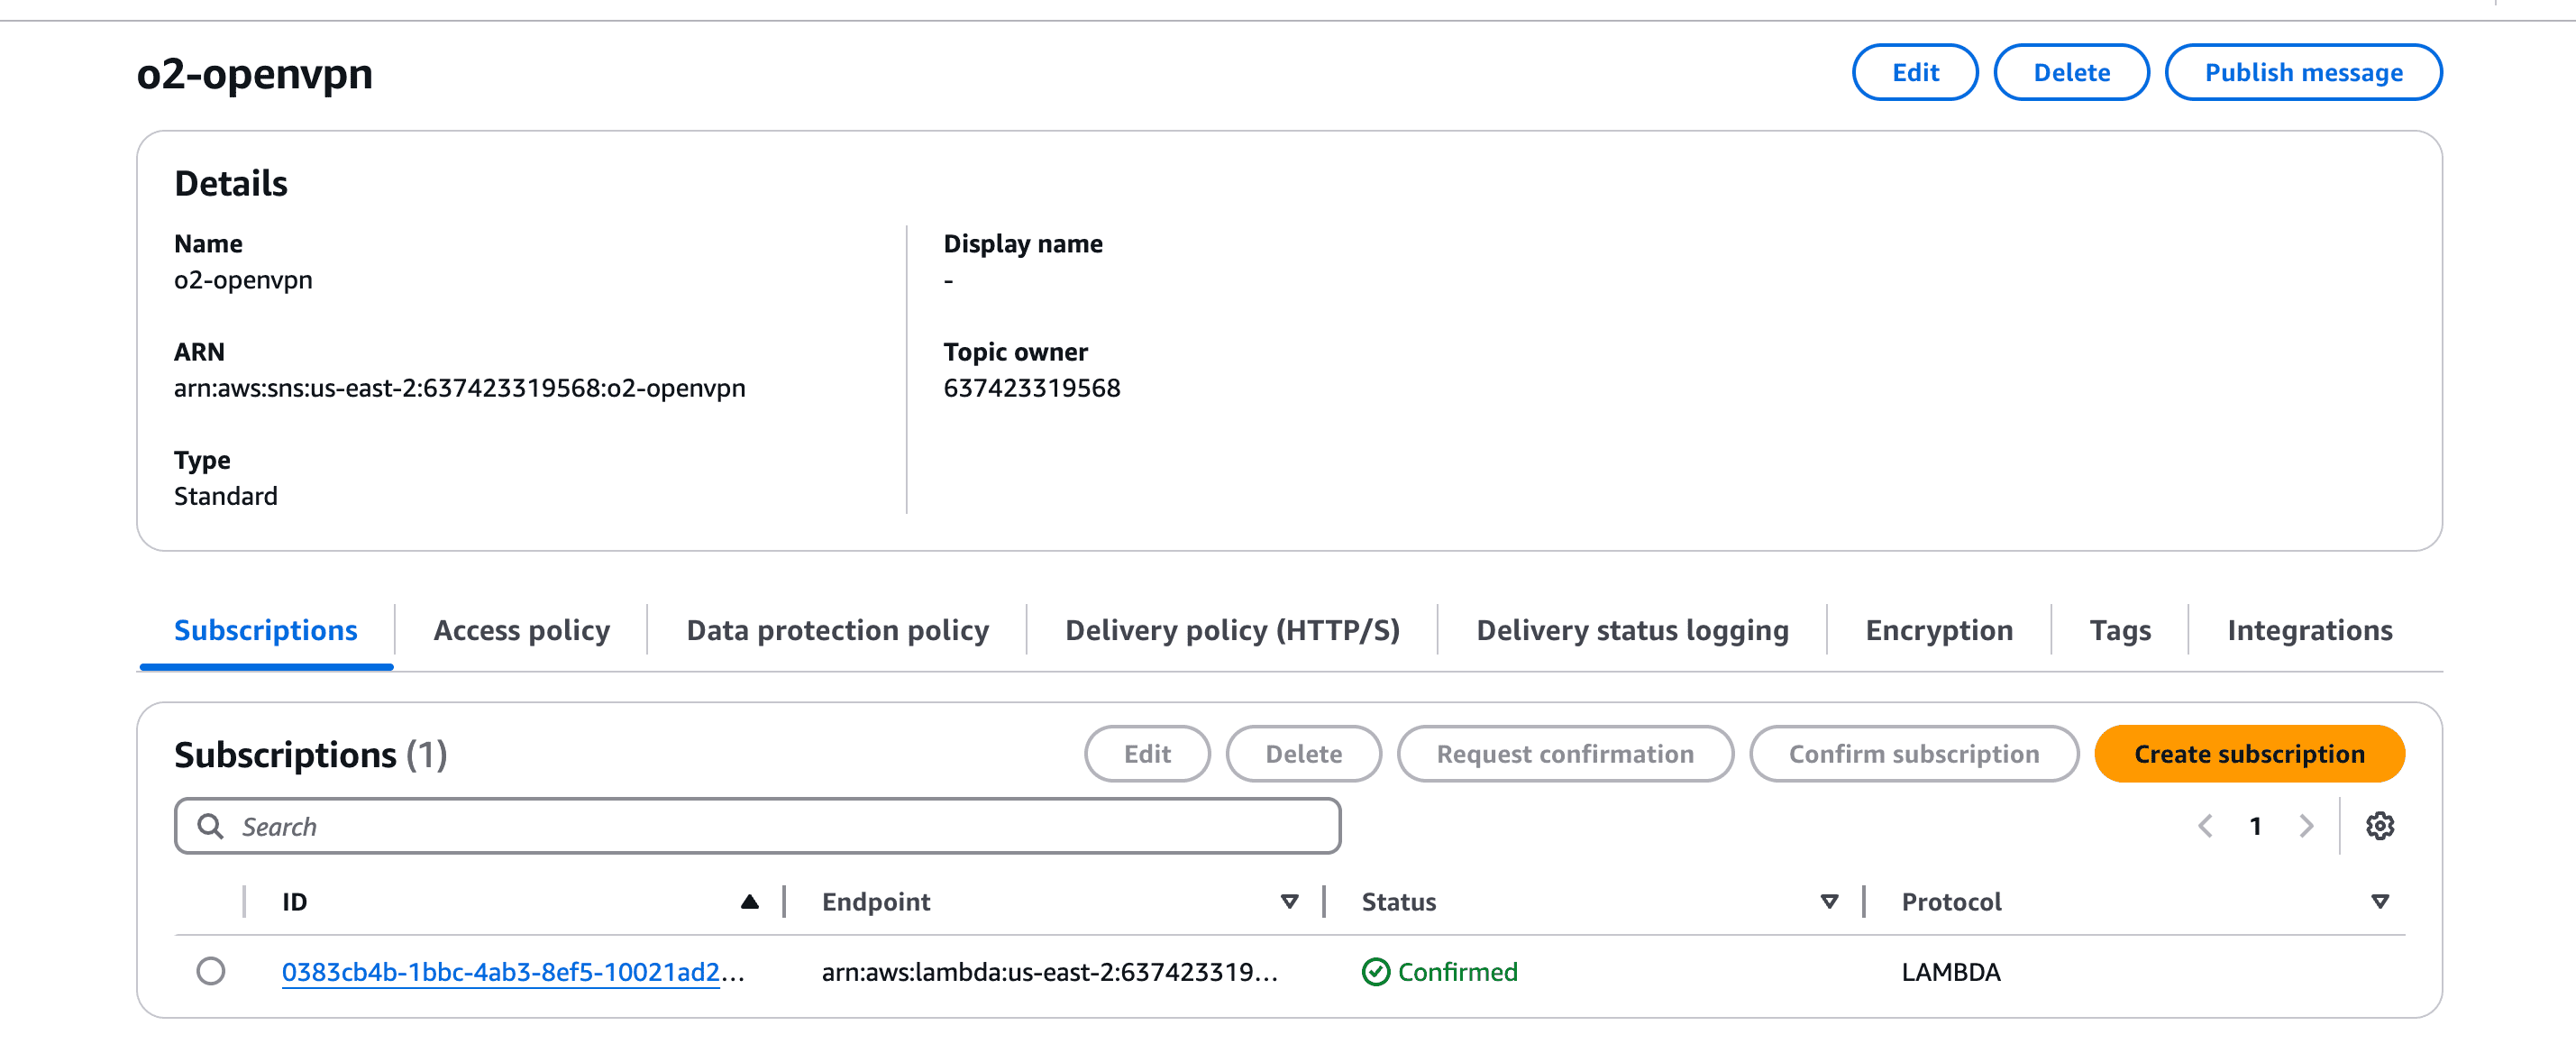
PUT events and select the SNS topic as the target.
process-openvpn-logs). 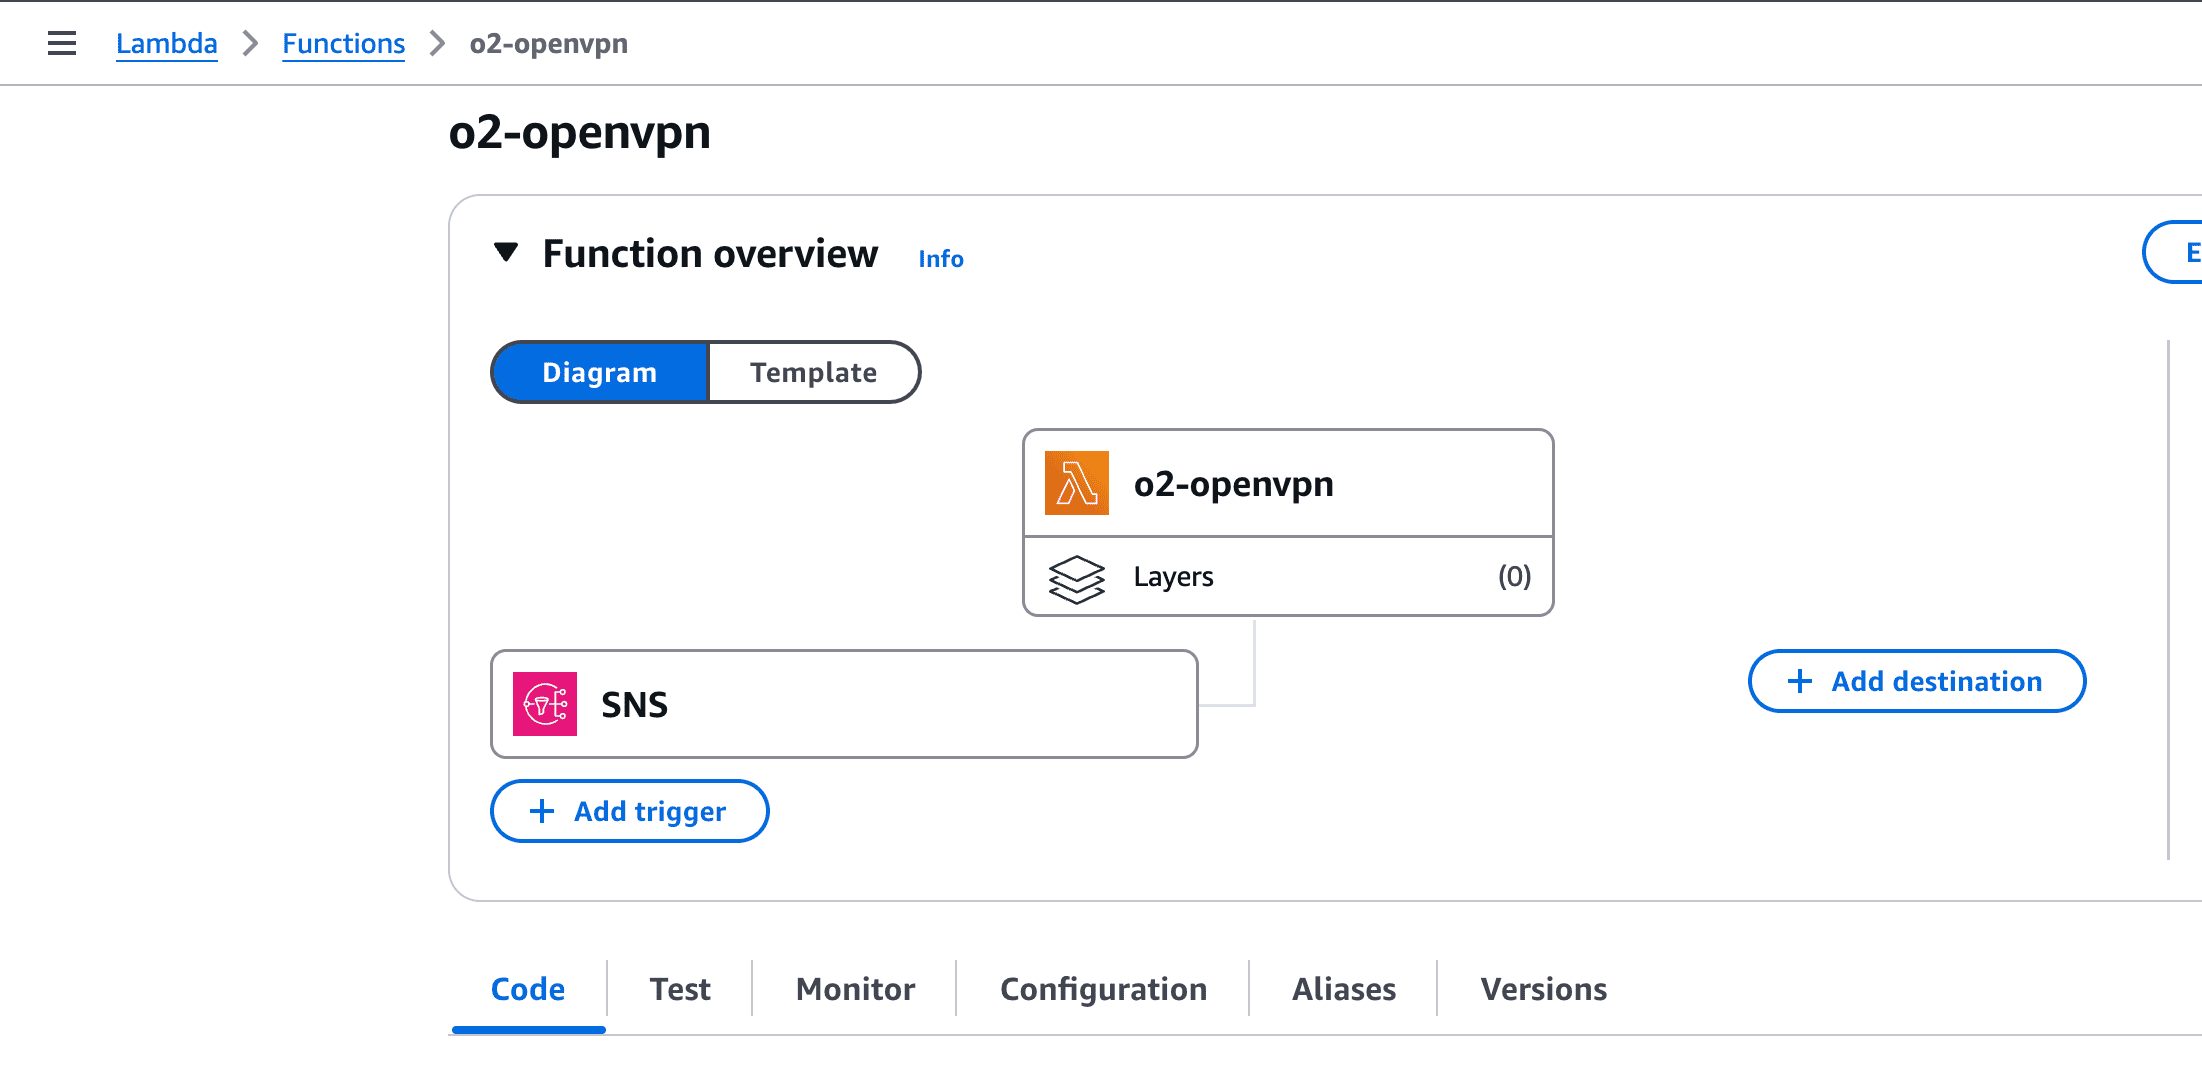
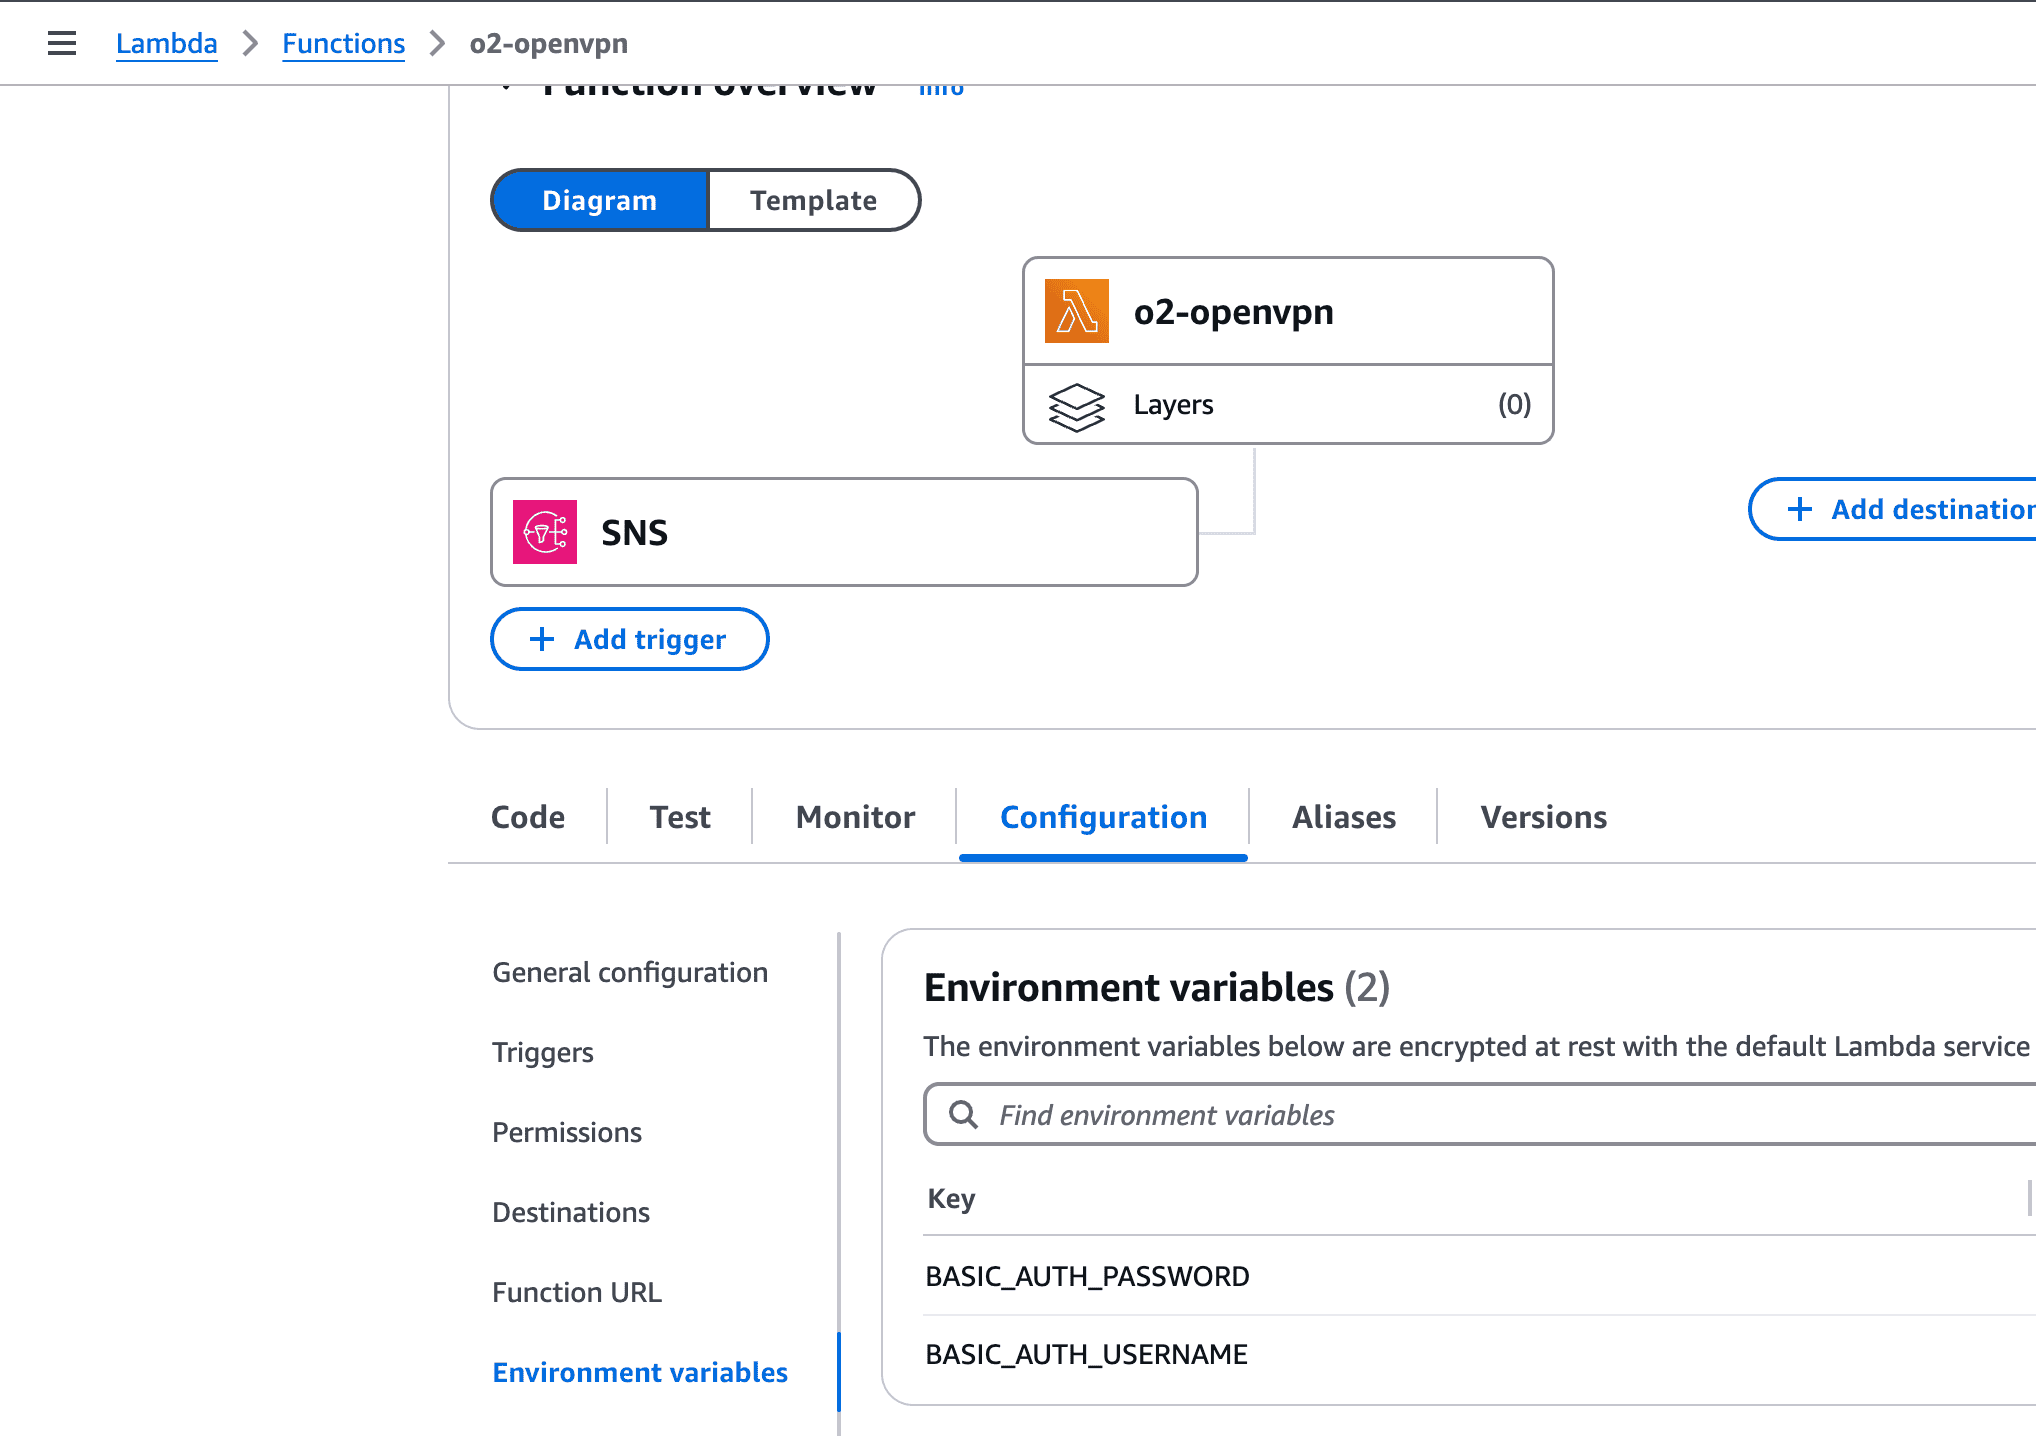
user, IP address, and timestamp.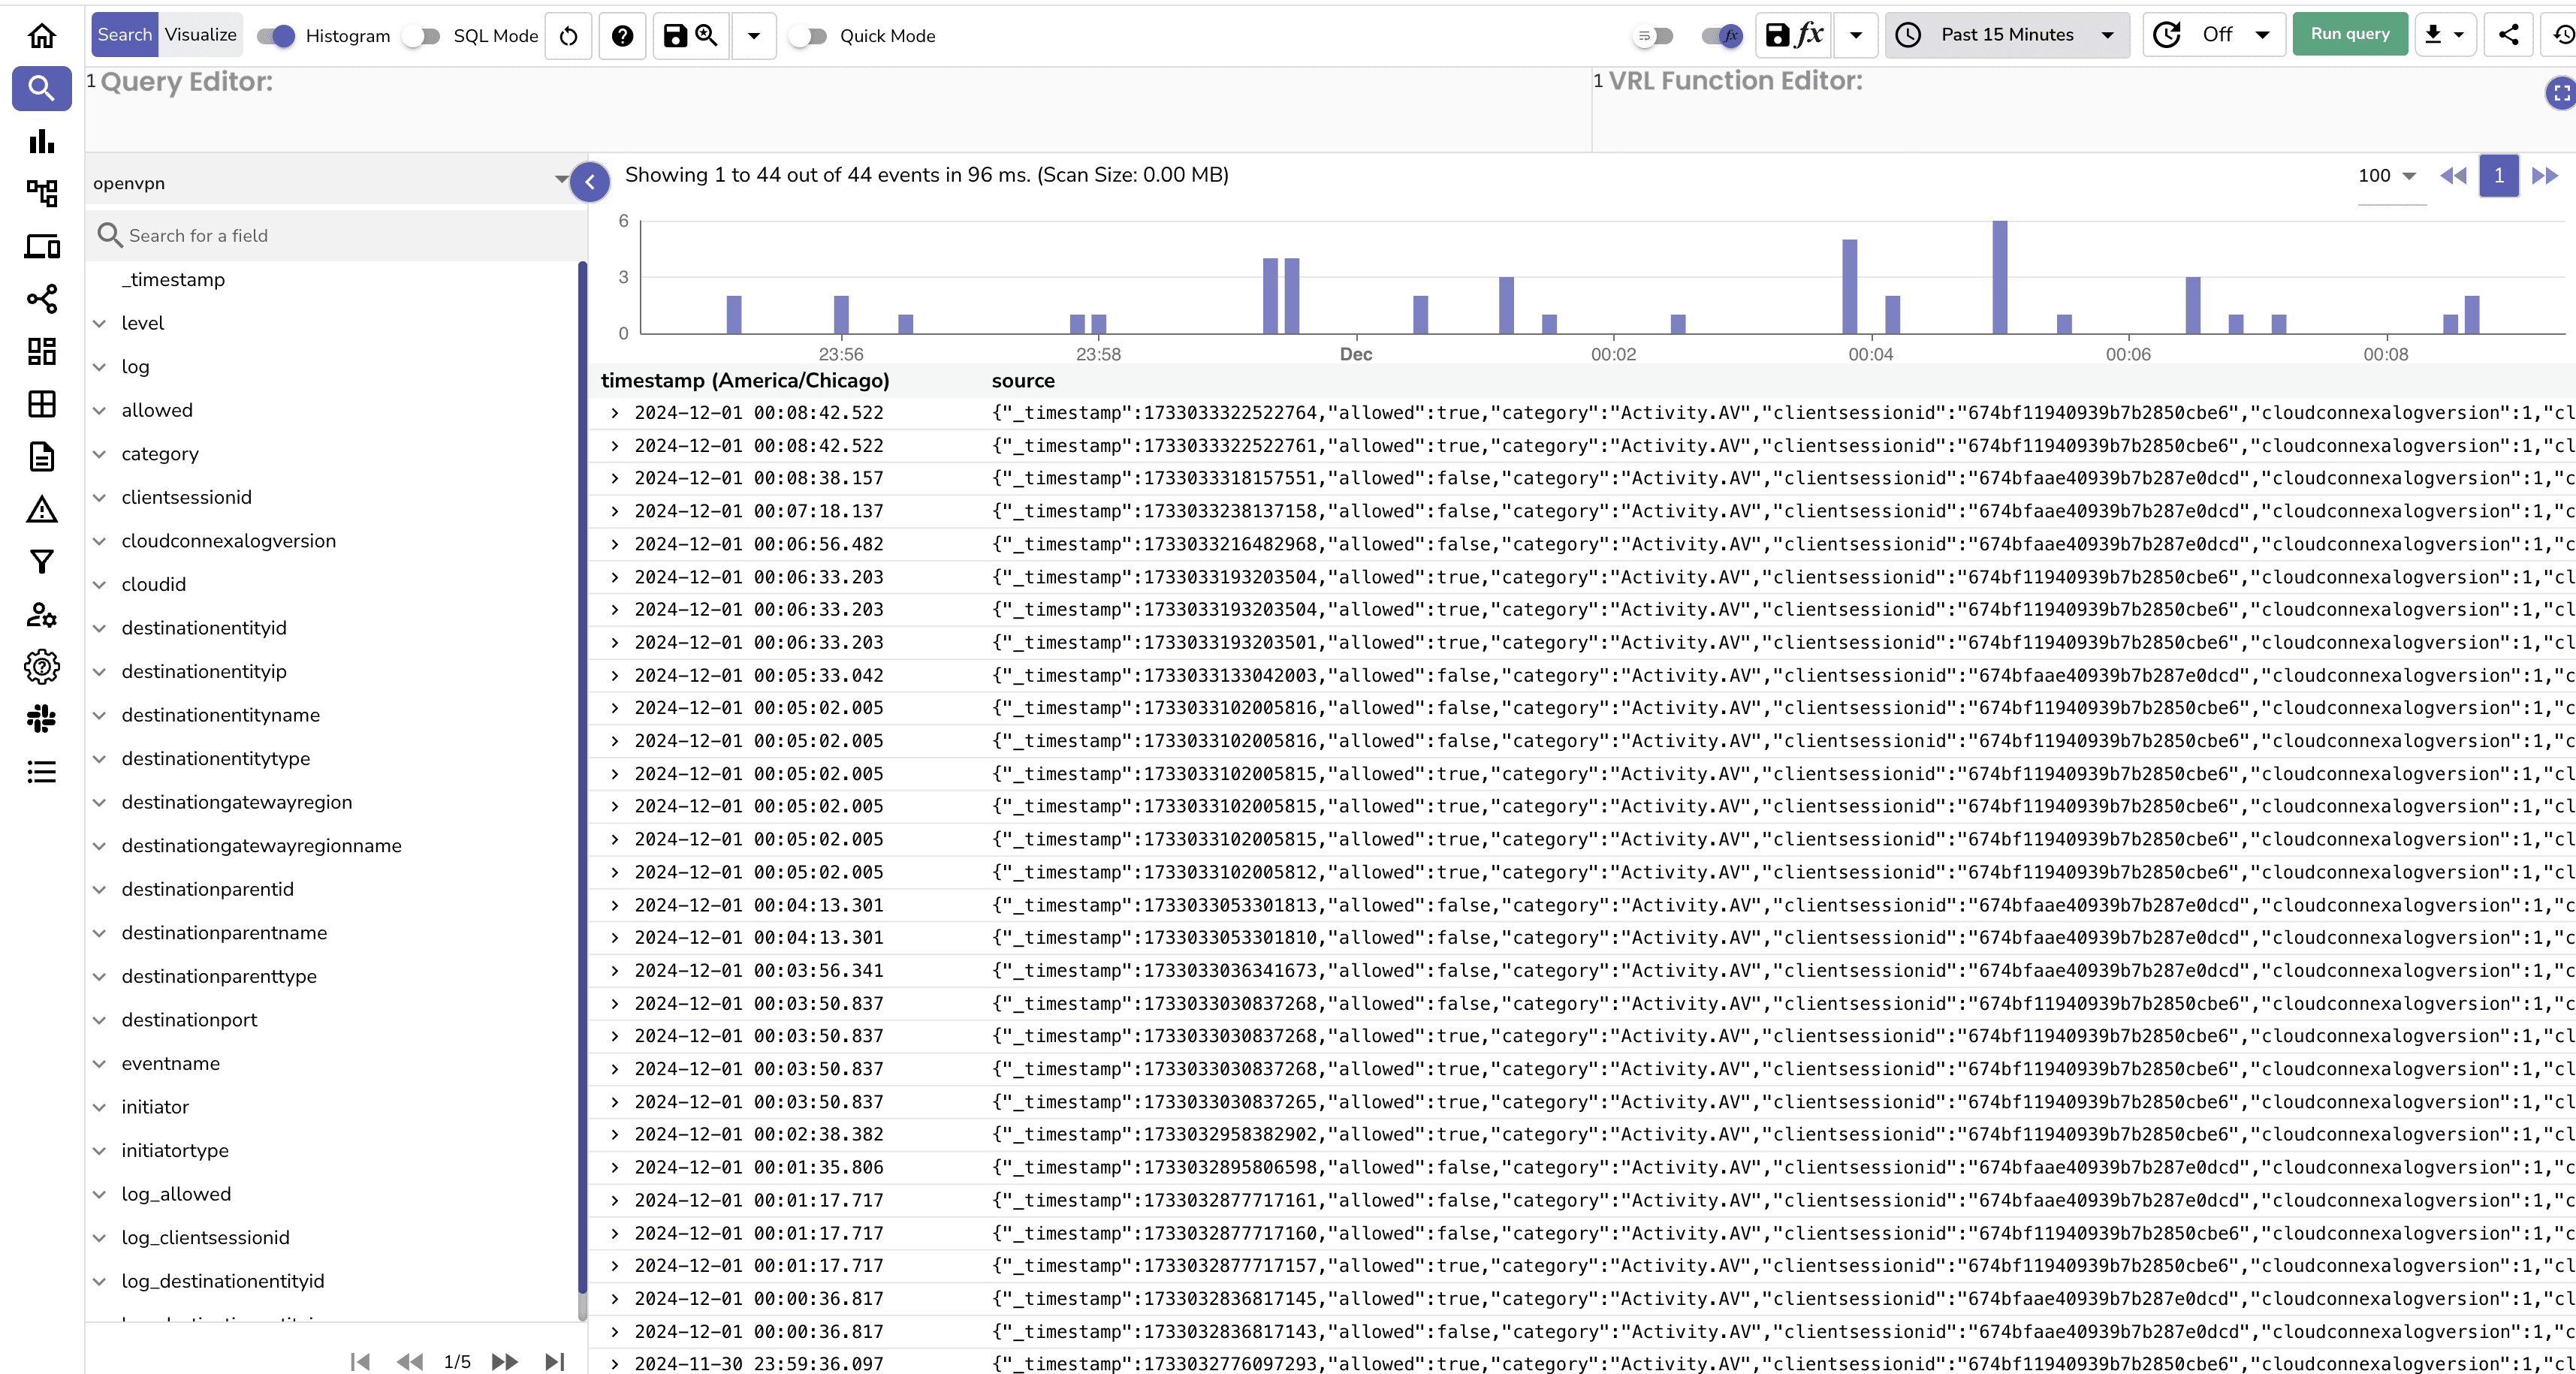

allow, deny, or captcha. | Aspect | Without Ingestion to OpenObserve | With Ingestion to OpenObserve |
|---|---|---|
| Log Accessibility | Logs stored in S3 but require manual retrieval and processing. | Logs automatically available in OpenObserve for real-time analysis. |
| Processing Time | High latency due to manual download and analysis. | Near real-time log processing and visualization. |
| Security Monitoring | Limited visibility, prone to delayed threat detection. | Immediate insights into connection patterns and suspicious activity. |
| Operational Insights | Hard to correlate metrics like bandwidth usage and connection success. | Rich dashboards for bandwidth, connection stats, and user activity. |
| Visualization | Requires custom tools or scripts for log visualization. | Pre-built, customizable dashboards in OpenObserve. |
| Error Detection | Error detection is slow and reactive. | Proactive error detection through alerts and patterns. |
| Compliance Reporting | Manual efforts required to generate reports. | Automated and visually appealing reports with minimal effort. |
| Integration with Tools | Minimal integration with observability or monitoring tools. | Seamless integration with OpenObserve for end-to-end observability. |
| Maintenance Overhead | High, due to manual interventions and custom scripts. | Low, as the pipeline automates ingestion and processing. |
Integrating OpenVPN Connect or OpenVPN Client logs into OpenObserve using AWS services like S3, SNS, and Lambda creates a streamlined pipeline for automated log ingestion. This technical setup ensures real-time observability, enhanced security insights, and scalable log handling for improved operational efficiency.
Want to get started with OpenObserve? Visit our website to learn more about O2 as your observability solution.
Chaitanya Sistla is a Principal Solutions Architect with 17X certifications across Cloud, Data, DevOps, and Cybersecurity. Leveraging extensive startup experience and a focus on MLOps, Chaitanya excels at designing scalable, innovative solutions that drive operational excellence and business transformation.


