How to Set Up AWS RDS Oracle SE2 with OpenObserve: Complete Monitoring Guide

Chaitanya Sistla
April 03, 2025
7 min read
Don’t forget to share!
Try OpenObserve Cloud today for more efficient and performant observability.
AWS RDS Oracle Standard Edition 2 (SE2) offers a robust and scalable option for organizations seeking reliable database performance. However, the real power of any database solution lies not just in its setup but also in how effectively you can monitor and optimize its performance. This is where OpenObserve comes into play, providing comprehensive monitoring capabilities that transform how you manage your AWS RDS Oracle instances.
This guide walks you through setting up AWS RDS Oracle SE2 and integrating it with OpenObserve to achieve superior monitoring, alerting, and visualization capabilities.
AWS RDS Oracle Standard Edition 2 provides a managed database service that simplifies database administration tasks while offering the power and flexibility of Oracle's database technology. Oracle SE2 on RDS combines the robust features of Oracle with the scalability, reliability, and security of AWS infrastructure.
Key benefits of AWS RDS Oracle SE2 include:
Let's dive into setting up an AWS RDS Oracle SE2 instance:
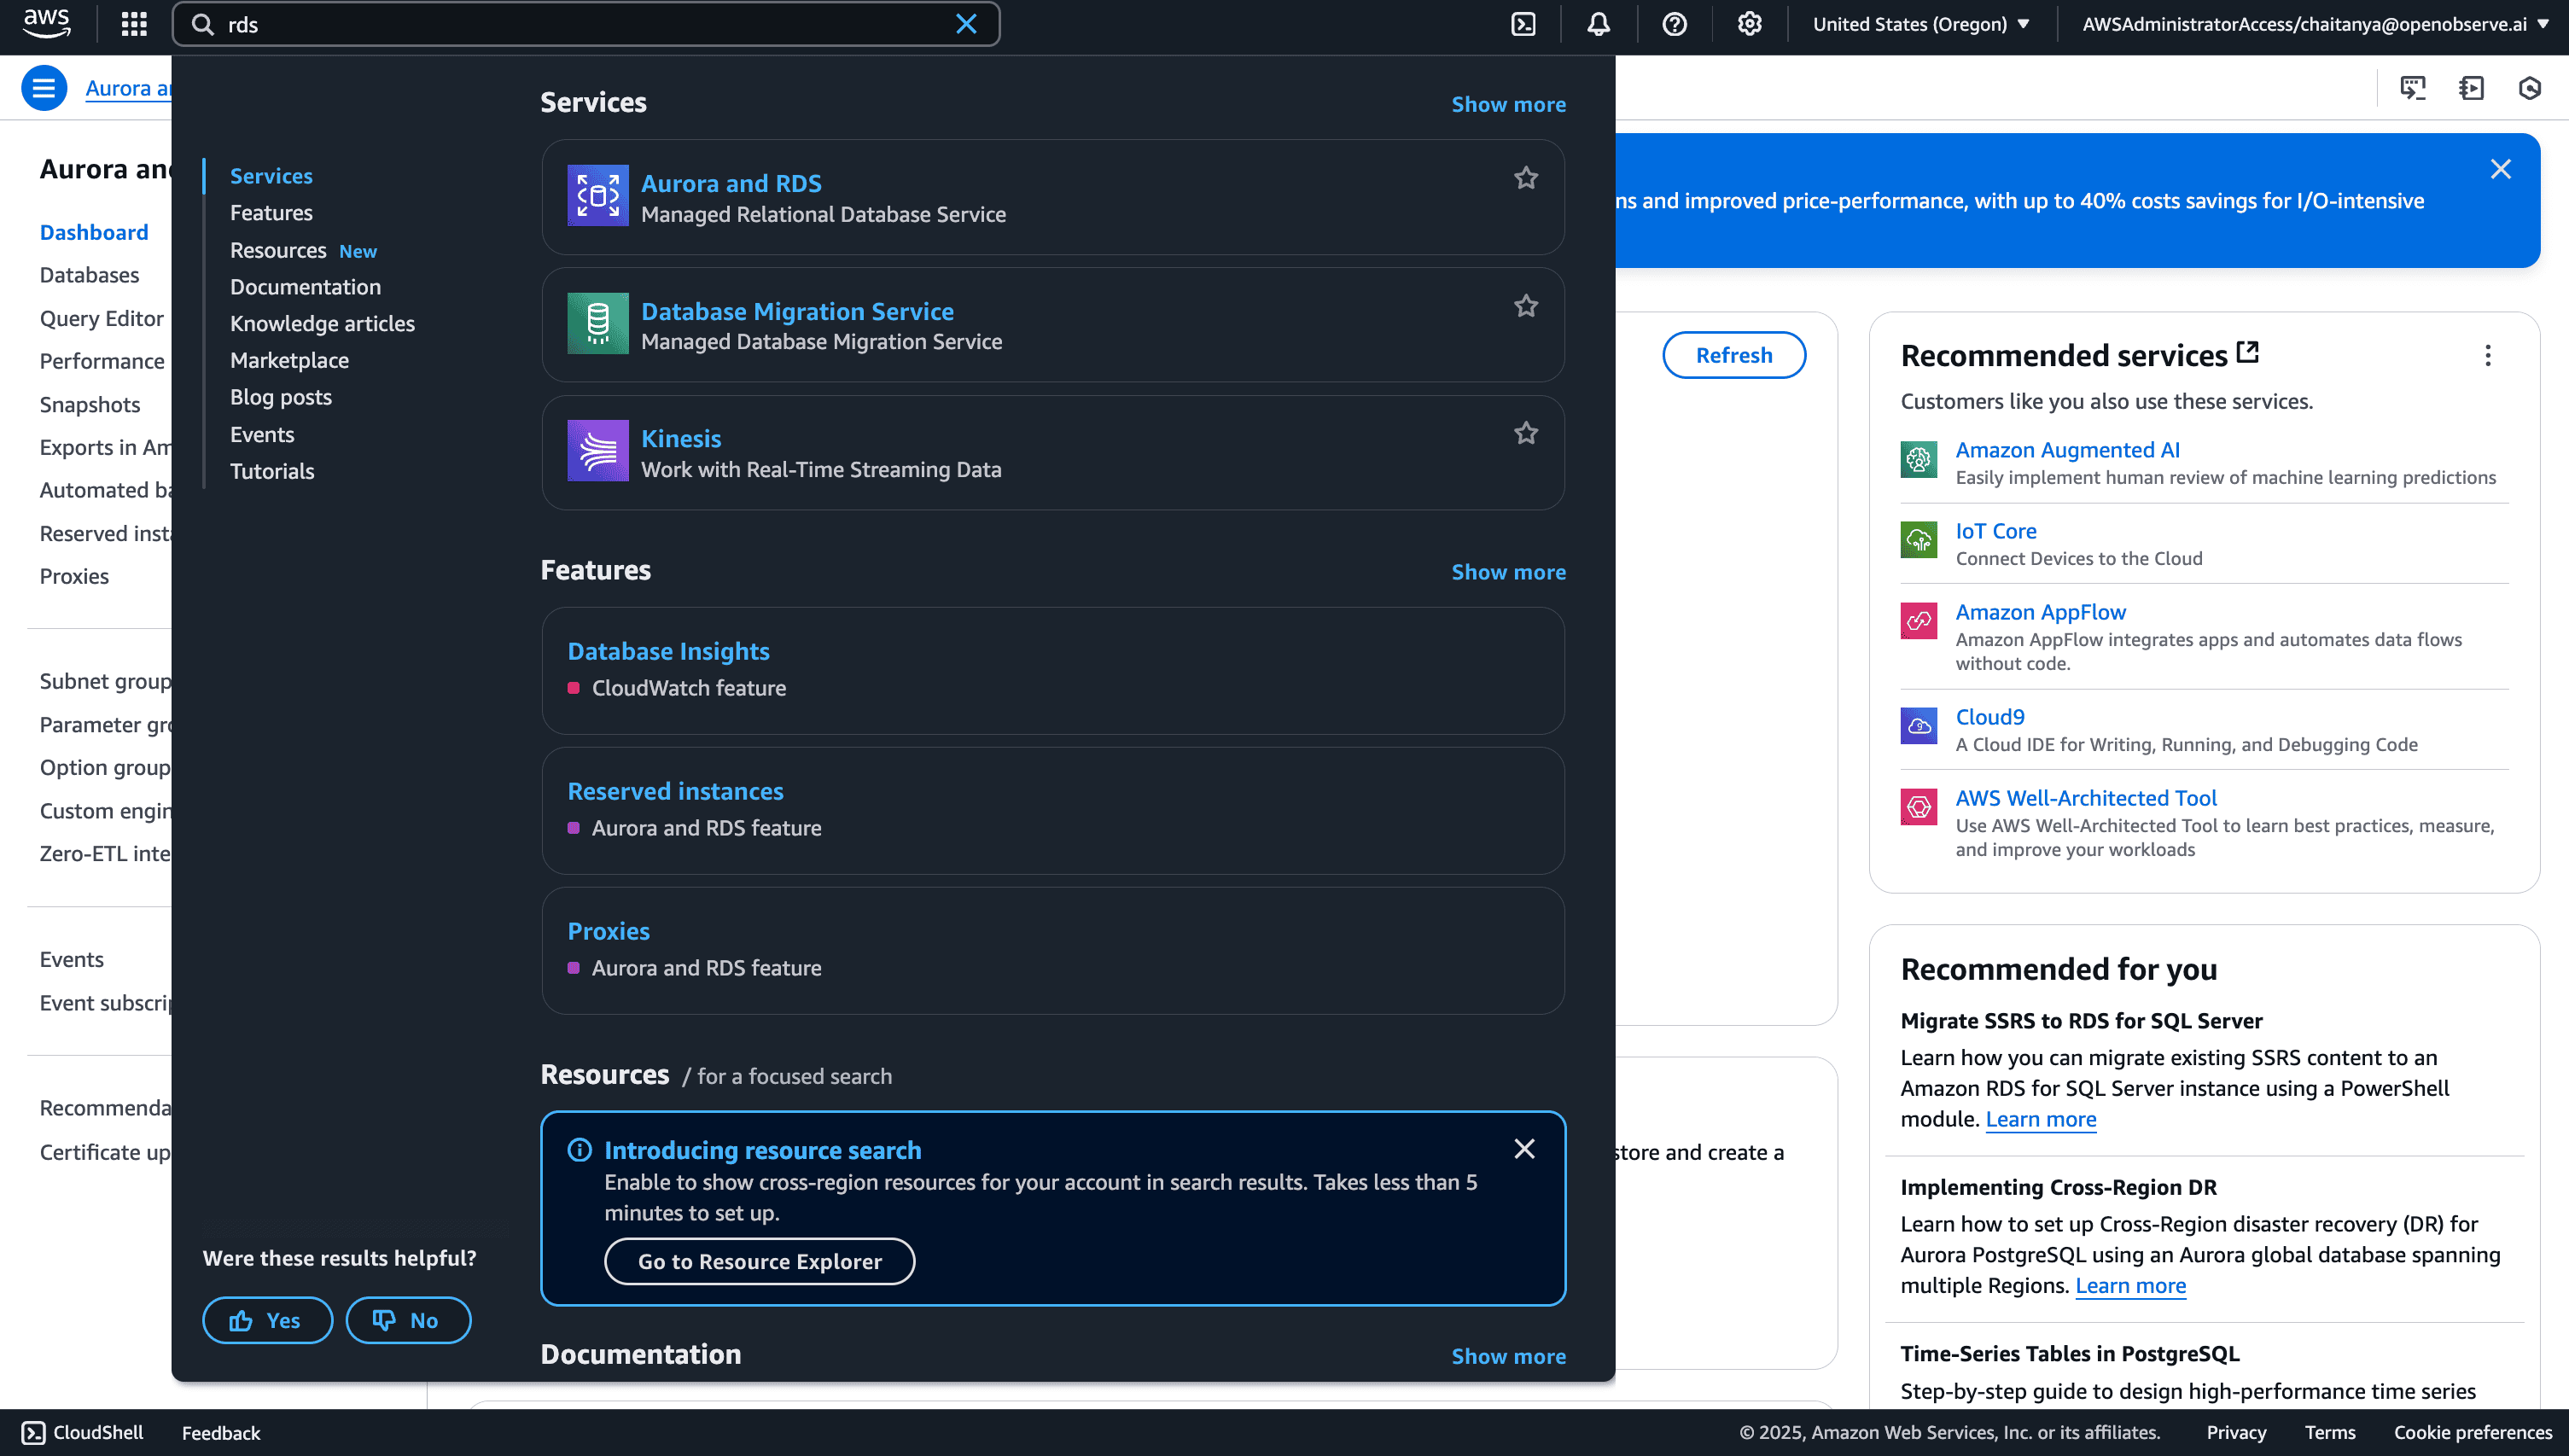
Navigate to the AWS Management Console and access the RDS service.
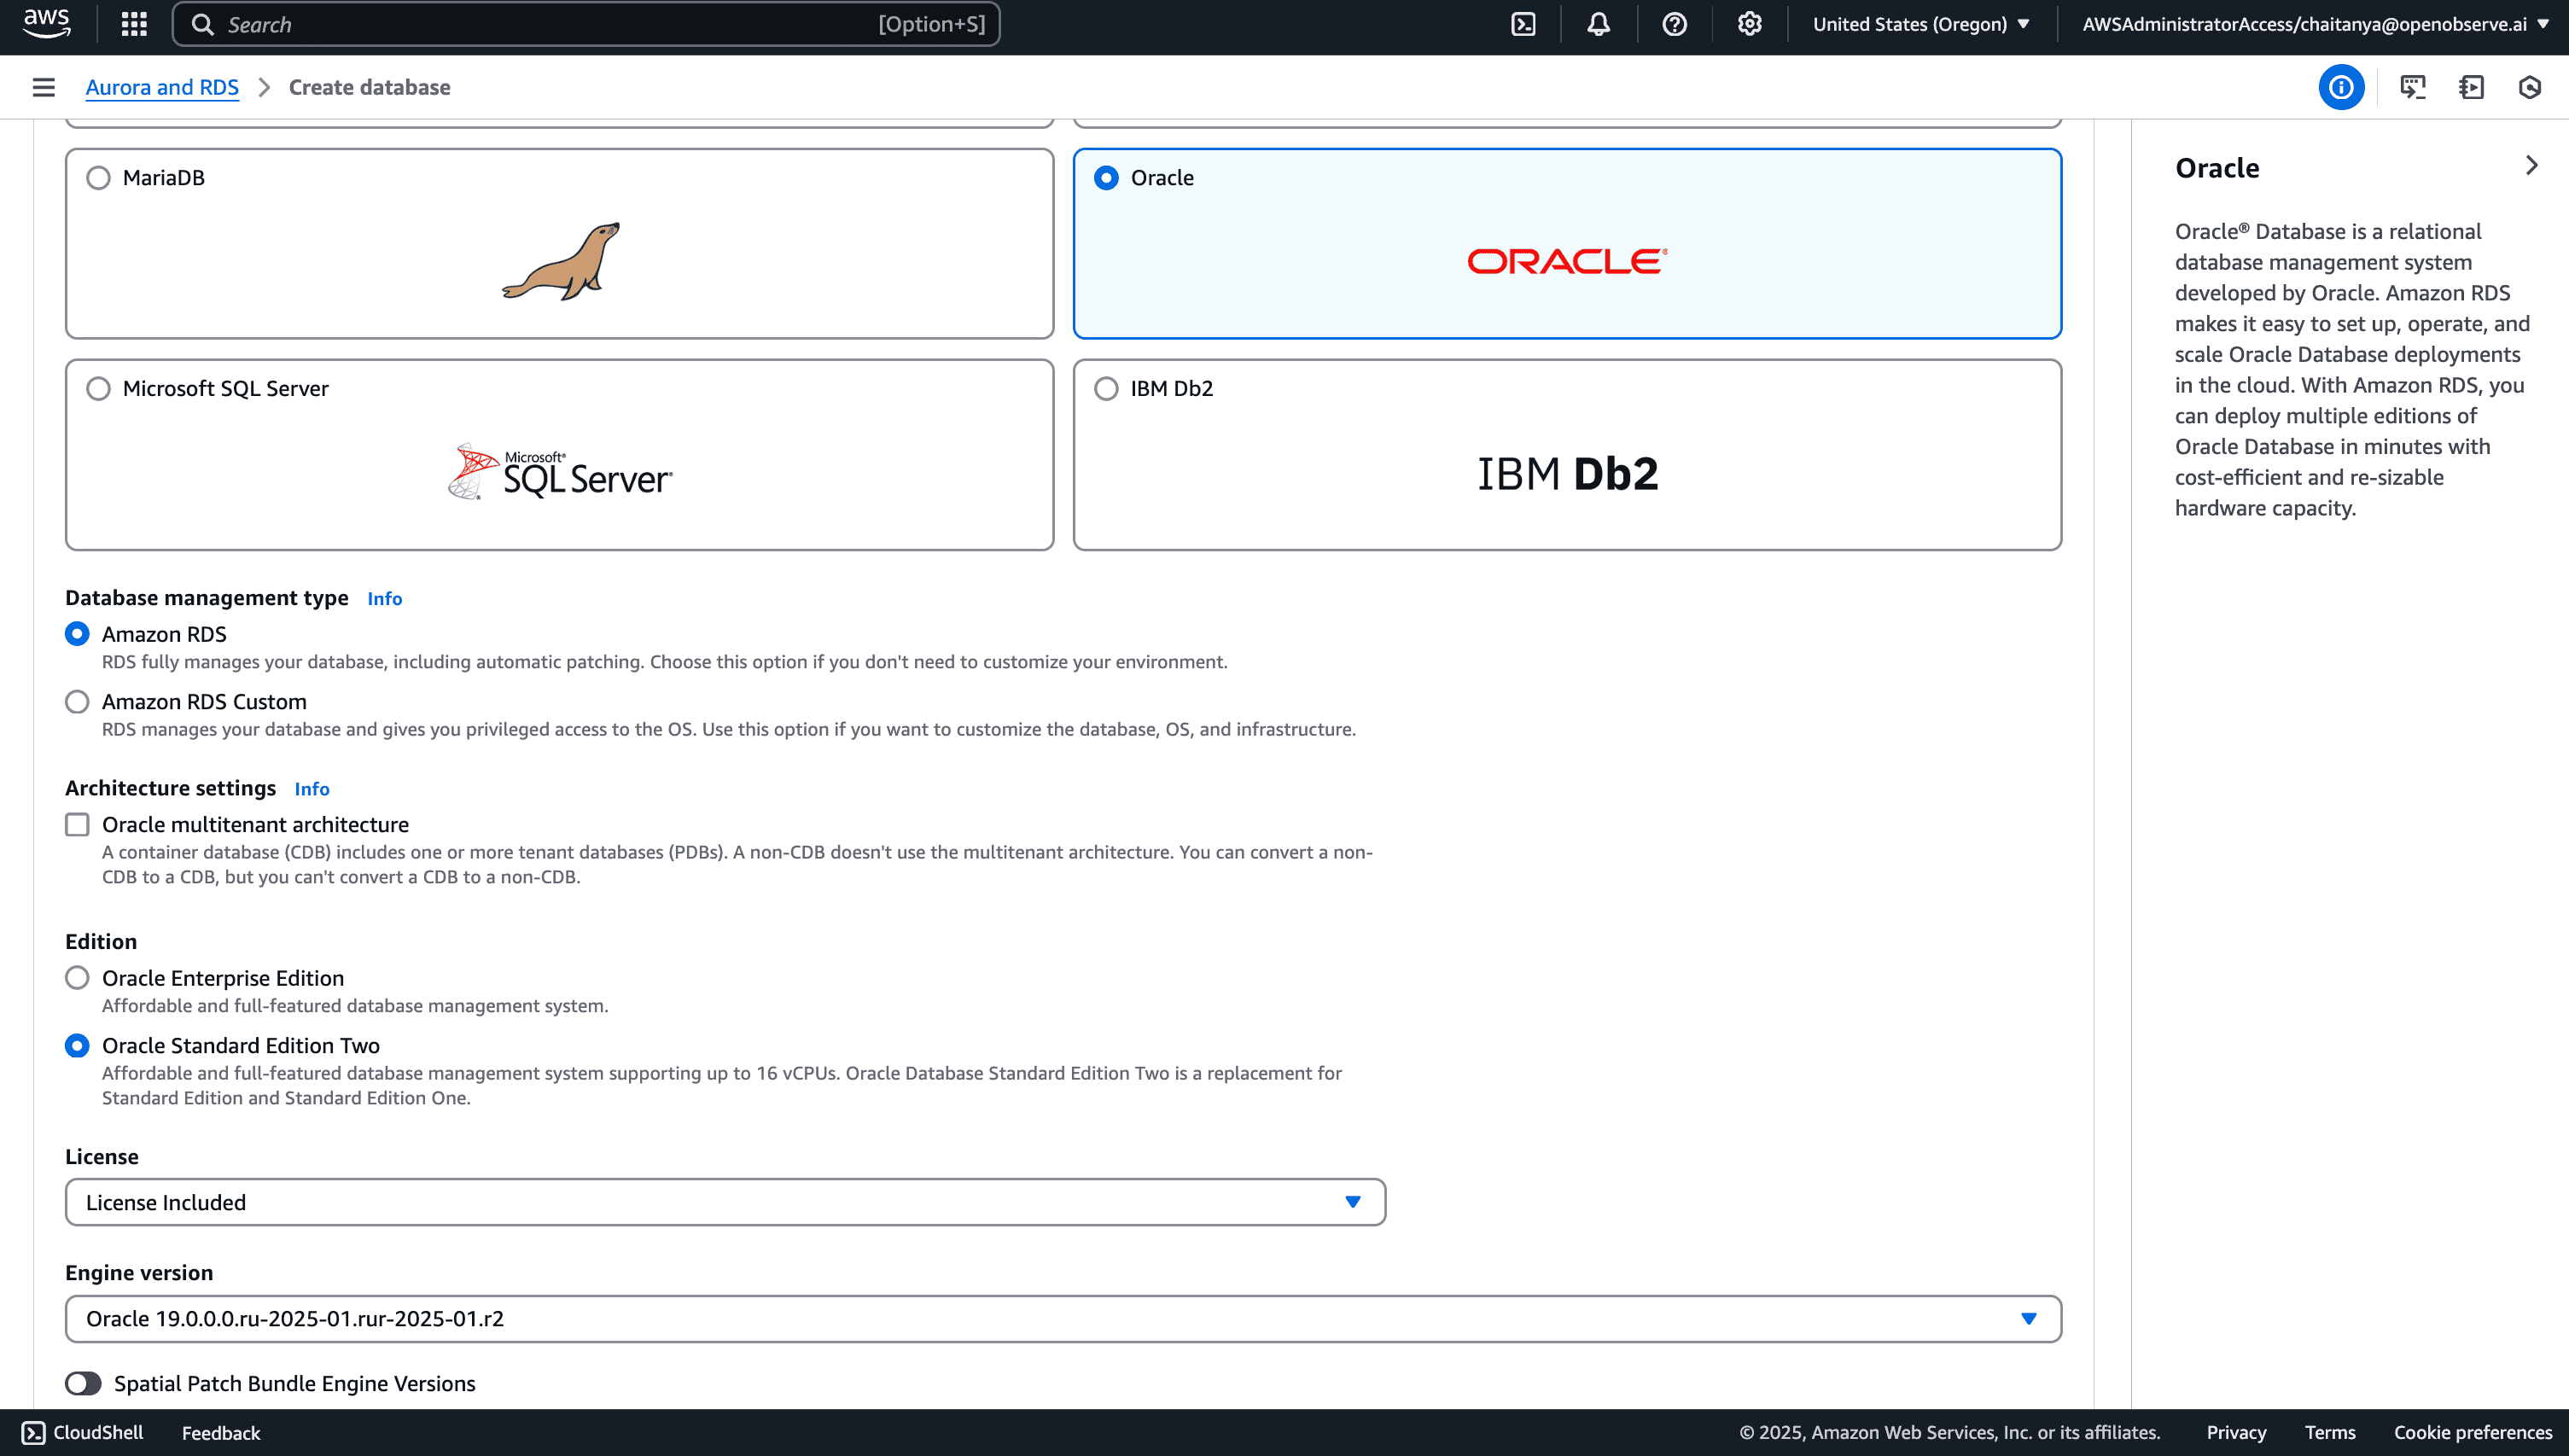
Set instance specifications:
Configure availability:
Review all your settings and click "Create database." The instance creation process typically takes 15-20 minutes.
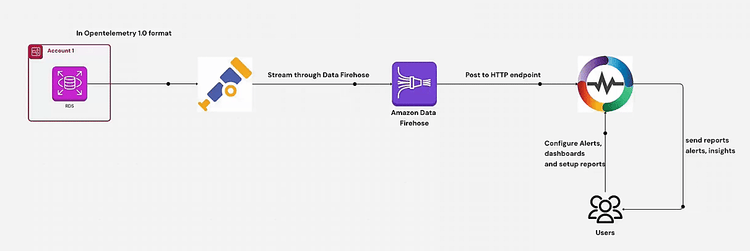
While AWS provides basic monitoring through CloudWatch, OpenObserve offers a more comprehensive monitoring solution with advanced analytics, alerting, and visualization capabilities.
For seamless integration between AWS RDS Oracle SE2 and OpenObserve, CloudFormation templates simplify the process of setting up metric collection. OpenObserve provides ready-to-use CloudFormation templates that automatically configure your AWS environment to send all RDS metrics to your OpenObserve instance.
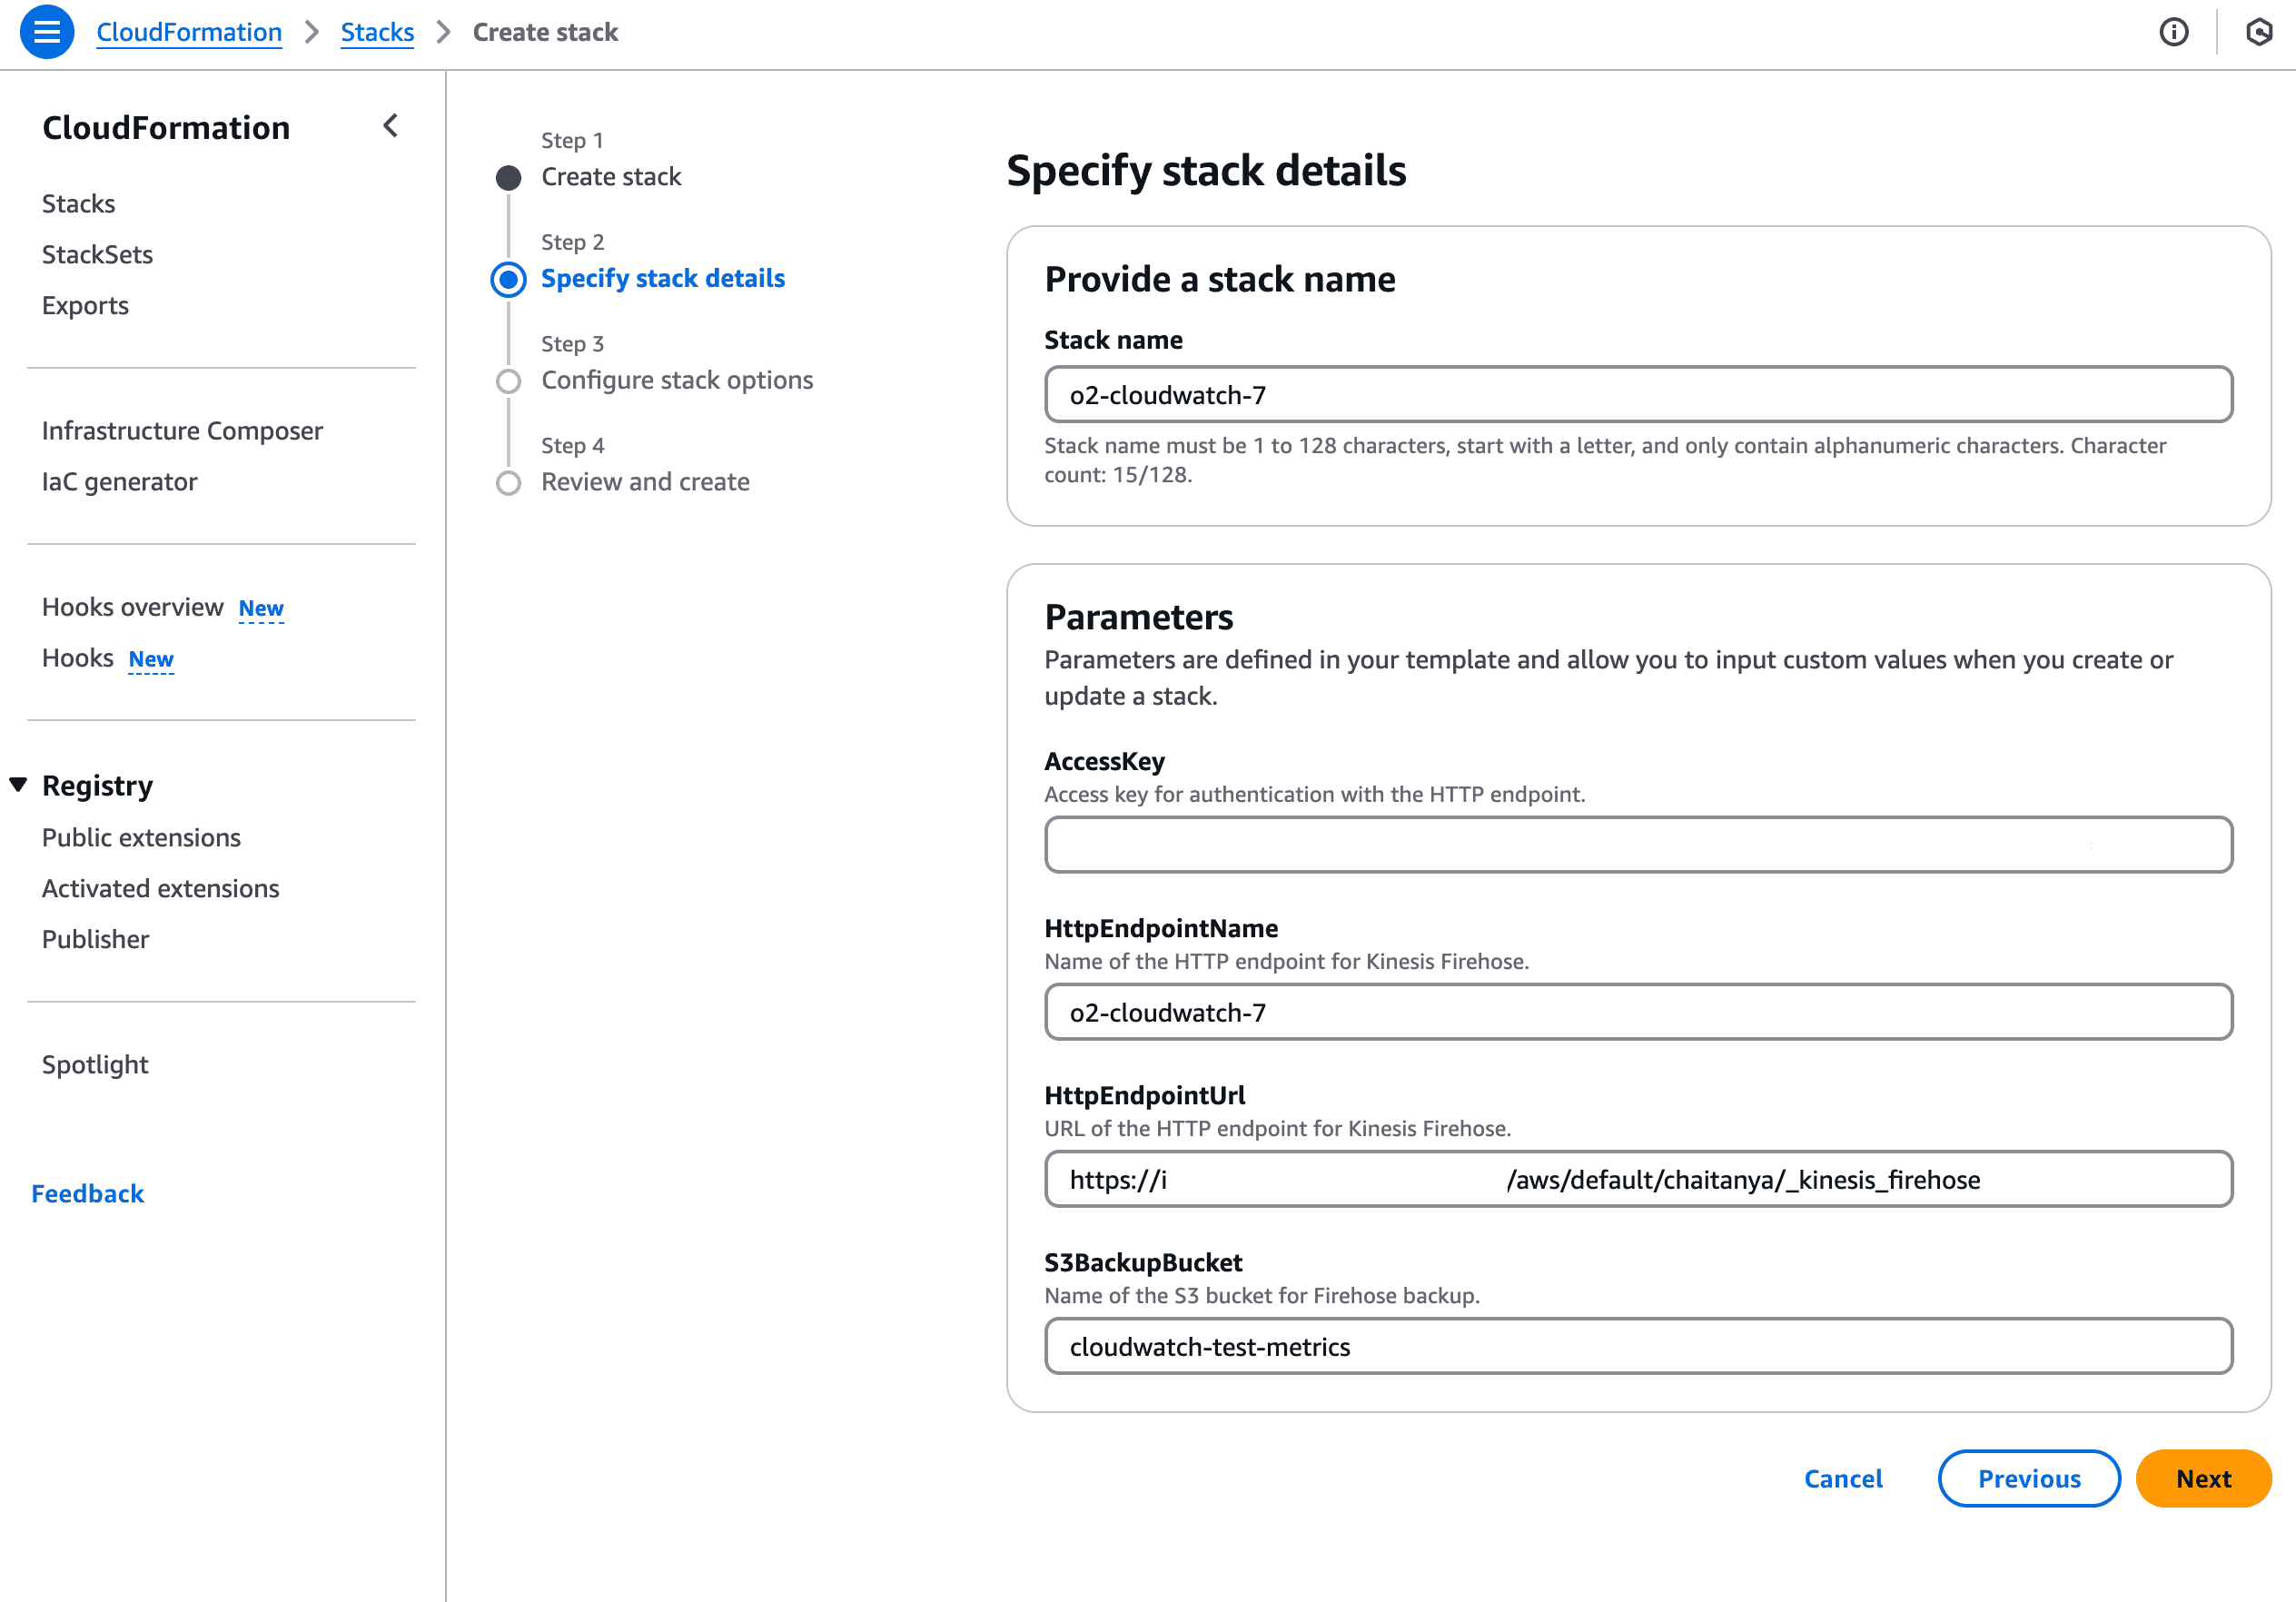
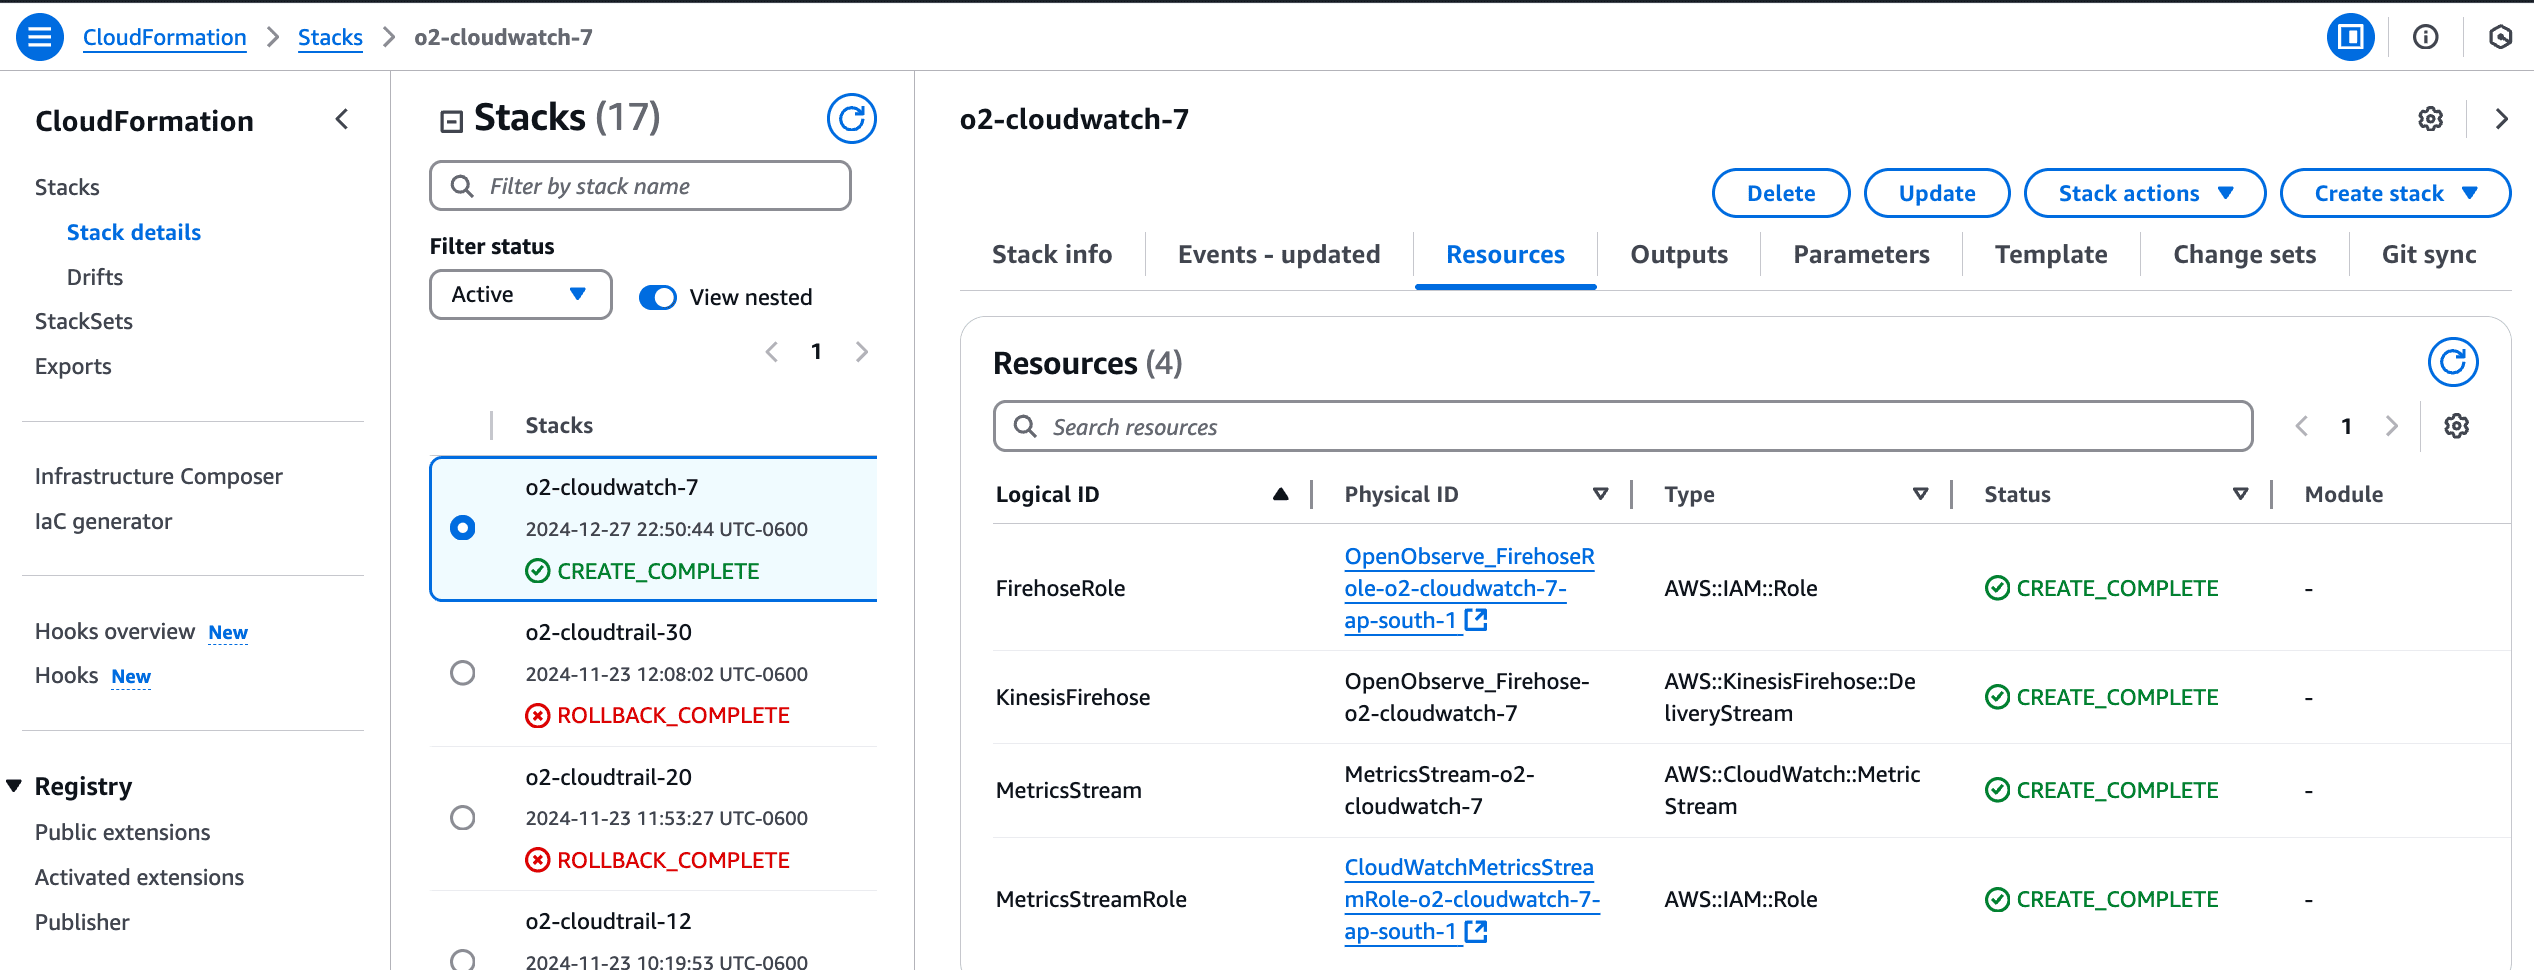
Once deployed, the CloudFormation stack creates all necessary resources.
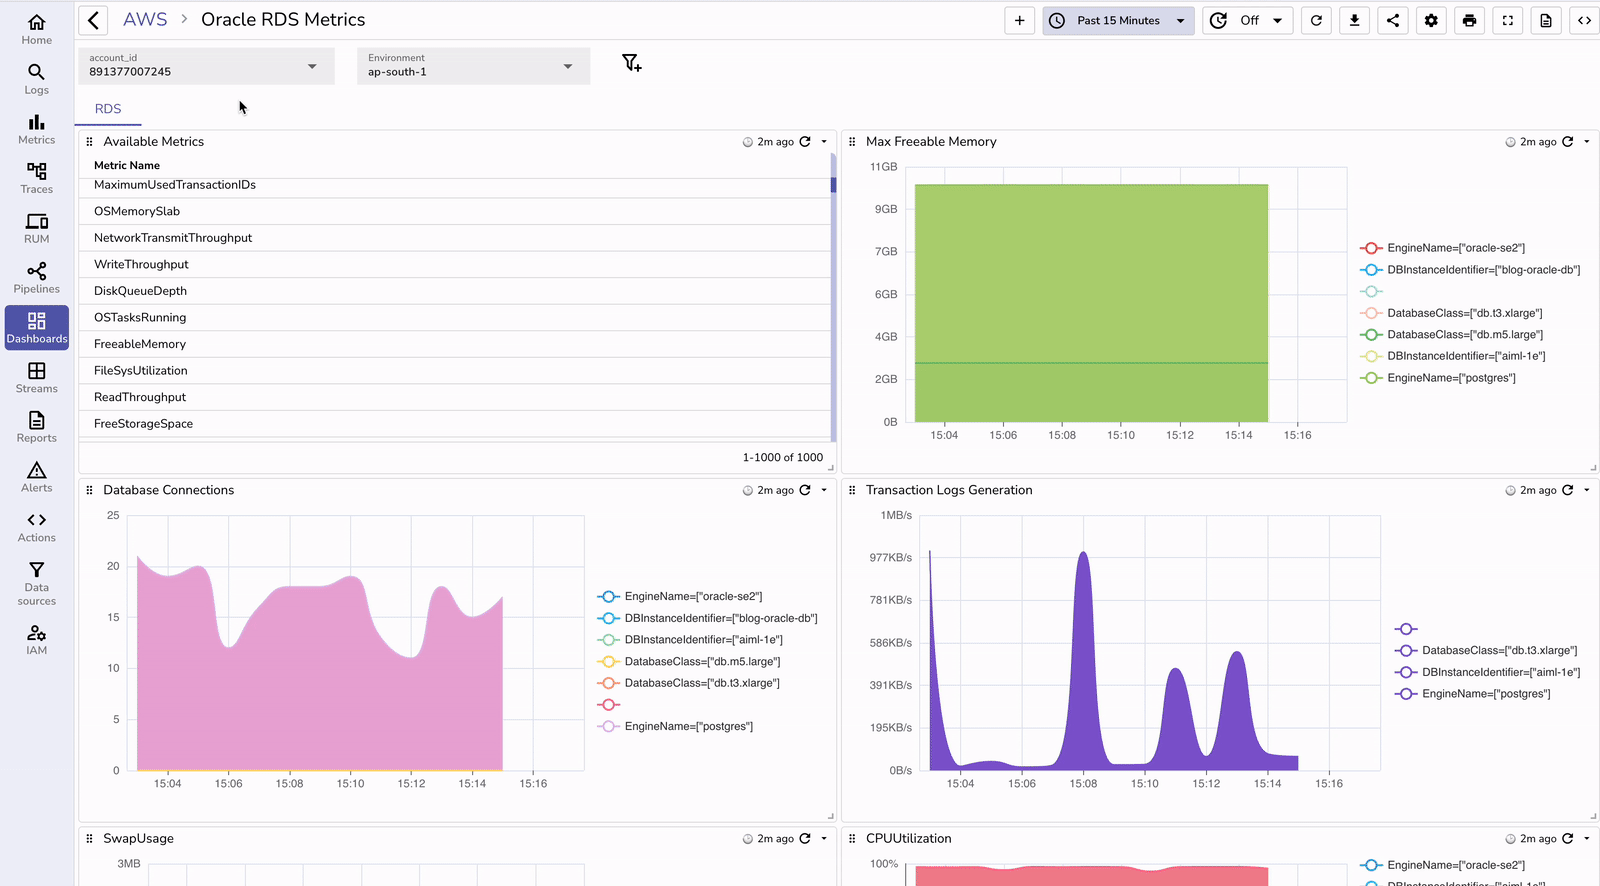
After integrating with OpenObserve, you gain access to pre-built dashboards specifically designed for Oracle RDS monitoring. These dashboards provide immediate visibility into the health and performance of your Oracle database.
Oracle RDS Metrics.dashboard.json
The pre-built Oracle RDS dashboards in OpenObserve visualize critical metrics including:
While the pre-built dashboards offer a great starting point, OpenObserve allows you to customize these dashboards or create entirely new ones tailored to your specific monitoring needs.
To illustrate the tangible benefits of integrating OpenObserve with your AWS RDS Oracle SE2 setup, here's a comparison table:
| Aspect | Without OpenObserve | With OpenObserve |
|---|---|---|
| Dashboard Capabilities | Basic CloudWatch dashboards | Rich, Oracle-specific pre-built dashboards with advanced customization |
| Query Capabilities | Limited CloudWatch Metrics Insights | Powerful query language for complex metric analysis |
| Alert Management | Basic CloudWatch alarms | Sophisticated alerting with multi-condition triggers and intelligent alert routing |
| Incident Response Time | Typically slower due to limited visibility | Up to 65% faster due to comprehensive visualizations and faster root cause analysis |
| Cost | Higher costs for extended CloudWatch metrics and dashboards | Lower total cost with more comprehensive features |
| Cross-Service Correlation | Difficult to correlate RDS issues with other AWS services | Unified view of all AWS services for easier troubleshooting |
| Historical Analysis | Limited by CloudWatch retention | Comprehensive historical analysis for capacity planning |
| Anomaly Detection | Basic CloudWatch anomaly detection | SQL mode for custom queries to control anomaly detection with context-aware alerts |
Understanding how Oracle database operates within the AWS RDS environment helps maximize the effectiveness of your monitoring strategy.
In AWS RDS, Oracle databases maintain the same core architecture as traditional Oracle deployments, with some key differences:
For more details on the architecture, you can read this user guide from amazon.
Instance Management: AWS manages the Oracle instance, including the background processes and memory structures.
Storage Subsystem: Rather than using Oracle ASM (Automatic Storage Management), RDS uses AWS's storage infrastructure, which includes:
Memory Structures: Standard Oracle memory structures are preserved:
Background Processes: All essential Oracle background processes run in RDS:
Oracle Standard Edition 2 in RDS has some limitations compared to Enterprise Edition:
Despite these limitations, Oracle SE2 on RDS provides excellent performance for most applications while considerably reducing licensing costs.
Setting up AWS RDS Oracle SE2 with OpenObserve monitoring represents a powerful combination that delivers both robust database capabilities and comprehensive observability. By following the steps outlined in this guide, you can establish a solid foundation for your Oracle database operations while gaining deep insights into performance metrics through OpenObserve's advanced monitoring capabilities.
The integration with OpenObserve via CloudFormation templates simplifies what would otherwise be a complex monitoring setup, providing immediate access to pre-built dashboards and sophisticated alerting mechanisms. This approach not only enhances visibility into your database operations but also improves incident response times, reduces monitoring costs, and provides a unified view across your entire AWS environment.
For organizations looking to maximize the value of their AWS RDS Oracle SE2 deployment, implementing OpenObserve monitoring should be considered an essential component of a comprehensive database management strategy.
Get Started with OpenObserve Today!
Sign up for a free trial of OpenObserve on our website. Check out our GitHub repository for self-hosting and contribution opportunities.
Chaitanya Sistla is a Principal Solutions Architect with 17X certifications across Cloud, Data, DevOps, and Cybersecurity. Leveraging extensive startup experience and a focus on MLOps, Chaitanya excels at designing scalable, innovative solutions that drive operational excellence and business transformation.


