Learn how to monitor AWS RDS metrics efficiently using AWS CloudWatch and OpenTelemetry. This guide covers end-to-end steps, including creating a CloudWatch metric stream, setting up a Kinesis data stream, and ingesting RDS metrics via OpenTelemetry for centralized monitoring. Perfect for managing multiple AWS accounts and ensuring optimal database performance.
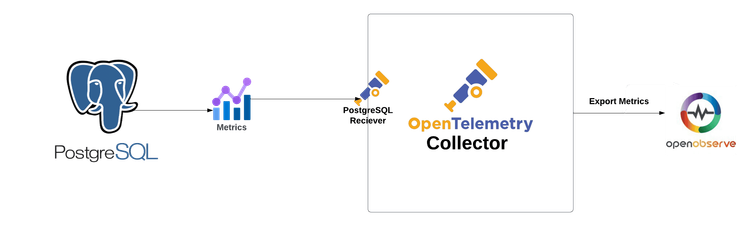
Monitor PostgreSQL like a pro! Use OpenTelemetry and Openobserve for clear insights into performance metrics. Begin your journey to better monitoring today!
Learn how to monitor AWS EC2 logs and metrics using OpenTelemetry. Set up real-time and continuous monitoring for performance, security, and compliance.
Discover everything you need to know about Prometheus metrics, from its architecture and setting up efficient metrics collection to optimizing and visualizing data for scalable observability. This guide covers how to leverage Prometheus for insightful monitoring, making it easier to ensure system performance and reliability at scale. Perfect for DevOps engineers and observability enthusiasts, this blog provides actionable insights on maximizing Prometheus capabilities to enhance your infrastructure monitoring.
Send metrics using kube-prometheus-stack to OpenObserve
Explore how OpenObserve, an open-source observability tool, collaborates seamlessly with GitHub Actions through the 'openobserve_github_action_logs' repository by Mark Percival. This integration offers developers an efficient way to capture logs, enabling long-term analysis to detect build patterns and improve CI/CD pipelines. Dive into the benefits of continuous data monitoring and how it can revolutionize your software delivery process.