Post by the tag: Integrations
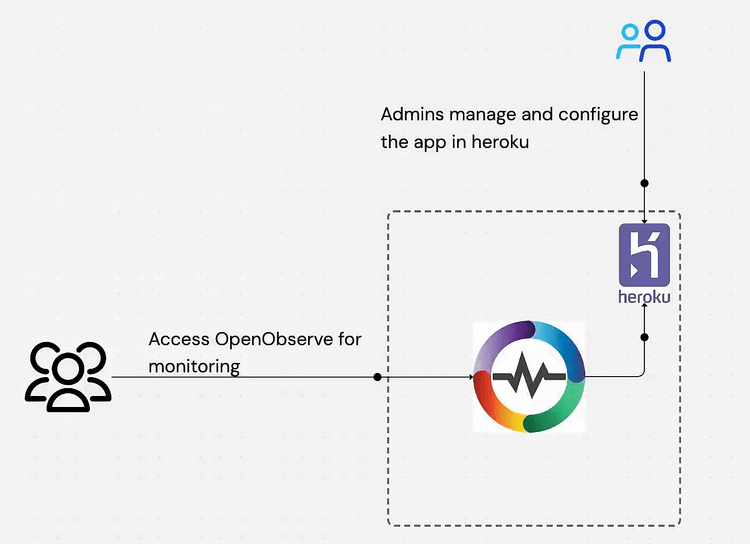
Deploy OpenObserve on Heroku without DevOps complexity. Get logs, metrics, and traces monitoring running in minutes with our comprehensive deployment guide.
Unlock the full potential of your ArgoCD deployments with Prometheus and OpenObserve monitoring. Get real-time insights into application health, sync status, and reconciliation performance.
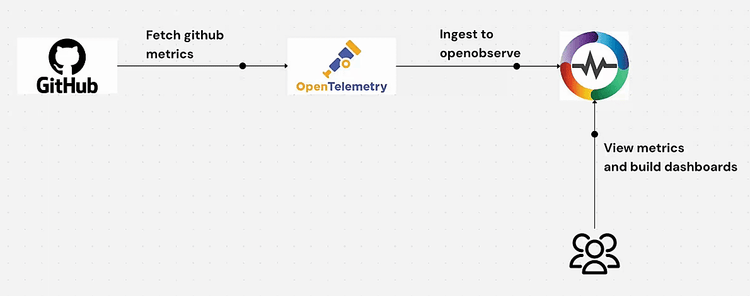
Learn how to set up real-time GitHub metrics monitoring using OpenTelemetry Collector and OpenObserve. This step-by-step guide covers installation, configuration, and visualization of repository analytics, PR metrics, and contributor statistics. Perfect for DevOps teams looking to gain deeper insights into their development workflows and improve productivity with data-driven decisions.
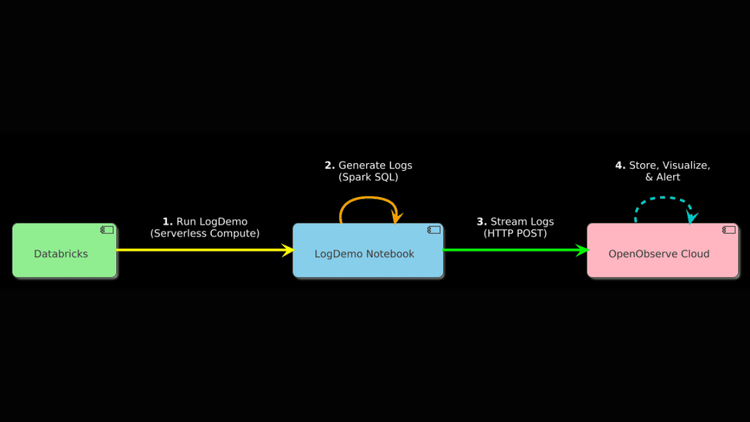
This guide explains how to monitor Databricks logs in real time using OpenObserve.
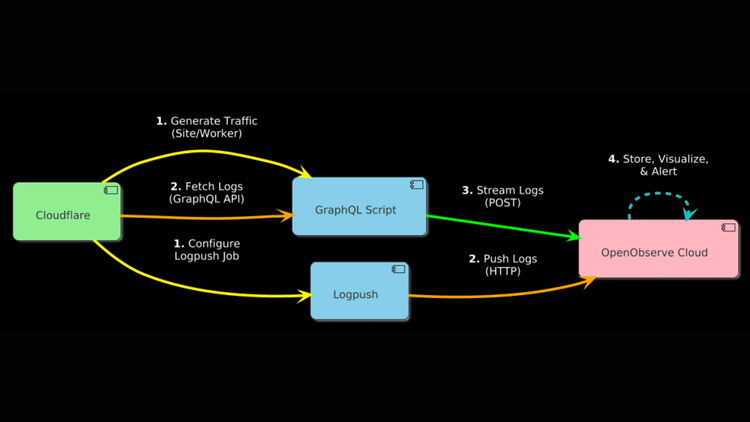
This guide demonstrates how to stream Cloudflare HTTP request logs to OpenObserve using GraphQL API polling or Logpush HTTP push.
This comprehensive guide walks you through the process of integrating PagerDuty with OpenObserve for effective incident management. You'll learn how to set up a PagerDuty service, create alert templates in OpenObserve, configure webhook destinations, and test your integration. Perfect for DevOps engineers, SREs, and IT professionals looking to streamline their alerting workflow and improve response times to critical issues.
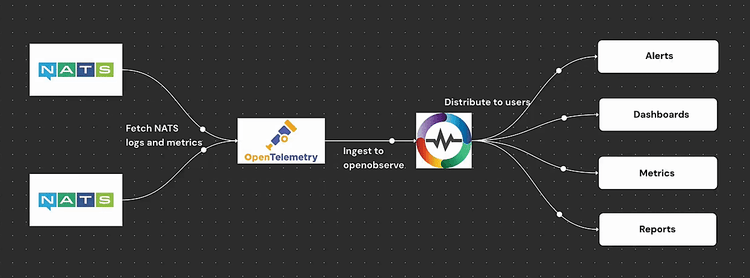
Boost your NATS infrastructure reliability with comprehensive observability. This guide covers log collection, metric analysis, visualization tools, and best practices for effective monitoring.
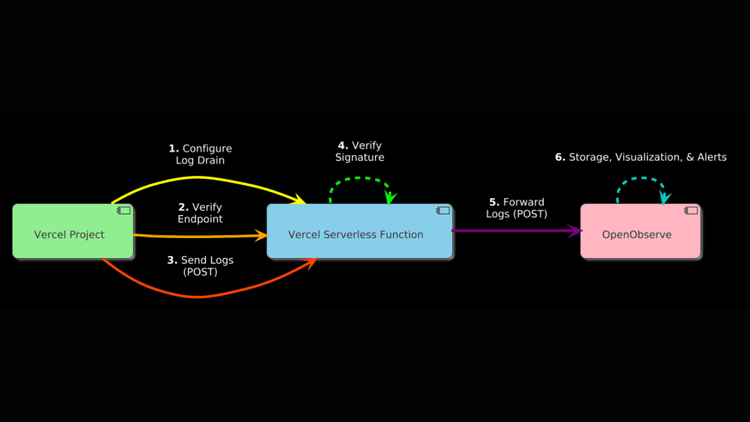
Learn how to set up Vercel Log Drains to seamlessly send logs to OpenObserve using a serverless function.
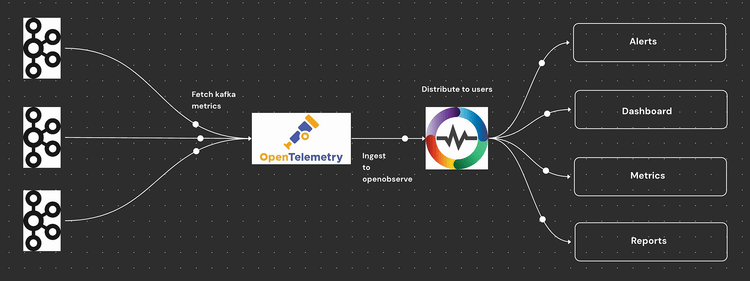
Learn how to monitor Apache Kafka metrics effectively using OpenTelemetry Collector Contrib and OpenObserve. This detailed guide covers Kafka installation, setting up OpenTelemetry for real-time Kafka monitoring, configuring dashboards, and tracking key Kafka metrics like brokers, consumer groups, partition offsets, replicas, and message rates. Discover the benefits of monitoring Kafka with OpenObserve, including automated alerts, performance insights, and data integrity checks. Optimize your Kafka infrastructure with proactive monitoring and real-time observability—boost system reliability, detect issues early, and scale efficiently.
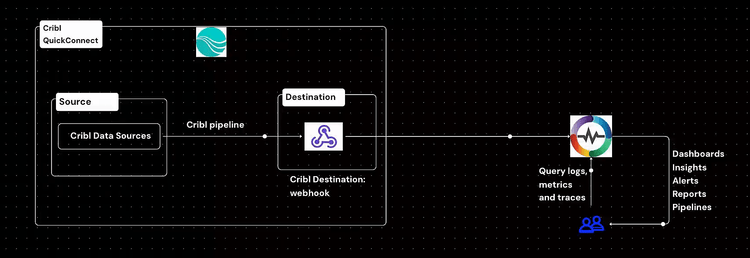
Learn how to integrate Cribl, a powerful data engine, with OpenObserve for efficient log and trace ingestion. Step-by-step setup, webhook configuration, and monitoring included.
Learn how to effectively monitor RabbitMQ performance metrics using OpenTelemetry Collector. Master message queue monitoring, track broker health, and optimize your messaging infrastructure with our comprehensive guide.
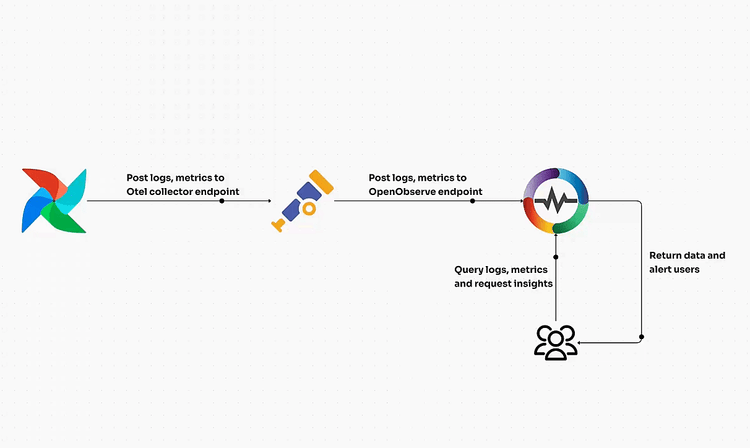
Discover how to integrate OpenObserve and OpenLIT for comprehensive LLM observability, enabling real-time monitoring, tracing, and optimization of AI application performance.
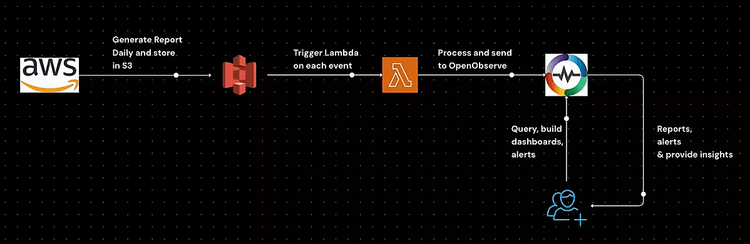
Learn how to generate AWS Cost and Usage Reports (CUR), store them in S3, configure event-driven processing with Lambda, and analyze cost data efficiently. This step-by-step guide covers IAM policies, S3 event setup, and automated cost analysis to help you optimize AWS spending.
Learn how to monitor Apache Airflow logs, metrics, and traces using OpenTelemetry and OpenObserve. Set up Airflow logging, configure OpenTelemetry, and visualize insights with pre-built dashboards.
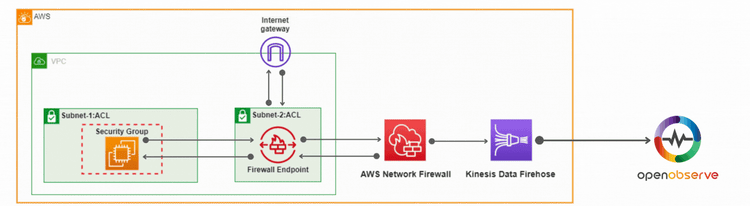
Learn how to secure your AWS environment with AWS Network Firewall. This comprehensive guide covers setup, configuring rules, controlling traffic, and log analysis using OpenObserve for actionable insights.
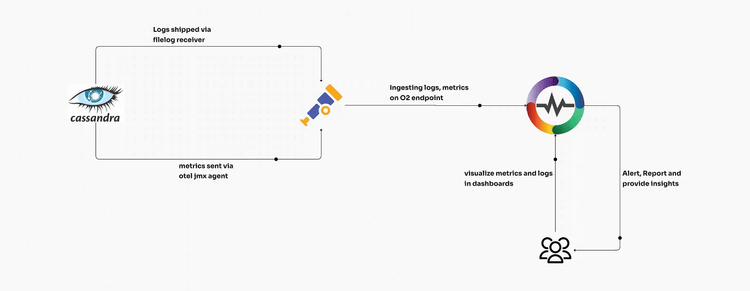
Learn how to monitor Apache Cassandra using OpenTelemetry for collecting metrics and logs. This step-by-step guide covers JMX-based metrics collection, log ingestion and OpenTelemetry configuration for complete observability.
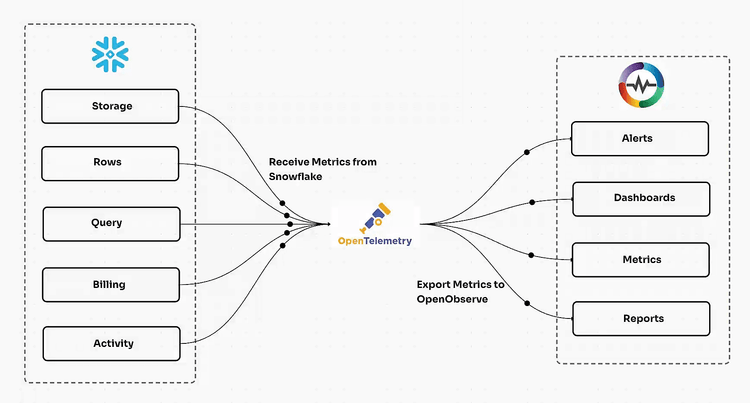
Discover the ultimate guide to monitoring Snowflake with OpenTelemetry. Learn how to set up seamless telemetry for Snowflake, track performance metrics, identify anomalies, and optimize data operations. This comprehensive tutorial covers everything from configuration to advanced monitoring techniques, ensuring robust observability and actionable insights into your Snowflake environment. Perfect for data engineers, DevOps teams, and analytics professionals seeking to enhance Snowflake monitoring efficiency with OpenTelemetry.
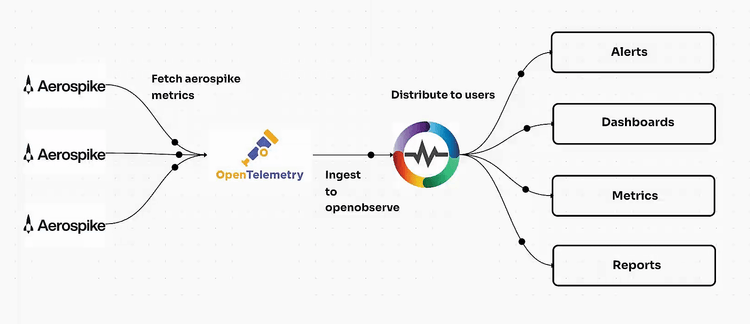
Learn how to set up and monitor Aerospike using the OpenTelemetry receiver in this comprehensive guide. Includes step-by-step instructions for installation, configuration, and metrics integration with OpenTelemetry for efficient Aerospike database monitoring.
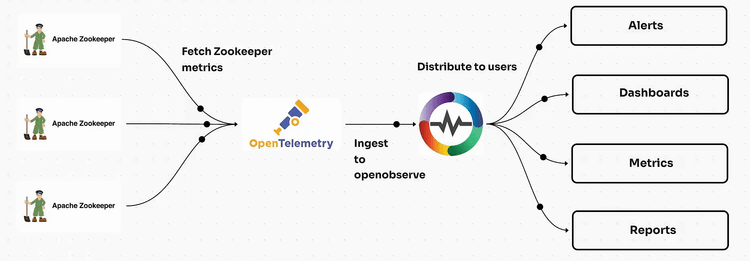
Learn how to set up and monitor ZooKeeper using the OpenTelemetry receiver in this comprehensive guide. Includes step-by-step instructions for installation, configuration, and metrics integration with OpenTelemetry for efficient ZooKeeper monitoring.
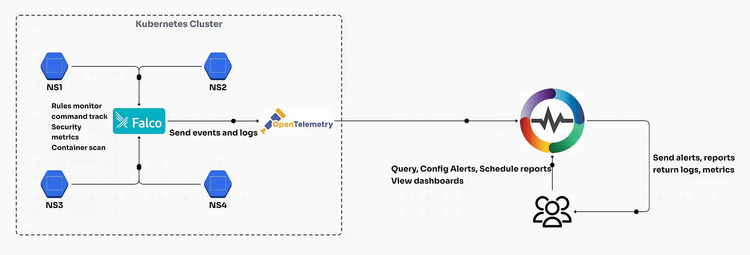
Discover how Falco Container Security enhances Kubernetes cluster protection by detecting threats in real time. Learn its features, setup process, and how to integrate Falco with OpenTelemetry for comprehensive security monitoring.
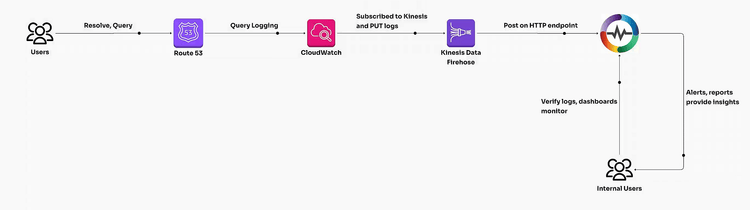
Learn how to enable AWS Route 53 query logging, transform logs with VRL, and build dashboards for actionable insights. Unlock DNS traffic analysis and optimize performance with this step-by-step guide."