Post by the tag: DevOps
Unlock the full potential of your ArgoCD deployments with Prometheus and OpenObserve monitoring. Get real-time insights into application health, sync status, and reconciliation performance.
Learn how to set up real-time GitHub metrics monitoring using OpenTelemetry Collector and OpenObserve. This step-by-step guide covers installation, configuration, and visualization of repository analytics, PR metrics, and contributor statistics. Perfect for DevOps teams looking to gain deeper insights into their development workflows and improve productivity with data-driven decisions.
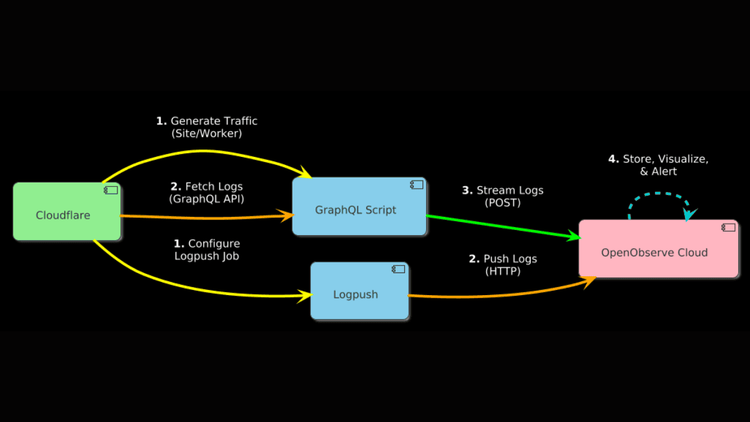
This guide demonstrates how to stream Cloudflare HTTP request logs to OpenObserve using GraphQL API polling or Logpush HTTP push.
Boost your NATS infrastructure reliability with comprehensive observability. This guide covers log collection, metric analysis, visualization tools, and best practices for effective monitoring.
Learn how to monitor Apache Kafka metrics effectively using OpenTelemetry Collector Contrib and OpenObserve. This detailed guide covers Kafka installation, setting up OpenTelemetry for real-time Kafka monitoring, configuring dashboards, and tracking key Kafka metrics like brokers, consumer groups, partition offsets, replicas, and message rates. Discover the benefits of monitoring Kafka with OpenObserve, including automated alerts, performance insights, and data integrity checks. Optimize your Kafka infrastructure with proactive monitoring and real-time observability—boost system reliability, detect issues early, and scale efficiently.
Learn how to integrate Cribl, a powerful data engine, with OpenObserve for efficient log and trace ingestion. Step-by-step setup, webhook configuration, and monitoring included.
Learn how to monitor Jenkins pipelines effectively with this comprehensive guide on integrating OpenTelemetry and OpenObserve. Discover step-by-step instructions for capturing Jenkins logs, metrics, and traces to enhance CI/CD observability and optimize pipeline performance.
Learn how to store and monitor Ansible logs effortlessly with this step-by-step guide. Discover best practices for Ansible log management, setup instructions, and tips for using Fluent Bit to centralize logs for real-time monitoring and troubleshooting.
Learn how to generate, configure, and ingest Terraform logs with Fluent Bit to OpenObserve. This step-by-step guide covers essential logging for auditing, troubleshooting, and optimizing your infrastructure, ensuring comprehensive visibility and compliance in your infrastructure-as-code deployments.
Explore how OpenObserve, an open-source observability tool, collaborates seamlessly with GitHub Actions through the 'openobserve_github_action_logs' repository by Mark Percival. This integration offers developers an efficient way to capture logs, enabling long-term analysis to detect build patterns and improve CI/CD pipelines. Dive into the benefits of continuous data monitoring and how it can revolutionize your software delivery process.