Understanding OpenTelemetry Logging

Manas Sharma
September 23, 2024
8 min read
Don’t forget to share!
Try OpenObserve Cloud today for more efficient and performant observability.
OpenTelemetry is an open-source observability framework designed to help developers collect and manage telemetry data at scale. Whether we're tracking logs, metrics, or traces, OpenTelemetry provides a unified approach to monitoring and understanding our applications' behavior.
In this blog, we’ll focus on OpenTelemetry logs — a critical part of the observability ecosystem that gives visibility into your application's operations. Let’s dive into how OpenTelemetry logs can enhance your system's reliability and troubleshooting.
OpenTelemetry simplifies instrumentation by making it easy to integrate into any application, regardless of language or infrastructure. Instead of being tied to specific tools, it gives you the flexibility to use your observability backends of choice — making it incredibly versatile.
Initially born from a merger of OpenCensus and OpenTracing, OpenTelemetry is now maintained by the Cloud Native Computing Foundation (CNCF), ensuring its neutrality and community-driven evolution.
OpenTelemetry covers three essential pillars of observability:
Today’s microservices and distributed architectures need robust logging to help teams track down performance issues or unexpected behavior. However, common logging challenges arise, such as:
OpenTelemetry logs aim to solve these challenges by providing a structured, standardized way to handle logs across all environments.
Understanding log levels is key to effective monitoring. OpenTelemetry offers different log levels like DEBUG, INFO, WARNING, ERROR, and CRITICAL to classify log importance.
Tip: Always structure logs uniformly to ease
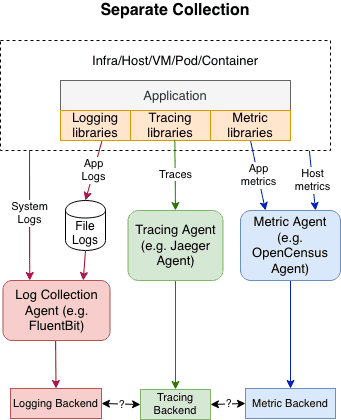
Traditional logging approaches often fall short when it comes to correlating different telemetry signals. Most existing systems use separate tools for logs, metrics, and traces, making it difficult to get a holistic view of your application's health.
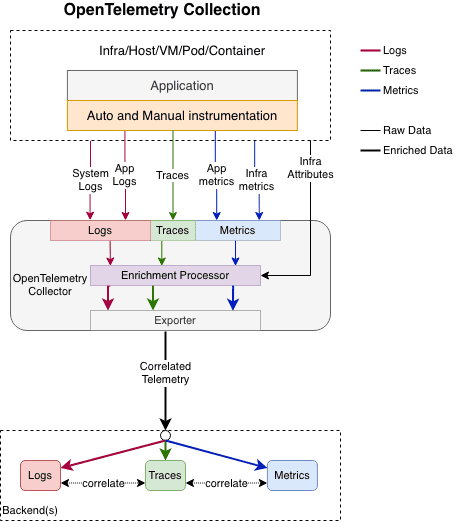
With OpenTelemetry, logs can be correlated with other telemetry signals like traces and spans, offering deeper insights. This context helps teams make smarter decisions based on actual user interactions with their system.
OpenTelemetry doesn’t ask you to ditch your existing setup. It seamlessly integrates with common logging libraries, ensuring that your system can evolve while still benefiting from your current logs.
OpenTelemetry uses a Log Data Model that standardizes what should be included in a log. This model defines what constitutes a LogRecord, ensuring that logs are consistent across services and backends.
You can learn more about the data model here.
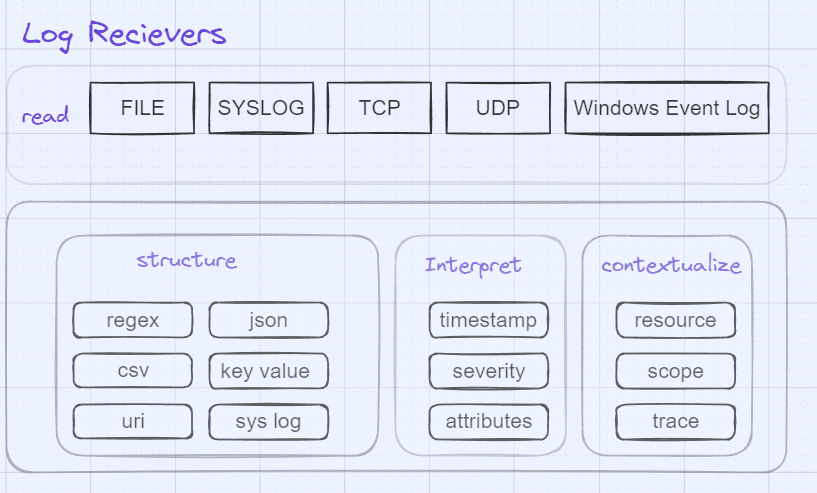
Existing log formats can be unambiguously mapped to the OpenTelemetry Log Data Model. The OpenTelemetry Collector can read such logs and translate them to the OpenTelemetry Log Data Model.
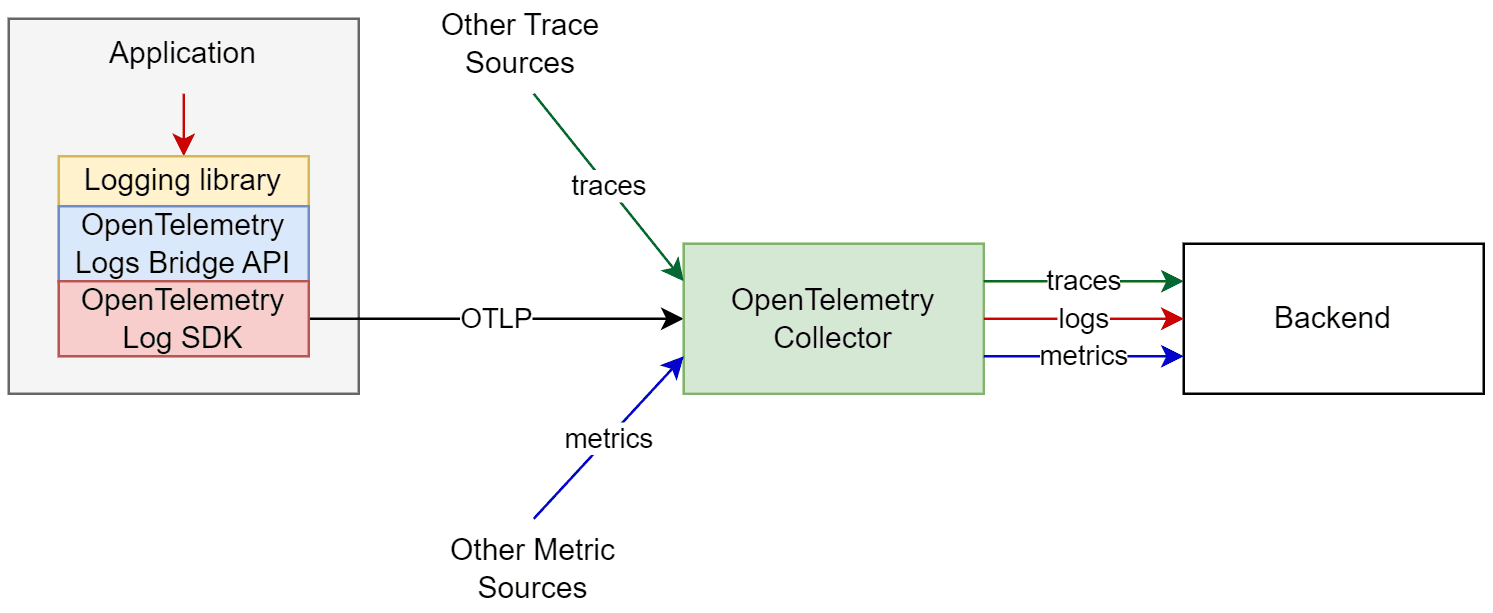
To emit LogRecords, OpenTelemetry exposes a Logs Bridge API. It is not recommended for application developers to make direct calls to this API. The API is made available to library authors so they can create log appenders, which act as a bridge between the OpenTelemetry Log Data Model and already available logging libraries. OpenTelemetry does not intend to provide a feature-rich logging library.
An SDK Implementation of the Bridge API defined by OpenTelemetry makes it possible to configure the processing and exporting of LogRecords.
As described earlier, opentelemetry provides extensions for a few widely used logging library languages to facilitate manual/auto instrumentation scenarios. The modifications will make it possible to transmit logs via the OTLP protocol to the backend or the Collector and enable the inclusion of the trace context in the logs.
To minimize the number of changes needed to migrate to OpenTelemetry for logs, OpenTelemetry offers a variety of receivers and processors for gathering system and infrastructure logs, first-party, and third-party application logs via the OpenTelemetry Collector or already-existing agents like FluentBit.
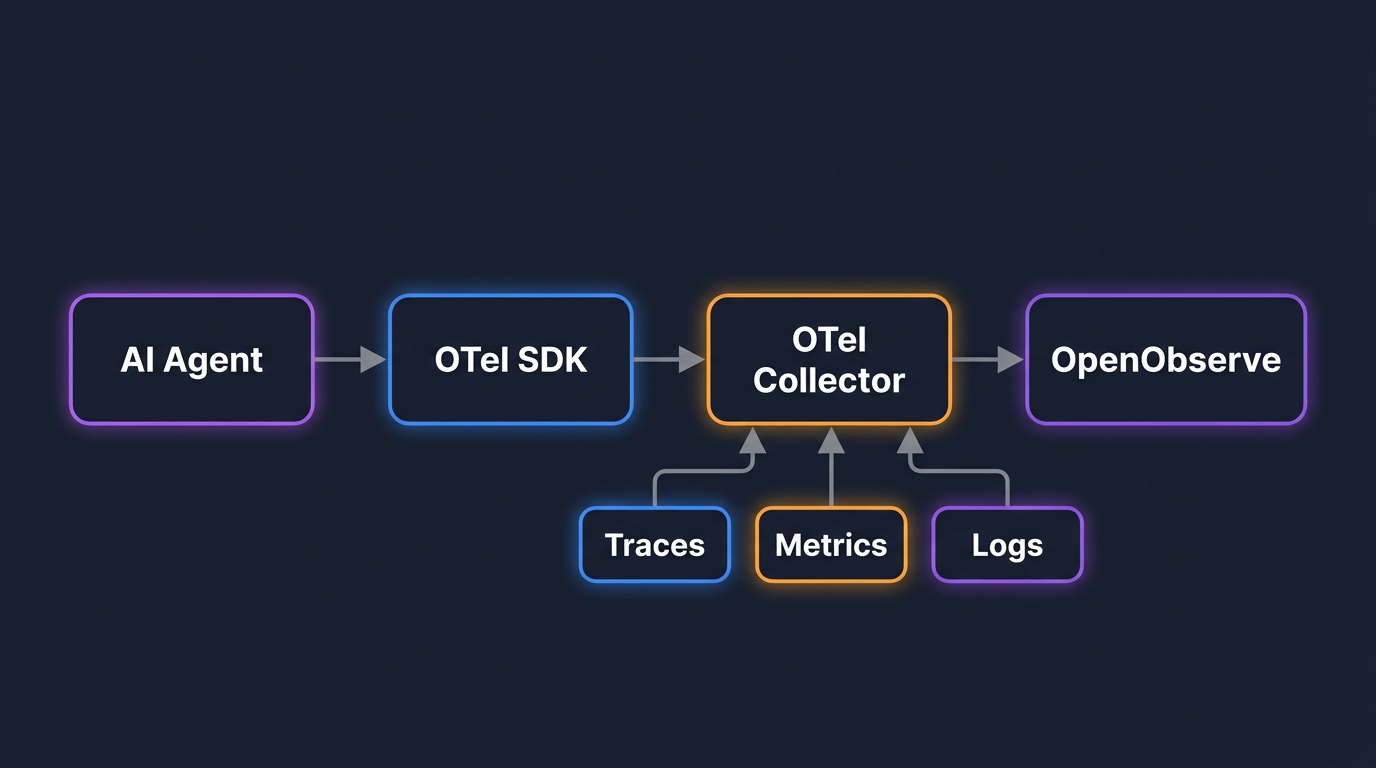
There are two primary ways to collect logs in OpenTelemetry:
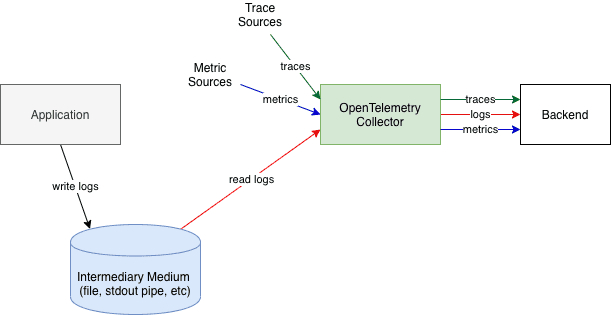
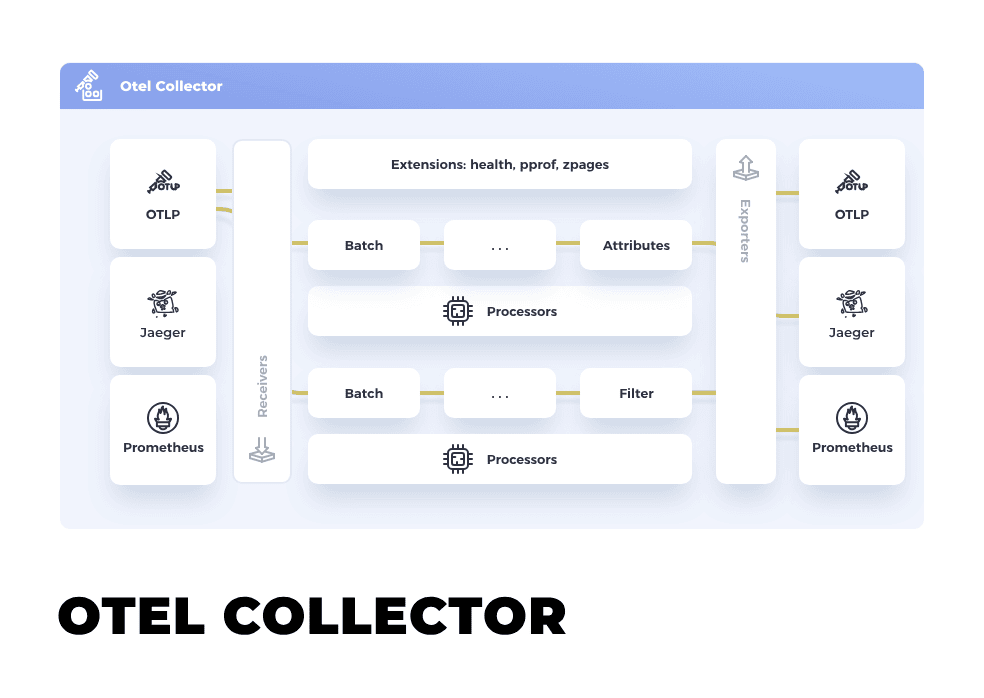
The OpenTelemetry Collector is a vendor-agnostic tool designed to collect, process, and export telemetry data. It acts as the central hub, gathering data from multiple sources and ensuring it reaches your chosen destination efficiently.
Here’s an example of a config.yaml setup for sending logs:
receivers:
  otlp:
    protocols:
      grpc:
      http:

exporters:
  logging:
    loglevel: debug

service:
  pipelines:
    logs:
      receivers: [otlp]
      exporters: [logging]
Let’s take an example in Python using the FastAPI framework.
By using the FastAPI Instrumentor, you can automatically collect trace context for every request without changing your code:
FastAPIInstrumentor.instrument_app(app)
This integration allows automatic span creation for traces, making it easier to trace requests and correlate logs with the correct spans and traces.
This single line of code does a lot of work behind the scenes:
Refer to OpenTelemetry Docs to learn more about OpenTelemetry instrumentation FastAPI.
When integrating OpenObserve into your application, it's crucial to double-check your configuration settings to prevent potential issues. Misconfigured endpoints or incorrect authentication tokens can hinder the smooth execution of your application, just like any other automation script. For instance, if you're self-hosting OpenObserve locally, ensure that the endpoint is correctly set to port 5080 in your configuration.
Troubleshooting in Action
In my experience, I encountered a notable issue where the OpenTelemetry Collector failed to communicate with OpenObserve on my Windows machine. After thorough investigation, I traced the root cause to a misconfiguration in the network settings for port 5080, resulting in failed log transmissions.
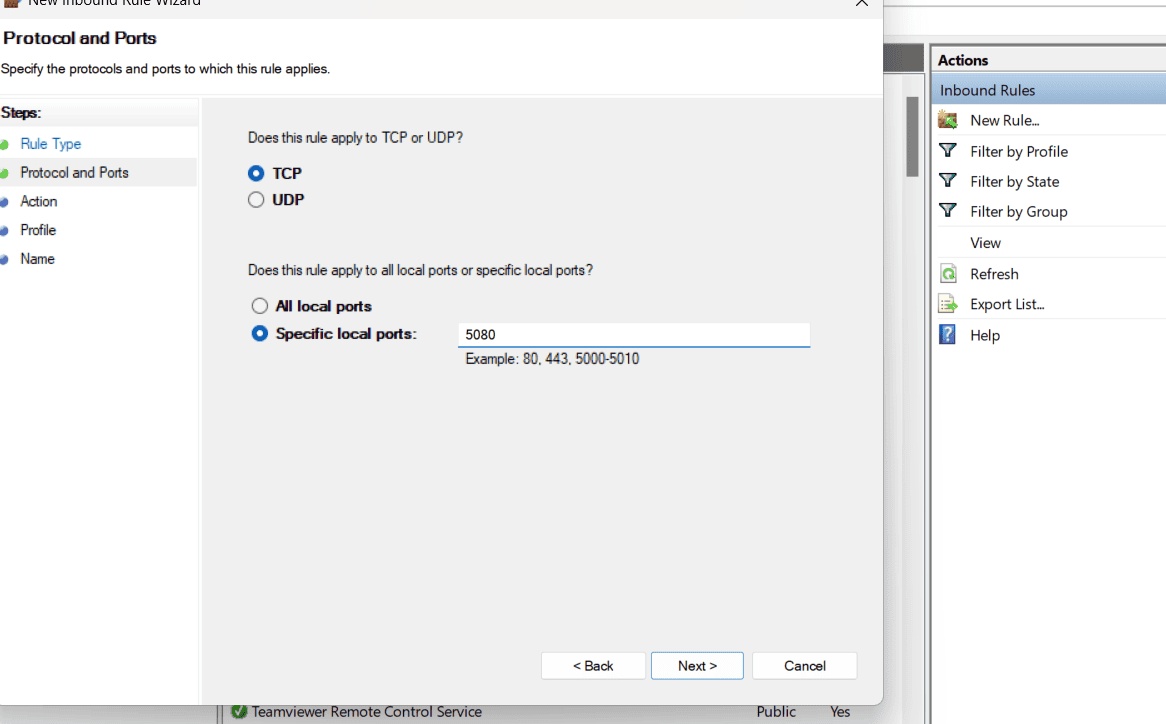
To resolve this issue, I manually configured the network settings for port 5080 on my Windows machine, as shown in the reference image above.
As our app scales, performance issues can crop up. To avoid bottlenecks:
For advanced performance tips, check out the OpenTelemetry Discussions.
OpenTelemetry logs make collecting and managing observability data powerful and simple by fundamentally designing logging to be part of the process of collecting and correlating observability signals. For example, OpenTelemetry enables existing logging libraries to send data in the OpenTelemetry logging format almost instantly. It also supports a standard and extensible data model that can bring log data into context by correlating it with trace and metrics data.
To get started with OpenTelemetry logs, follow these next steps:
Manas is a passionate Dev and Cloud Advocate with a strong focus on cloud-native technologies, including observability, cloud, kubernetes, and opensource. building bridges between tech and community.